Abstract
In order to meet the architecture and construction needs of high rise buildings, the special-shaped columns are becoming more and more widely used. In this study, cyclic tests on seven special-shaped bifurcated Concrete Filled Steel Tube (CFST) columns are carried out. Test variables are the column cross section types and the loading directions. The strength, ductility, hysteretic behavior, energy dissipation ability, failure modes and seismic mechanisms are analyzed. Test results show that: the cross-section type of the column is the main factor influencing the seismic behavior of the specimens. Compared with the basic cross section type, the strength, ductility and energy dissipation capacity of the strengthened cross section type all significantly increased. The cross sections with the inserted angle steel or circular steel tube have the best comprehensive seismic behavior. Also, the loading direction has a considerable influence on the seismic behavior. Compares with the short axis loading specimen C1-Y, the strength of the long axis specimen C1-X and 45° axis C1-Z increase by 92.5 % and 44.0 %, respectively, indicating that the differences in loading direction should be taken into consideration in the seismic design. Based on the test results, the FEM analysis are also carried out. The FEM results show a satisfactory agreement with experimental results. The concrete constitutive relationship and modelling method proposed is suitable for the simulation of special-shaped bifurcated CFST columns with multiple cavities.
1. Introduction
Concrete-filled steel tube (CFST) members have excellent structural properties for seismic resistance, such as high strength, large lateral stiffness, high ductility, and large energy dissipation capacity. For these reasons, CFST members have been increasingly investigated over the past few decades to better understand their behavior. Wang et al. [1] investigated the effect of size on the bearing capacity on circle CFST with different ratios of diameter to thickness of steel tube subjected to axial compression. The test results indicated that the peak nominal stress decreased as the size increased, and the decrease in the nominal stress due to the size effect increased at higher ratios of diameter to thickness. Dong et al. [2] investigated the effectiveness of such external confinement on the structural performance of CFST. And the formulas for predicting the yield and ultimate strengths were developed. Ekmekyapar [3] conducted 18 CFST columns with different lateral weld locations to assess the performance of laterally and longitudinally welded columns. The results showed that seam weld failures had slight effects on capacity and failure mode, and reduced ductility. Zhu et al. [4] tested 30 CFST with different thicknesses of steel tube and different stiffening methods to investigate the compressive behavior. The results demonstrated that the inner stiffeners affected the deformability, failure mode and overall strength of the stub columns with the thicker tubes more significantly. Dundu [5] investigated the behavior of 24 CFST columns with different lengths, diameters, strengths of steel tubes and concrete strengths, and made a comparison between test results and calculated values predicted by the South African code and Eurocode 4. Abed et al. [6] presented an experimental study to investigate the compressive behavior of circular CFSTs with different diameter-to-thickness and concrete strengths subjected to axial loading. The test results were compared to their corresponding theoretical values predicted by different international codes and standards, and verified by FEM. There are also several design codes governing CFST structure in different countries, such as ACI 318-11 [7], EuroCode EC4-2004 [8], AISC-LRFD [9], AIJ-2010 [10] and CECS28-2012 [11].
In recent years, with the development of high-rise buildings, the mega concrete filled steel tube (CFST) columns have been developed as an efficient earthquake-resistant structural system. Mega CFST columns are usually placed in the corner of the buildings to carry the large axial force. In order to meet the requirements of architectural design, cost and construction, the cross section of Mega CFST columns is commonly designed as a special-shaped section. Shen et al. [12] carried out an experimental study on L-shaped stiffened CFST columns subjected to cyclic load, the seismic behavior was investigated. Zuo et al. [13] studied the mechanical behavior of T-shaped and L-shaped CFST columns under axial load. Xu et al. [14, 15] investigated the compressive and flexural behavior of hexagonal CFST members, and studied the failure modes, load versus deformation relations and strain developments, and established an element analysis model. Tu et al. [16] focused on the T-shaped CFST columns with multiple cavities and investigated the confinement effect of steel tube on core concrete. Sinha et al. [17] carried out a study on the bi-biased cruciform column and investigated the curves of biaxial compression flexure members according to different cross-sectional dimensions and structural reinforcement bars. Dundar et al. [18] proposed a new method to calculate the ultimate strength and to dimensioning the arbitrarily shaped reinforced concrete sections.
Previous research shows that the special shaped CFST columns have high bearing strength and good ductility. The reasonable construction measures, such as type of multiple cavities, arrangement of reinforcing bars, encased shape steel or steel tubes, can effectively improve seismic behavior of special-shaped CFST columns. In this paper, the seismic behavior of octagonal-shaped mega CFST columns derived from Beijing “China Zun” tower with a total height of 528 meters are studied. (Fig. 1(a)). Based on architectural needs, the Octagonal CFST mega-columns are split into two parts at a height of 43.15 m to form a bifurcation joint, as shown in the red circle Fig. 1(b).
Fig. 1Design and construction of Beijing China Zun tower
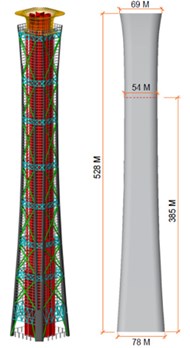
a) Conception design
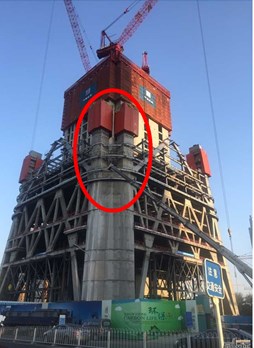
b) Bifurcated CFST column
There are already several studies on the bifurcated CFST columns. Wang et al. [19] studied the mechanical behavior of CFST intersecting connections with rectangular and circular section based on the practical engineering project. Li et al. [20] presented an experimental research program on the nodes of square CFST bifurcate column and steel beam under low-cycle reversed load. The results showed that the seismic performance was good for the beam plastic hinge failure mode. While for the local weld failure mode, the seismic performance was poor. And the test results were made comparisons with the simulation results of fiber line element model. Cui et al. [21] analyzed the stable capability of Y-shaped columns under horizontal loads. The test results indicated that out-plane buckling of upper branch was the main buckling mode for Y-shaped column under vertical loads. Yang et al. [22] investigated the influences for multi-cell mega-bifurcated CFST with different construction measures. Test results showed that the multi-cell mega-bifurcated CFST with construction measures behaved great improvement in terms of stiffness degeneration, ductility and energy dissipation capacity.
The past researches are mainly focused on the compressive and seismic performance of CFST intersecting connections with conventional cross-section under axial load. And there are few studies on the seismic performance of specially-shaped bifurcated CFST columns. Hence, in this paper, seven specimens were fabricated and subject to low cyclic reversed loading. In the field of structural engineering, besides the experimental study, many studies were also carried out using the numerical analysis methods [23-26]. Therefore, in this paper, both the experiment and Finite Element Modeling (FEM) analysis. Failure modes, hysteretic curves, strength and deformation capacity, stiffness and degradation are studied.
2. Experiment program
2.1. Design of test specimens
Seven specimens were designed and fabricated. Specimen details are shown in Table 1 and Fig. 3. Because of the restriction of load capacity, the specimens designed at a 1/30 scale were tested. Specimens vary by cross section type and were loaded along the long axis, short axis and 45° axis. Specimens are named as C1-X, C1-Y, C1-Z, C2-X, C3-X, C4-X, C5-X. The number “1” means the basic section used in the actual construction; the number “2” means the type 2 cross section with thicker steel plates; the number “3” means the type 3 cross section with additional cavities; the number “4” means the type 4 cross section with steel angles inserted; the number “5” means the type 5 cross section with circular steel tubes inserted. The letters “X, Y, Z” represent direction of the horizontal force, including loading along long axis, short axis and 45° axis.
Table 1Specimen lists
Specimen No. | Steel ratio / % | Confining factor | Axial force ratio | Loading direction | Section type | |||
Upper column | Lower column | Upper column | Lower column | Upper column | Lower column | |||
C1-X | 9.97 | 8.73 | 1.096 | 0.898 | 0.320 | 0.201 | Long axis Short axis 45° axis | Basic |
C1-Y | ||||||||
C1-Z | ||||||||
C2-X | 13.73 | 8.73 | 1.515 | 0.898 | 0.271 | 0.201 | Long axis | Steel plate thicken |
C3-X | 9.97 | 8.73 | 1.096 | 0.898 | 0.320 | 0.201 | Long axis | Multiple cavities |
C4-X | 10.69 | 9.17 | 1.185 | 0.947 | 0.309 | 0.197 | Long axis | Multiple cavities+ angle steel |
C5-X | 11.22 | 9.49 | 1.238 | 0.977 | 0.304 | 0.195 | Long axis | Multiple cavities+ steel tube |
The overall dimensions of the seven specimens are identical. The specimens are composed of an upper column and lower column. Three types of loading directions were designed. Variable loading directions were achieved by rotating the specimen within the load apparatus (Fig. 2(b)). Five different types of cross sections were designed. For the type 1 section, the upper column of the specimen was a four 4-cavity hexagonal section welded by 2 mm thick steel plate. The lower column was a 13-cavity octagonal section welded by 2 mm thick steel plate. 10 mm×2 mm vertical stiffeners were welded on the inside of each steel plate. Three diaphragms (2 mm×10 mm) were welded in the upper and lower columns to enhance the column stability. For the type 2 section, based on type 1 section, the outer steel plate of the bifurcation part was changed from 2 mm to 3 mm. For the type 3 section, from the surface of the lower column to the 180 mm below the surface (which is defined as the strengthened part in Fig. 2(a), the additional cavities were designed to enhance the strength of the bifurcation part, as shown in Fig. 2(c). As for the type 4 section, based on type 3, 40 mm×2 mm angle steel was added at both sides along the long axis, as shown in Fig. 2(d). For the type 5 section, based on type 3, Ø45×2 circular steel tubes were added along both sides along the long axis, as shown in Fig. 2(e).
Fig. 2Specimen detail (continued)
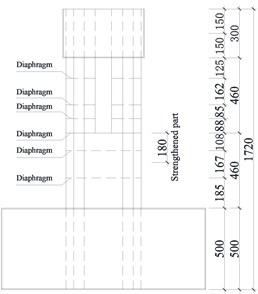
a) Elevation
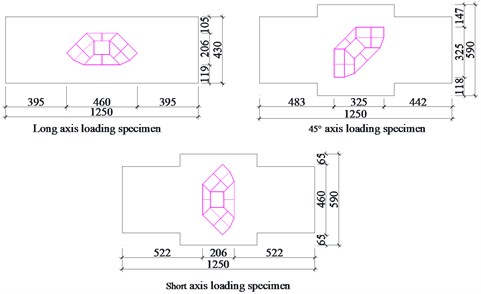
b) Load direction schematic

c) Type 1, 2 and 3 sections

d) Type 4 section

e) Type 5 section
2.2. Material properties
The concrete compression strength fcu,m is 48.5 MPa. Note that in Chinese code, the cubic test (size: 150 mm×150 mm×150 mm), rather than cylinder test, is adopted to evaluate the compression strength of concrete. Actual measured yield strength of steel fy, ultimate strength fu, elasticity modulus Es and ductility δ are shown in Table 2.
Table 2Mechanical properties of steel
Steel | fy / MPa | fu / MPa | Es / MPa | δ / % |
2 mm steel plate | 341.7 | 463.8 | 2.02×10⁵ | 26.3 % |
3 mm steel plate | 328.1 | 457.2 | 2.01×10⁵ | 23.6 % |
Ø45×2 steel tube | 310.1 | 422.5 | 2.00×10⁵ | 18.3 % |
2.3. Test setup and measurements
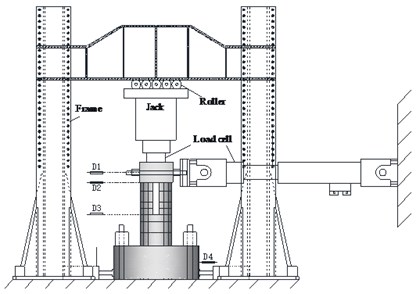
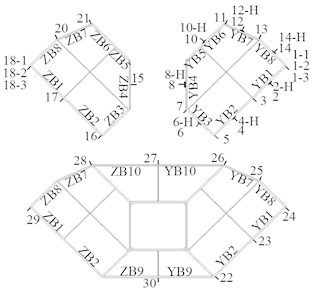
The test setup and measurements are shown in Fig. 3. Cyclic lateral loads were applied quasi statically to the loading beam while the vertical load was kept constant through the test. Three linear variable displacement transducers (LVDTs) were used to measure the deformation of the bifurcated column. Strain gauges were used at bottom of the upper and lower columns.
Fig. 3Test device and measurement arrangement for specimens subjected to axial compression
a)
b)
3. Test results and discussion
3.1. Damage and failure characteristics
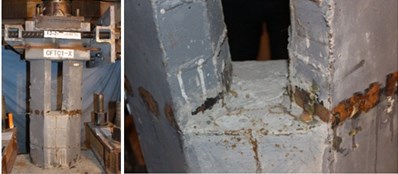
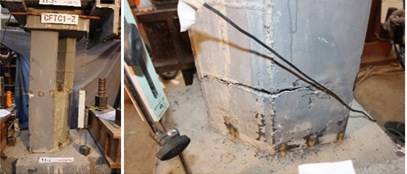
Fig. 4 shows the failure characteristics of each specimen. All specimens have similar failure characteristics. Specimen C1-X is selected as an example to describe specimen failure process:
1) The specimen shows no obvious damage when the drift ratio was less than 1.00 %.
2) On the top of the foundation, slight local buckling along the pressure side of steel plates ZB1, YB1, ZB8, and YB8 occurs when the drift ratio is 1.25 %.
3) When the drift ratio is 1.75 %, local buckling developed from the lower column to the upper column.
4) When the drift ratio is 2 %, the welding seam edge of steel plate YB10 at lower horizontal diaphragm of the lower column shows tiny cracking.
5) When the drift ratio is 2.5 %, local bulking becomes more and more significant at the lower diaphragm of the lower column; almost all the welding seam edge shows tiny cracking on the tension side.
6) When the drift ratio is 3 %, the welding seam of steel plate ZB2, YB2, ZB7 and YB7 at the lower diaphragm of the lower column fracture on the tension side.
7) When the drift ratio is 4 %, the welding seam on the steel plate at the lower diaphragm of the lower column experiences significant fracturing.
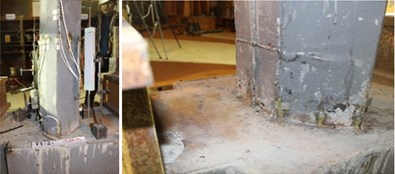
The failure characteristics of specimen C1-Y and C1-Z are shown in Fig. 4(b), (c). When the drift ratio is approximately 1.5 %, the welding seam edge of the steel along the lower diaphragm at the lower column shows slight cracking. When the drift ratio is 2.0 %, the welding seam of the steel plate at the lower diaphragm of the lower column shows serious cracking and the top surface of the foundation shows significant local buckling. With increasing load, crack length increases. When the drift ratio is 3.5 %, strength decreases rapidly.
Overall:
1) The arrangement of the welding seam leads to damage of the specimen. The welding residual stress reduces the strength and deformation capacity of steel plate.
2) The bending moment of the lower column is twice as larger as the upper column. The lower column reaches its ultimate strength and fails first.
3) Welding arrangement are the main factors influencing the damage distribution.
Fig. 4Failure characteristics of each specimen
a) C1-X
b) C1-Y
c) C1-Z
3.2. Hysteretic behavior
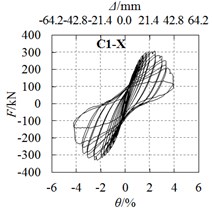
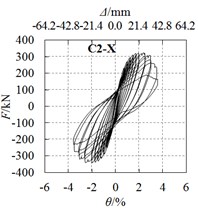
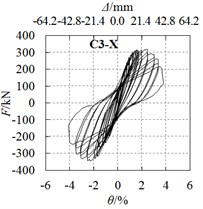
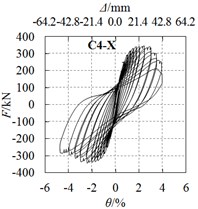
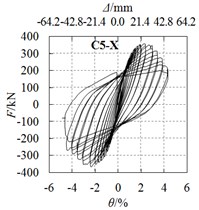
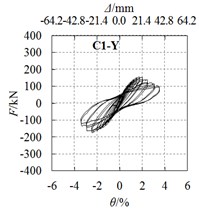
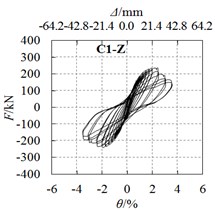
Horizontal force F and drift ratio θ curves of all specimens are shown in Fig. 5. Observations are as follows:
1) All hysteretic curves are stable and plump, no obvious pinch phenomena are observed.
2) For specimens under long axis loading, hysteretic curves for specimens C4-X (Fig. 5(d)) and C5-X (Fig. 5(e)) are plumper than the other specimens, the angle steel or the circular steel tube strengthening methods are effective in enhancing the seismic behavior.
3) For specimens C1-Y (Fig. 5(f)) and C1-Z (Fig. 5(g)) under short axis and 45° axis loading, the hysteretic curves are not as plump as specimen C1-X (Fig. 5(a)). The loading axis has a significant influence on seismic behavior, because cross section properties vary with the loading axis.
3.3. Strength and deformation capacity
Table 3 shows the strength and deformation capacities of all specimens. Fy is the yield load, which is determined by the R. Park method, Δy and θy are the corresponding yield displacement and yield drift ratio, respectively. Fp is peak strength, ∆p and θp are the corresponding peak displacement and peak drift ratio. ∆u and θu are the ultimate displacement and ultimate drift ratio, which are taken from the point on skeleton curve when the load drops to 85 % of the peak strength.
Fig. 5Hysteretic curves and skeleton curves (continued)
a) C1-X
b) C2-X
c) C3-X
d) C4-X
e) C5-X
f) C1-Y
g) C1-Z
Table 3Tested results in main stages
Speimen | Loading direction | Yiled | Peak | Ultimate | μ | |||||||
Fy (kN) | Average (kN) | Δy / mm | θy | Fp (kN) | Average (kN) | Δp / mm | θp | Δu / mm | θu | |||
C1-X | (+) | 252.2 | 258.9 | 12.37 | 1/81 | 306.6 | 316.1 | 26.68 | 1/40 | 34.16 | 1/30 | 2.72 |
(–) | –265.6 | –14.06 | –325.6 | –26.79 | –37.78 | |||||||
C2-X | (+) | 263.5 | 266.4 | 10.04 | 1/111 | 321.8 | 331.3 | 26.46 | 1/45 | 34.19 | 1/31 | 3.60 |
(–) | –269.4 | –9.20 | –340.8 | –21.17 | –35.09 | |||||||
C3-X | (+) | 258.3 | 262.3 | 9.56 | 1/93 | 318.9 | 328.8 | 26.25 | 1/41 | 34.20 | 1/30 | 3.12 |
(–) | –266.3 | –13.49 | –338.6 | –25.84 | –37.79 | |||||||
C4-X | (+) | 278.4 | 272.1 | 9.75 | 1/114 | 345.5 | 343.5 | 26.23 | 1/41 | 37.80 | 1/27 | 4.27 |
(–) | –265.9 | –9.01 | –341.5 | –26.14 | –42.27 | |||||||
C5-X | (+) | 286.4 | 282.5 | 10.30 | 1/106 | 356.9 | 357.4 | 25.41 | 1/42 | 36.84 | 1/28 | 3.76 |
(–) | –278.6 | –9.92 | –357.9 | –25.67 | –39.16 | |||||||
C1-Y | (+) | 121.5 | 132.3 | 10.14 | 1/82 | 153.9 | 164.2 | 21.52 | 1/45 | 27.91 | 1/35 | 2.34 |
(–) | –143.2 | –16.09 | –174.5 | –26.16 | –33.44 | |||||||
C1-Z | (+) | 193.6 | 193.9 | 11.37 | 1/93 | 235.5 | 236.4 | 25.94 | 1/45 | 30.64 | 1/33 | 2.82 |
(–) | –194.1 | –11.55 | –237.4 | –21.43 | –34.04 | |||||||
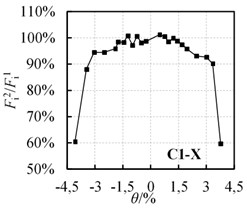
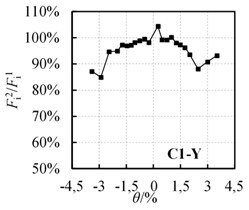
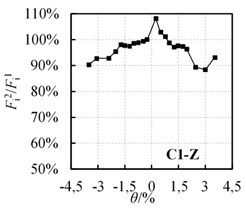
Fi1 and Fi2 are the maximum horizontal force of the first and second cycles, respectively. Fi2/Fi1 is defined as the strength degradation coefficient, which is used to investigate the loss of strength caused by cumulative damage in seismic tests. The Fi2/Fi1-θ curves of specimens C1-X, C1-Y and C1-Z are shown in Fig. 6.
From Table 3 and Fig. 6, it is confirmed that:
1) Strengthening methods have a certain effect on enhancing the strength. Compared with specimen C1-X, the yield load and peak load of specimen C2-X increased by 2.9 % and 4.8 %, specimen C3-X increased by 1.3 % and 4.0 %, specimen C4-X increased by 5.1 % and 8.7 %, and specimen C5-X increased by 9.1 % and 13.1 %.
2) The strength of the specimen is significantly influenced by the direction of the horizontal force. The yield load of specimen C1-X was 95.7 % and 33.5 % higher than that of specimens C1-Y and C1-Z respectively. Also, the peak load of specimen C1-X was 92.5 % and 33.7 % higher than specimens C1-Y and C1-Z. In the seismic design of the special-shaped CFST columns, the difference in seismic behavior in different directions should be taken into account.
3) For all specimens, yield load was about 0.8 times the peak load.
4) At the initiation of loading, strength degradation is small, but the degradation increases with further loading.
5) When the drift ratio is 2.5 %, the strength degradation coefficient is about 95 %, indicating that the specimens have an excellent capacity to resist cumulative damage.
Fig. 6‘Fi2/Fi1-θ’ relationship curves
a) C1-X
b) C1-Y
c) C1-Z
3.4. Ductility
Experimental values of horizontal displacement Δ, drift ratio θ and ductility coefficient μ at various loading points are shown in table 3. The following conclusions were obtained:
1) When the specimens reach the yield load, the drift ratio is between 1/114 and 1/81. When the specimens reach the peak load, the drift ratio is between 1/50 and 1/40. When the load is 85 % of peak load, the drift ratio is between 1/35 and 1/26, indicating that the specimens have a good elastic-plastic deformation ability.
2) When loading along the long axis, the average yield displacement in specimen C2-X decreases by 37.4 %, specimen C3-X decreases by 14.7 %, specimen C4-X decreases by 40.9 % and specimen C5-X decreases by 30.7 % when compared to specimen C1-X.
3) Maximum elastic-plastic displacement in specimen C2-X decreases by 3.8 %, specimen C3-X increases by 0.1 %, specimen C4-X increases by 10.2 % and specimen C5-X increases by 5.27 % when compared to specimen C1-X. The strengthened specimens have better elastic-plastic deformation ability.
4) When loading along the short axis and long axis with 45 %, the average yield displacement in specimen C1-Z decreases by 12.6 % when compared to specimen C1-X. The maximum elastic-plastic drift ratios of the specimens are approximately equal.
5) When loading along long axis, the ductility coefficient is between 2.72 and 4.27. When loading along the short axis and long axis with 45 %, the ductility coefficient is between 2.34 and 2.82. In comparison with specimen C1-X, the ductility coefficients of the strengthened specimens are greatly improved.
3.5. Energy dissipation capacity
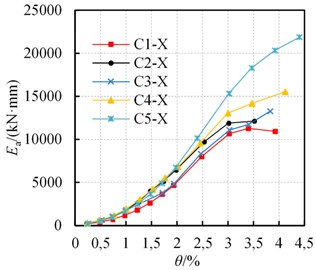
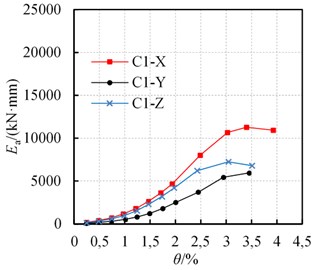
The average energy dissipation capacity is commonly adopted for evaluating the energy dissipation capacity of the columns. The average hysteretic energy dissipation Ea – drift ratio θ curves are shown in Fig. 7.
Based on Fig. 7, observations are as follows:
1) The energy dissipation of each specimen increases with increasing drift ratio, and the energy dissipation accelerates throughout the loading process. However, acceleration slows down when the specimens fracture.
2) Before a 2.5 % drift ratio, the energy dissipation of specimen C1-X is almost identical specimen C3-X, the specimens C2-X, C4-X and C5-X were almost identical. After a 2.5 % drift ratio, the rank of the energy dissipation is C5-X, C4-X, C2-X, C3-X and C1-X.
3) The energy dissipation of specimen C1-Z with 45° loading is between the specimens C1-X and C1-Y.
Fig. 7Ea-θ curves
a) C1, 2, 3, 4, 5-X
b) C1-X, Y, Z
3.6. Strain characteristics
In this section, the basic specimen C1-X was selected as an example to analysis strain characteristics.
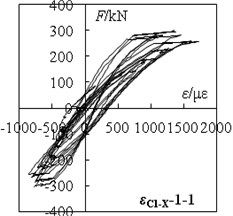
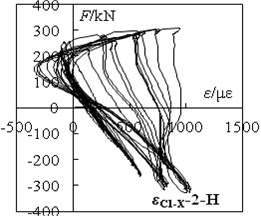
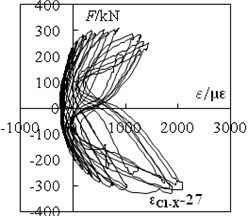
For the strain gauge located at the base of upper column, the “load F-strain ε” hysteretic curves are shown in Fig. 8. Negative values represent shortening and positive values represent extension.
Fig. 8‘F-ε’ hysteretic loops of specimen C1-X
a) C1-X:1-1
b) C1-X:2-H
c) C1-X:27
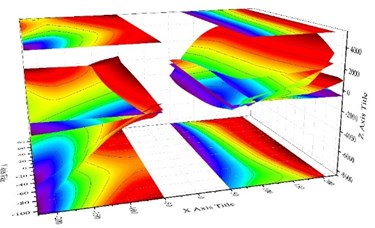
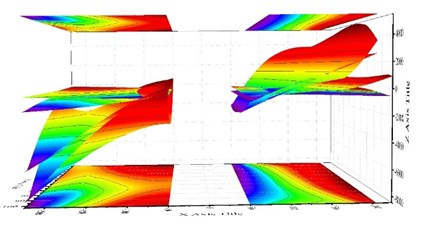
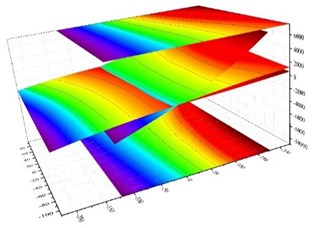
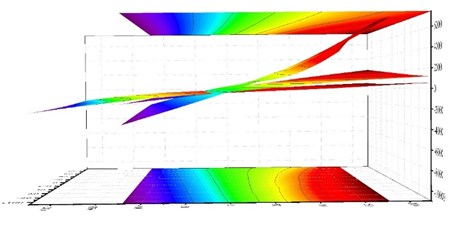
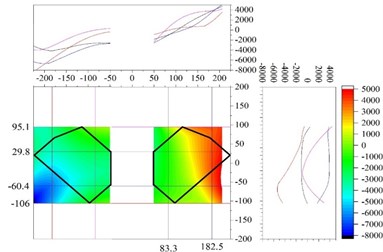
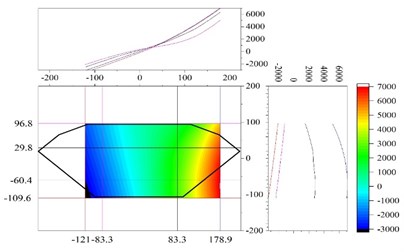
According to the stress-strain curves, choosing the strain corresponding to the peak point of the first cycle per load stage, selecting the section centroid as the origin, taking the load direction as the X-axis, symmetry axis as the Y-axis, and strain value as the Z-axis. According to the coordinates of each gauging point a fitting surface can be calculated using the software ORIGIN. Using the best-fit surface, the strain distribution on sections under different load stages can be calculated. In data processing, the strain caused by bulge deformation is anamorphic strain. It's not credible to describe the strain distribution in cross section. The section strain corresponding to the different stage of the loading are shown in Fig. 9 and Fig. 10.
From Fig. 9 and Fig. 10, the following observations can be obtained.
The strain fitting curve of specimen C1-X for the upper column root section (Fig. 9) has a low flatness before reaching the peak load (including the peak load). The fitting curve for lower column root section (Fig. 10) is basically a flat (including the peak load), meanwhile strain contour lines roughly parallel and each contour interval is basically equivalent.
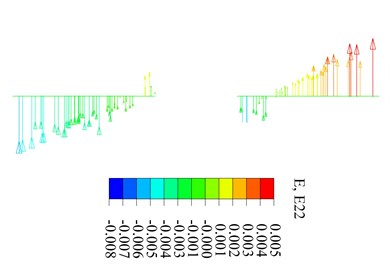
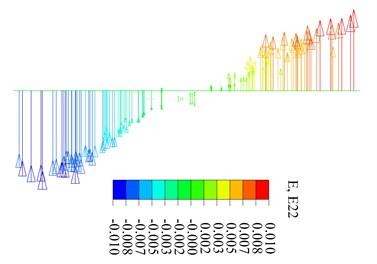
In this diagram, the ground projection is the projection of the strain distribution in the X-Y plane at the peak load, and the top projection is the strain distribution in the X-Y plane when the load reaches the yield point. The fitting plane is incomplete because of partial strain distortion under peak load. When reaching the 7th level load, the section strain projection in a plane of different locations is shown in Fig. 11. Fig. 11(a) and Fig. 11(b) shows the test results, while Fig. 11(c) and Fig. 11(d) shows simulated results.
Fig. 9Bottom cross-section of upper columns strain distribution under different load
a) Elevation, plus side loading
b) Plan, plus side loading
Fig. 10Bottom cross-section of lower column strain distribution under different load
a) Three dimension (plus side)
b) Front view (plus side)
From Fig. 11, it is confirmed that the simulated results of strain distribution matched the test results well. Also, it can be known that the section strain of the upper column is in a straight line distributed along the line of loading for a single column under peak load. For a double column section, the degree of line conformance is low. Peak load calculated according to the single column cross section is basically consistent with the peak load of a flat section. However, according to a double column integral section, there is a large error in assuming a flat section. When the lower column reaches peak load, the section strain is distributed along the loading line and perpendicular to the loading direction. The section remains plane before reaching peak pressure (including the peak load), the flat section assumption is generally true.
4. Finite element analysis
The finite element analysis software ABAQUS is adopted to calculate and analyze the seismic performance of proposed CFST columns. Computational results are compared with the experimental results.
4.1. Constitutive relations
4.1.1. Concrete
A uniaxial compressive stress-strain relationship of concrete confined by steel tube was adopted. The constitutive relation is applicable to FEM analysis, which is suggested by Liu Wei and Yao Guohuang [27, 28].
In the FEM analysis, there is no interactive relationship between the concrete and the stiffening rib or the diaphragm. In order to reduce this influence, the theoretical calculations were carried out to enhance the uniaxial compression strength of the concrete. In the theoretical calculations, the influence of stiffening rib and the diaphragm to the division of concrete effective confined region and ineffective confined region was considered. And the division was related to the strength of core concrete. By the method in the reference [29], the theoretical ultimate bearing capacity of multi-cavities CFT columns can be known. Then minus the bearing capacity of steel part, the bearing capacity of concrete part can be known. By dividing concrete cross-section area, the strength of core concrete can be known theoretically considering influence of stiffening rib and diaphragm or not. As a result, the difference value reflected the contribution of stiffening rib and diaphragm, and the uniaxial compression strength of the core concrete was enhanced.
Fig. 11Bottom cross-section of upper columns strain distribution at peak load
a) Upper column (TEST)
b) Lower column (TEST)
c) Upper column (FEM)
d) Lower column (FEM)
Also, the influence of stiffening rib and the diaphragm to the effective confinement coefficient ξe was considered by the method in the reference [25]
With enhanced core concrete strength and modified effective confinement coefficient, the constitutive relative equations are as follows:
where fc is the cylinder compressive strength of concrete and corresponding conversion is made due to prismatic strength in material tests, and enhanced value due to stiffening rib and diaphragm is considered; εc0is the peak strain of plain concrete; εccis the peak strain of concrete confined by steel tube; ξe is the effective confinement coefficient, and enhanced value due to stiffening rib and diaphragm is considered; η and β0are parameters at the descent stage of uniaxial compression stress-strain curve of concrete.
Fig. 12Concrete tensile softening model
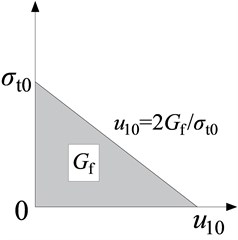
Applying energy failure criterion methods to define tensile softening behavior of concrete have good convergence characteristics [30]. Stress-strain curves of concrete in tension adopt the finite element model shown in Fig. 12 to simulate the tensile softening behavior. Gf and σt0 represent fracture energy of concrete and breakdown stress, respectively. The values are taken from the literature [31]. The recommended cylinder compression strength is 20 MPa, Gf= 40 N/m, and when cylinder compression strength is equal or greater than 40 MPa, Gf= 120 N/m.
4.1.2. Steel stress-strain curve
For ordinary low-carbon steel and low-alloy steel used in construction, the stress-strain curve can be divided into five stages: elastic, elastic-plastic, the first plastic flow, strengthen and the second plastic flow, as shown in Fig. 13. In which, the dot line represents the actual stress-strain curve and the solid lines represents the simplified stress-strain curve. The equation for the simplified stress-strain curve is as follows:
where:
B=2Aεe1,C=0.8fy+Aεe2-Bεe
4.1.3. Element selection and mesh generation
Steel: The four nodes shell element S4R or three nodes shell element S3R are adopted. In order to achieve the necessary computing precision, the Simpson integral of nine points is used along the thickness of the shell unit. The unit S4R, S3R is used for the shear deformation along the thickness. ABAQUS selects thick shell theory or thin shell theory automatically based on shell thickness.
Concrete: An eight node reduced integration 3D solid element (C3D8R) is adopted.
ABAQUS provides a variety of grid partitioning techniques and algorithms. Due to the irregular shape of the steel tube and concrete, the technique of free grid partitioning is used. The grid partition results from the steel tube and concrete are shown in Fig. 14.
Fig. 13Simplified stress- strain curve of steel
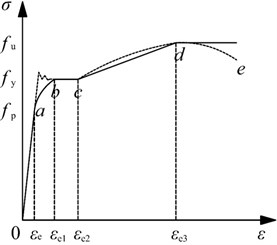
Fig. 14Meshed results
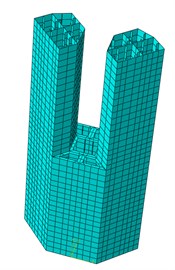
a) Steel tube
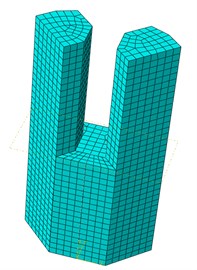
b) Concrete
4.1.4. Interaction
In order to simplify the calculation, tie binding constraints between the concrete and its surrounding cavity plate were adopted for the concrete in the middle of the lower column near the neutral axis. The concrete within the column used the contact constraint simulation, while hard touching is selected for the normal direction of the interface. The coulomb friction model is selected for the tangential direction of the interface. The tangential movement is zero until the surface stress reaches critical shear stress. The critical shear stress depends on the normal contact pressure, Eq. (9).
where, μ is friction coefficient and p is contact pressure. When the shear stress reaches μp, the contact surface begins to slide. Baltay and Gjelsvik suggest that the friction coefficient value of the contact surface between the steel and concrete is 0.2-0.6. [32] This paper chooses a larger value of 0.6 to consider the existence of the diaphragm.
4.1.5. Boundary conditions and loading
Boundary conditions for the bottom of the foundation are fixed. The vertical axial load is applied to the reference point. Then the cyclic horizontal load is applied to the reference point coupled to the side of the loading end.
4.2. FEM results
4.2.1. F-θ curve
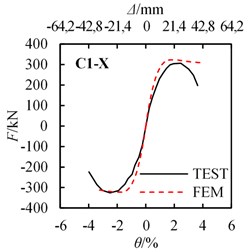
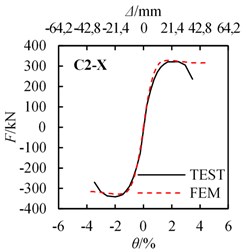
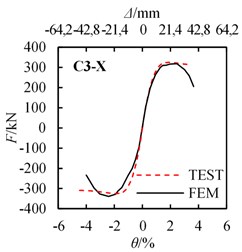
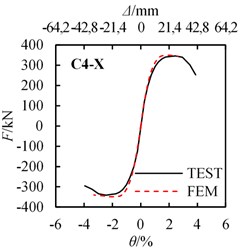
According FEM methods described above, the calculated Horizontal force F and drift ratio θ curves are obtained. The comparison between the experiment and calculated F-θ curves are shown in Fig. 15. The yield strength and peak strength of the experiment and FEM results are listed in Table. 4.
Fig. 15Load-displacement (draft angle) curves comparison between FEM results and test results
a) C1-X
b) C2-X
c) C3-X
d) C4-X
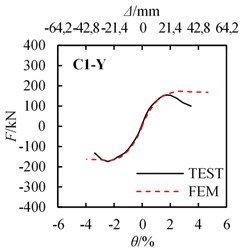
e) C1-Y
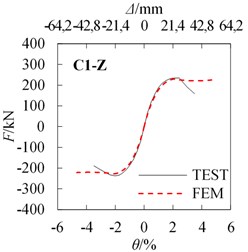
f) C1-Z
Table 4Quantitative comparison between test and FEM results
Specimen | Yield strength | Peak strength | ||||||
Test | FEM | FEM/Test | Relative errors (%) | Test | FEM | FEM/Test | Relative errors (%) | |
C1-X | 258.9 | 272.1 | 1.051 | 5.1 | 316.1 | 320.2 | 1.013 | 1.3 |
C2-X | 266.4 | 271.2 | 1.018 | 1.8 | 331.3 | 321.2 | 0.970 | –3.0 |
C3-X | 262.3 | 275.5 | 1.050 | 5.0 | 328.8 | 319.7 | 0.972 | –2.8 |
C4-X | 272.1 | 269.4 | 0.990 | –1.0 | 343.5 | 352.4 | 1.026 | 2.6 |
C5-X | 282.5 | 290.5 | 1.028 | 2.8 | 357.4 | 368.4 | 1.031 | 3.1 |
C1-Y | 132.3 | 136.4 | 1.031 | 3.1 | 164.2 | 179.4 | 1.093 | 9.3 |
C1-Z | 193.9 | 200.1 | 1.032 | 3.2 | 236.4 | 230.1 | 0.973 | –2.7 |
As shown in Fig. 15 and Table 4, experimental and calculated F-θ curves are in acceptable agreement. The average values (A.V.) of the ratio of FEM value to Test value are 1.026 and 1.005 for yield strength and peak strength relatively, and the coefficient of variation (C.V.) of those are 2.04 % and 3.28 % relatively, which shows that the simulated results match the test results considerably. Results confirm the FEM methods used in the analysis are suitable. Note that for the FEM analysis, the strength has almost no degradation after the peak load, however, the strength decreases gradually after the peak load. The error between the test and FEM analysis becomes obvious after the peak load. This is due to the severe damage occurred for the steel and concrete when reaching the peak load, but in the FEM analysis, this damage is difficult to simulate.
4.2.2. Finite element contour results
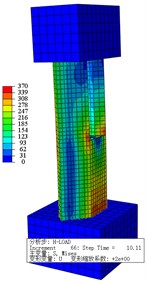
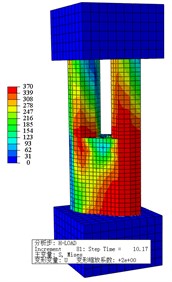
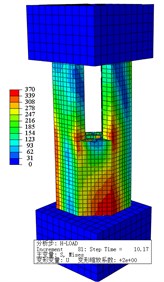
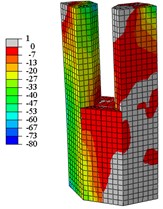
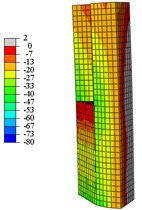
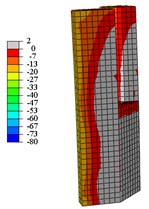
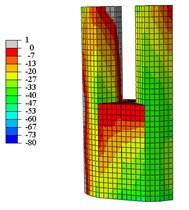
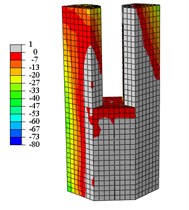
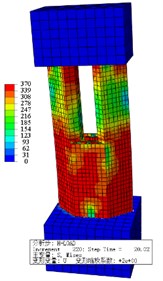
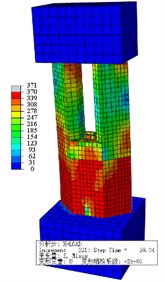
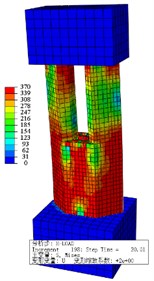
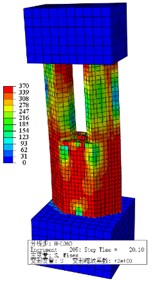
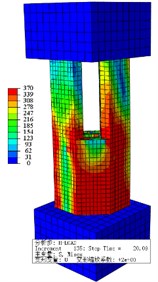
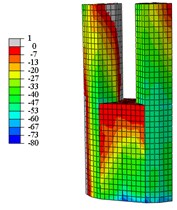
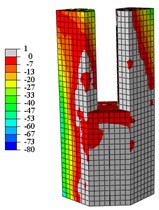
The displacement corresponding to the experimental yield load is between 8.83 mm and 14.76 mm. For comparison, taking a displacement of Δ= 10 mm as the yielding, a Mises stress contour plot for the steel tube is shown in Fig. 16 and longitudinal stress contour plot for concrete is shown in Fig. 17. The displacement corresponding to the experimental peak load is between 18.71 mm and 26.68 mm.
Fig. 16Steel tube Mises stress nephogram at yield load
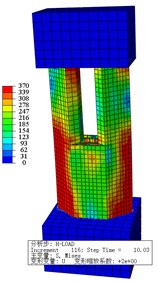
a) C1-X
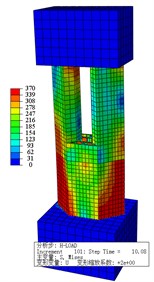
b) C2-X
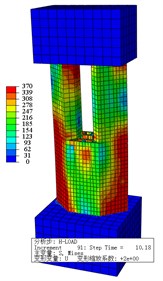
c) C3-X
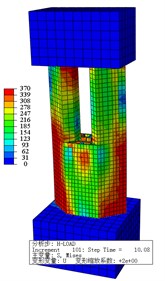
d) C4-X
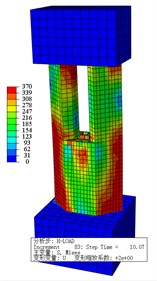
e) C5-X
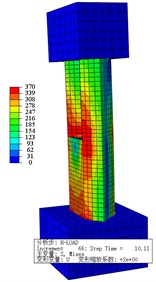
f) C1-Y compression
g) C1-Y tension
h) C1-Z compression
i) C1-Z tension
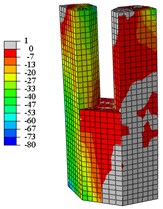
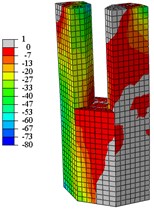
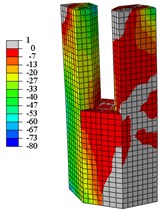
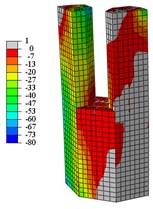
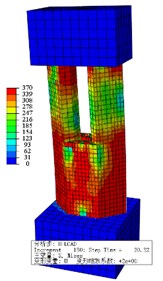
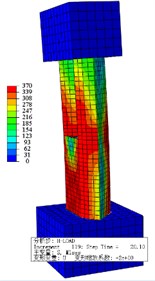
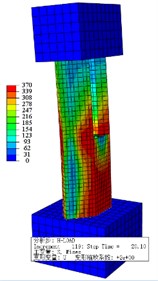
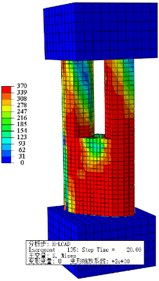
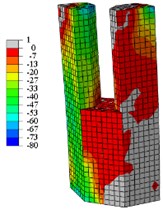
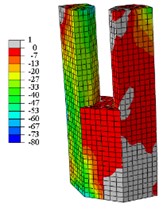
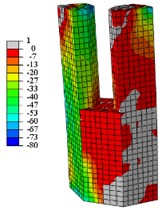
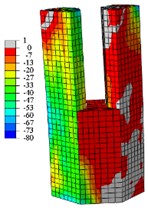
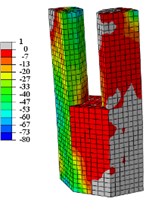
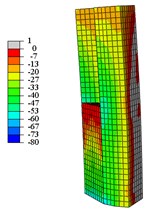
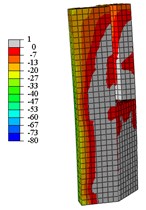
For comparison, taking a displacement of Δ= 20 mm as the peak, a Mises stress contour plot for a steel tube is shown in Fig. 18 and longitudinal stress contour plot for concrete is shown in Fig. 19. Each diagram shows the state of the positive loading. For specimens loading along the long axis, only a one-sided contour plot is given. For the specimens loading along the short axis and loading along the long axis with 45°, the contour plot for the compression side and the contour plot for the tension side are both given.
Fig. 17Concrete vertical stress nephogram at yield load
a) C1-X
b) C2-X
c) C3-X
d) C4-X
e) C5-X
f) C1-Y compression
g) C1-Y tension
h) C1-Z compression
i) C1-Z tension
Fig. 18Steel tube Mises stress nephogram at peak load
a) C1-X
b) C2-X
c) C3-X
d) C4-X
e) C5-X
f) C1-Y compression
g) C1-Y tension
h) C1-Z compression
i) C1-Z tension
From Fig. 16 to Fig. 19:
When the specimens reach the yield load, (1) Compared with specimen C1-X, the yielding area of specimen C2-X is considerably reduced, however, the yielding area of other specimens is slightly reduced. (2) For the specimen C2-X, there is a significant stress mutation on the adjacent of the reinforced layer with the lower column. (3) The yielding area of the steel tube is mainly concentrated in the whole loading direction of the lower column and the upper column root. The area where severe compression damage occurs to concrete is distributed similar to the yield area distribution of steel tube. The concrete tension area is mainly distributed on the tension side of the lower column and the lower part of the upper column. This is consistent with the experimental results showing that both the base of upper and lower column shows bulge deformation.
When the specimens reach peak load, (1) The yielding area of the steel tube develops downward, almost the whole lower column yields. For specimen C2-X, there is obvious yield under the reinforcement layer, and yield above the reinforcement is not visible. (2) With the damage area of the steel tube developing downward, the area of concrete compression damage also developed downward. (3) The yield damage of the specimens loaded along the long axis is more severely than specimens loaded along the short axis. This explains the following experimental phenomenon: Only a slight bulge deformation is visible on the upper column root when the specimens loaded along the long axis, and the bulge deformation of the lower column increases constantly. Finally, under the effect of a reciprocating load and cumulative damage, the steel plate tears and damages the edge of weld affected area. For the specimens loaded along the short axis, the upper column shows a relatively large bulge deformation, and eventually the steel plates are torn apart.
Fig. 19Concrete vertical stress nephogram at peak load
a) C1-X
b) C2-X
c) C3-X
d) C4-X
e) C5-X
f) C1-Y compression
g) C1-Y tension
h) C1-Z compression
i) C1-Z tension
5. Conclusions
In this study, a total of seven special-shaped bifurcated CFT columns are fabricated and tested under cyclic load. The main findings are as follows:
1) The position of the welding seam is the main influencing factor on the failure mode. The damage mainly occurs at the upper diaphragm of the lower column, and shows a characteristic of tear crack of steel plate near hear affected zone of welding seam. So welding seam should be arranged at the position where the stress is relatively small to the greatest extent.
2) The hysteretic curves of all the specimens are plump, and no obvious pinch phenomenon occurred during the test, which shows good deformability and energy dissipation capacity. The specimen C4-X with the inserted angle steel and specimen C5-X circular steel tube possess the best comprehensive seismic behavior.
3) For each loading stage, the strength of second cycle decrease less than 5 % compared with the first cycle when the drift ratio is under 1/50 (2 %) and the strength degradation is slight.
4) The loading direction has a significant influence on the seismic behavior of the specimens. Compares with the short axis loading specimen C1-Y, the strength of the long axis specimen C1-X and 45° axis C1-Z increase by 92.5 % and 44.0 %, respectively, the differences in loading direction should be taken into consideration in the seismic design.
5) The FEM results show a satisfactory agreement with experimental results. It can be concluded that the concrete constitutive relationship and modelling method proposed in this paper is suitable for the simulation of special-shaped bifurcated CFT columns with multiple cavities.
The present paper revealed the advantages and behaviors of the developed bifurcated concrete filled steel tube columns with a multi-cavity structure by cyclic tests. However, more experimental and analytical studies are needed to develop the design provisions and theoretical models for such columns.
References
-
Wang Wenjing, Ma Hua, Li Zhenbao, TangZhenyun Size effect in circular concrete-filled steel tubes with different diameter-to-thickness ratios under axial compression. Engineering Structures, Vol. 151, 2017, p. 554-567.
-
Dong C. X., Kwan A. K. H., Ho J. C. M. Effects of external confinement on structural performance of concrete-filled steel tubes. Journal of Constructional Steel Research, Vol. 132, 2017, p. 72-82.
-
Talha Ekmekyapar Experimental performance of concrete filled welded steel tube columns. Journal of Constructional Steel Research, Vol. 117, 2016, p. 175-184.
-
Zhu Aizhu, Zhang Xiaowu, Zhu Hongping, Zhu Jihua, LuYong Experimental study of concrete filled cold-formed steel tubular stub columns. Journal of Constructional Steel Research, Vol. 134, 2017, p. 17-27.
-
Dundu M. Compressive strength of circular concrete filled steel tube columns. Thin-Walled Structures, Vol. 56, 2012, p. 62-70.
-
Abed F., Alhamaydeh M., Abdalla S. Experimental and numerical investigations of the compressive behavior of concrete filled steel tubes (CFSTs). Journal of Constructional Steel Research, Vol. 80, 2013, p. 429-439.
-
ACI 318-11 Building Code Requirement for Structural Concrete and Commentary. Farmington Hills, American Concrete Institute, 2011.
-
EN 1994-1-1: 2004 Eurocode 4: Design of Composite Steel and Concrete Structures: Part 1-1: General Rules for Buildings. Brussels, European Committee for Standardization, 2004.
-
AISC-LRFD-1999 Load and resistance factor design specification. Chicago, American Institute of Steel Construction, 1999.
-
AIJ Standard for Structure Calculation of Steel Reinforced Concrete Structures. Architectural Institute of Japan, Tokyo, 2001.
-
CECS28-2012, Technical Regulations of Steel Tube Concrete Structure. Beijing, China Planning Press, 2012.
-
Shen Z. Y., Lei M., Li Y. Q. Experimental study on seismic behavior of concrete-filled L-shaped steel tube columns. Advances in Structural Engineering, Vol. 16, Issue 7, 2013, p. 1235-1247.
-
Zuo Z. L., Cai J., Yang C. Axial load behavior of L-shaped CFST stub columns with binding bars. Engineering Structures, Vol. 37, 2012, p. 88-98.
-
Xu W., Han L. H., Li W. Performance of hexagonal CFST members under axial compression and bending. Journal of Constructional Steel Research, Vol. 123, 2016, p. 162-175.
-
Xu W., Han L. H., Li W. Seismic performance of concrete-encased column base for hexagonal concrete-filled steel tube: experimental study. Journal of Constructional Steel Research, Vol. 121, 2016, p. 352-369.
-
Tu Y. Q., Shen Y. F., Li P. Behaviour of multi-cell composite T-shaped concrete-filled steel tubular columns under axial compression. Thin-walled Structures, Vol. 85, 2014, p. 57-70.
-
Sinha S. N. Design of cross section of column. The Indian Concrete Journal, Vol. 153, 1996.
-
Dundar C., Sahin B. Arbitrarily shaped reinforced concrete members subject to biaxial bending and axial load. Computers and Structures, Vol. 49, Issues 4-17, 1993, p. 643-662.
-
Wang Wei, Yan Peng Experimental study on mechanical behavior of concrete filled steel tubular intersecting connections. Journal of Building Structures, Vol. 34, 2013, p. 123-127.
-
Li Zhengliang, Liu Hongjun, Zhao Shixing Research on seismic behavior of concrete-filled square steel tube bifurcate column-to-steel beam connections. Journal of Building Structures, Vol. 30, Issue 1, 2009, p. 87-94, (in Chinese).
-
Cui Jiachun, Zhou Jian, Yang Lianping, Wang Hongjun, Li Chengming Analysis and research on stability of Y-shaped columns. Building Structures, Vol. 42, Issue 5, 2012, p. 115-118.
-
Yang Guang, Cao Wanlin, Dong Hongying, Yang Weibiao, Tian Shichuan Compressive behavior of specially-shaped multi-cell mega-bifurcated concrete filled steel tubular columns. Journal of Building Structures, Vol. 37, Issue 5, 2016, p. 57-68.
-
Cui K., Yang W., Gou H. Experimental research and finite element analysis on the dynamic characteristics of concrete steel bridges with multi-cracks. Journal of Vibroengineering, Vol. 19, Issue 6, 2017, p. 4198-4209.
-
Cui K., Zhao T. T. Unsaturated dynamic constitutive model under cyclic loading. Cluster Computing, Vol. 20, Issue 4, 2017, p. 2869-2879.
-
Wang Zhi Bin, Tao Zhong, Han Lin Hai, Uy Brian, Lam Dennis, Kang Won Hee Strength, stiffness and ductility of concrete-filled steel columns under axial compression. Engineering Structures, Vol. 135, 2017, p. 209-221.
-
Choi In Rak, Chung Kyung Soo, Kim Chang Soo Experimental study on rectangular CFT columns with different steel grades and thicknesses. Journal of Constructional Steel Research, Vol. 130, 2017, p. 109-119.
-
Liu W. The Working Mechanism Study of Concrete Filled Steel Tube under the Partial Compression. Fuzhou, Fuzhou University, 2005.
-
Yao G. H. The Working Mechanism Study of Concrete Filled Steel Tube under the Complex State of Stresses. Fuzhou, Fuzhou University, 2006.
-
Wu Haipng, Cao Wanlin, Qiao Qiyun, Dong Hongying Uniaxial compressive constitutive relationship of concrete confined by special-shaped steel tube coupled with multiple cavities. Materials, Vol. 9, Issues2, 2016.
-
Hillerborg A., Modéer M., Petersson P. E. Analysis of crack formation and crack growth in concrete by means of fracture mechanics and finite elements. Cement and Concrete Research, Vol. 6, Issue 6, 1976, p. 773-781.
-
Hibbit Karlson Abaqus Benchmarks Manual; Abaqus Analysis User’s Manual. Dassault Systèmes Simulia Corp, Providence, RI, USA, 2000.
-
Baltay P., Gjelsvik A. Coefficient of friction for steel on concrete at high normal stress. Journal of Materials in Civil Engineering, Vol. 2, Issue 1, 1990, p. 46-49.
Cited by
About this article
The research described in this paper was financially supported by the National Natural Science Foundation of China under Grant No. 51408017.

