Abstract
Localized faults in rolling bearing tend to result in periodic shocks and thus arouse periodic responses in the vibration signal. In this paper, a novel fault diagnosis method based on maximal spectral kurtosis tunable Q-factor wavelet transformation (TQWT) and group sparsity total variation denoising (GS-TVD) is proposed to address the issue of bearing incipient failure. Firstly, the range of Q-factor was pre-selected according to the spectral distribution of impulse component, and bearing vibration signal was transformed by the TQWT method. Then, the spectral kurtosis of each scale transform coefficients was calculated, and the optimal Q-factor and decomposition scale can be selected according to the kurtosis maximum principle. In order to remove the interference components and high-frequency noise from the reconstructed vibration signal generated by inverse TQWT, the GS-TVD approach is employed, thus the cyclic periodicity characteristic and transient impulses can be detected obviously. The two cases experimental results indicate that the proposed technique is more effective and applicable for bearing incipient fault diagnosis compared with traditional method.
1. Introduction
Rolling element bearings have been widely applied in rotating machines of the modern industry. During operation, some common and unknown failures such as pitting, spalling and localized wear are inevitable, and these bearing faults seriously affect the safety of machinery. Therefore, bearing fault detection and diagnosis have attracted substantial attention in recent years [1-3].
Vibration signal analysis is most widely used to diagnose rolling bearing faults. When a bearing operates with localized defect, it would excite the resonance frequency modulated by characteristic frequencies caused by bearing defects. This would cause the measured vibration signal with the nonlinear and non-stationary characteristics [4]. However, at the early stage, the fault symptoms generated by a localized damage has low amplitude, which are often immersed in heavy background noises and rotation frequencies. Common used indexes such as root mean square (RMS), peak-to-peak value and Kurtosis value, are effective to describe the degradation process of a bearing. However, the bearing fault type cannot be identified easily using these indexes and the certainty of the fault occurrence requires to be double assured.
In the past years, many vibration signal processing techniques, such as wavelet packet transform [5], ensemble empirical mode decomposition (EEMD) [6], local mean decomposition (LMD) algorithm [7] and Variational mode decomposition (VMD) algorithm [8], higher order energy operator fusion [9], Quaternion singular spectrum [10], blind source separation method [11], low-rank matrix approximations [12], sparse representation [13, 14] and deep learning [15], etc., have been developed to extract the fault features from measured signals for bearing fault diagnosis. Currently, the turntable Q-factor wavelet transform (TQWT) was original proposed by Selesnick, and the advantage of TQWT is that the Q-factor is easily and continuously adjustable [16, 17]. When a fault occurs on bearings, the measured vibration signals contain both the fault transient impact component and sustained oscillatory component. Therefore, the TQWT has the high Q-factor and low Q-factor simultaneously, which is very suitable to separate the fault related components from the sustained oscillatory components. Ref. [18] recently proposed ensemble empirical mode decomposition (EEMD) and TQWT method to extract the weak fault features of rolling bearing in an accelerated bearing life test. In this method, the EEMD is applied to decompose the vibration signals into a series of IMFs and then the TQWT is employed to separate the main IMF into high Q-factor component and low Q-factor component to diagnose the early fault. Furthermore, an improvement works has been aroused in applying intrinsic characteristic-scale decomposition (ICD) and TQWT for fault diagnosis of rolling bearings [19]. However, there are two main shortcomings in the above methods:
1) The EEMD and ICD methods are time consuming in signal decomposition, and also the self-adaptive, mode mixing phenomenon and end effect problems cannot be eradicated.
2) Although the TQWT is an interesting attempt to extract the fault characteristics, the selection of the proper Q-factors is still a problem. As the filtered signal processed by Q-factors is far away from its theoretical central frequency, and the bandwidth is often heavily polluted, it is difficult to represent the factual features clearly.
To address the above issues, in this paper, a novel fault diagnosis method based on group sparsity total variation denoising (GS-TVD) and maximal spectral kurtosis TQWT is proposed. The optimal Q-factors and decomposition level can be found for fault feature extraction by the maximal spectral kurtosis TQWT, which match the fault periodical impulses well. Unfortunately, it should be noted that some interference components and high-frequency noise may still be present in the optimal Q-factors and decomposition level area. To overcome this problem, unlike the traditional signal decomposition method, the group sparsity total variation denoising (GS-TVD) approach is developed for noise reduction, which can preserve sharp edges in the underlying signal so that the transient impulse will be preserved for feature extraction. Finally, results of incipient feature extraction indicate that the period of transients can be detected more accurately and effectively in the case that previous approach failed, which can significantly improve the performance of proposed method for extracting transient impulses from heavy noisy vibration signal.
The rest of this paper is organized as follows. Section 2 mainly introduces the maximal spectral kurtosis TQWT method and group sparsity total variation denoising method in detail. The flow chart of the proposed model for bearing incipient fault diagnosis is presented in Section 3. Section 4 investigates the effectiveness of the proposed method compared with the other method in feature extraction by using two bearing fault cases. Conclusions are drawn in Section 5.
2. Methodology development
2.1. Maximal spectral kurtosis tunable Q-factor wavelet transform
The resonance characteristics of oscillatory signal can be depicted by quality factor Q, Q=fc/Bw, where fc represents center frequency of signal and Bw is bandwidth. The tunable Q-factor wavelet transform (TQWT) was proposed by Selesnick as a flexible discrete wavelet transform for oscillatory signal processing [16]. The TQWT method includes three easily changeable parameters, i.e. quality factor Q, total over-sampling rate r and number of levels of decomposition j.
Fig. 1 illustrates the wavelet time domain waveform and frequency response curves with different Q-factors (e.g., j= 2, Q= 1, 2, 3, 4, 5, 6). Fig. 2 illustrates the wavelet waveform and frequency response curves with fixed Q-factors and different j scales (e.g., Q= 2.5, j= 1, 2, 3, 4, 5, 6). From Fig. 1 and Fig. 2, it can be concluded that the quality factor Q controls the oscillatory behavior and waveform shape of wavelet waveform, and the decomposition level j controls the expansion extent and bandpass location of wavelet waveform.
Fig. 1Wavelet waveform and frequency response curves with different Q-factors (e.g., j= 2, Q= 1, 2, 3, 4, 5, 6)
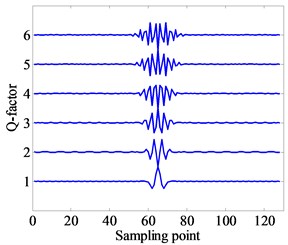
a) Wavelet waveform
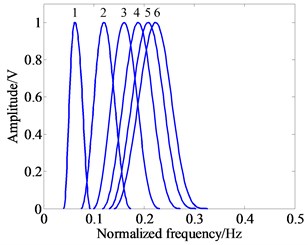
b) Frequency response curves
Fig. 2Wavelet waveform and frequency response curves with same Q-factors and different j scales (e.g., Q= 2.5, j= 1, 2, 3, 4, 5, 6)
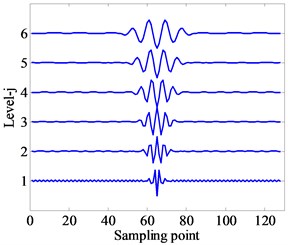
a) Wavelet waveform
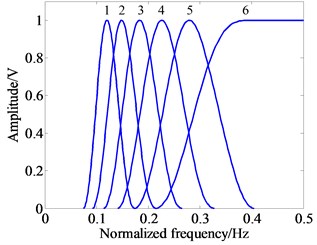
b) Frequency response curves
For each level of TQWT decomposition, the signal s(n) with sampling frequency fs can be decomposed into low-pass and high-pass sub-band signals with sampling frequencies αfs and βfs, respectively, the parameters α and β are scaling values. Moreover, the low-pass filter F0(ω) and low-pass scaling LPSα are used to obtain low-pass sub-band. Similarly, the high-pass sub-band can be generated by high-pass filter F1(ω) and high-pass scaling HPSα accordingly. The TQWT approach uses following given low-pass and high pass filters:
where θ(ω) is the frequency response of the Daubechies filter which has two vanishing moments. The θ(ω) can be defined as follows:
The Q-factor Q and parameters r can be formulated via filter bank parameters α and β as follows [16]:
where fc represents center frequency of signal and Bw is bandwidth of sub-band j. For more details about decomposition and reconstructed operations can be found from Selesnick [16].
For maximal spectral kurtosis TQWT method, it applies the principle of maximum kurtosis, the kurtosis of each scale wavelet coefficient can be calculated once the original vibration signals are decomposed by TWQT method, then the calculated Kurtosis value can be used for selecting the optimal frequency band, finally, the corresponding reconstructed signal is obtained by inverse TQWT method.
2.2. Group sparsity total variation denoising
Total variation denoising (TVD) assumes that the noisy signal y is of the form [20-22]:
where x is unknown signal and w white Gaussian noise. The unknown signal x can be obtained by solving the following optimization problem:
The regularization parameter λ> 0 controls how much smoothing is performed, and matrix D is first-order difference matrix, i.e.:
Note that v=Dx and penalty function ϕ(v) can be defined by:
Here, the parameter k represents the group size.
If k= 1, the penalty function ϕ(v)=‖ and Eq. (6) is the standard 1-D TVD problem. If 1, the penalty function is a convex measure of group sparsity. In this paper, we discuss group-sparse total variation denoising (GS-TVD) method.
Definition: A -point group can be denoted by the vector :
Thus, the penalty function can be modified and written by:
To calculate the optimization of , the optimization of penalty function is calculated firstly. Not that for all and 0 with equality when , we have:
The Eq. (9) is used for each group, thus the optimization of is presented as follows:
with , . Note that is quadratic equation on . The Eq. (10) can be written as:
where does not depend on the value of , and is a diagonal matrix, i.e., . After manipulation, we have:
Therefore, by using Eq. (11), the optimization of can be written as:
i.e., , .
In order to minimize the function , the majorization-minimization (MM) algorithm [23] defines an iterative algorithm via:
where is iteration exponent. The iteration is initialized with . Thus the Eq. (14) is written as:
Solving the above equation, we have:
Note that the problem with update Eq. (16) is that as the iterations progress, some values of will generally go to zero and becomes sparse, and therefore some entries of in Eq. (16) will go to infinity, leading the result is not accurate. We use the matrix inverse lemma from Ref. [24] to address this issue. Generally, the matrix inverse lemma has several forms, a common form is:
Thus, the in Eq. (16) can be written as:
Finally, using Eq. (18), the update Eq. (16) can be written as:
Therefore, the group-sparse total variation denoising (GS-TVD) problem can be solved by the iterative algorithm in Eq. (19).
In order to investigate and compare the denoising performance of GS-TVD and general TVD method, Fig. 3 illustrates group-sparse TV denoising on a blocks signal. The test block signal and its corrupted signal are provided in Fig. 3(a). Fig. 3(b) and (c) respectively illustrate the denoising performance of GS-TVD and general TVD method. Moreover, denoising errors are shown in Fig. 3(d). By comparison, the simulation results indicate that the significant improvement in denosing is obtained with GS-TVD approach compared to the TVD method. Here, the group size was set to 2, the regularlization parameter is 2, and the number of iteration is 20.
Fig. 3Comparison of simulation results between GS-TVD compared to the TVD method
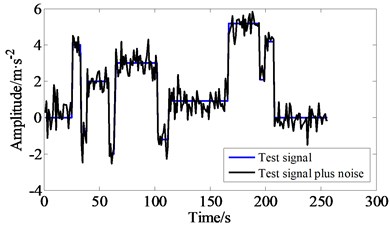
a) The test signal and noisy test signal
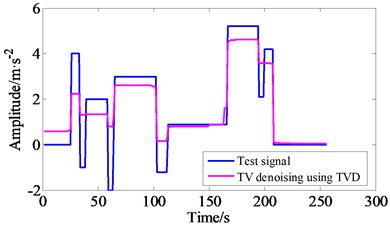
b) The test signal and denoising signal using TVD method
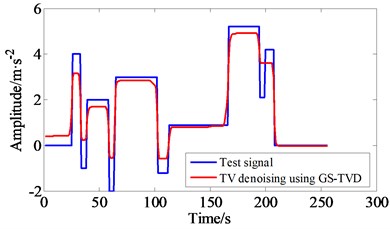
c) The test signal and denoising signal using GS-TVD method
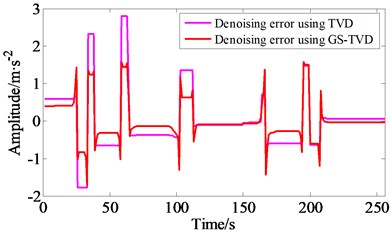
d) Denoising error using TVD and GS-TVD method
3. Feature extraction of bearing fault using maximal spectral kurtosis TQWT and GS-TVD approach
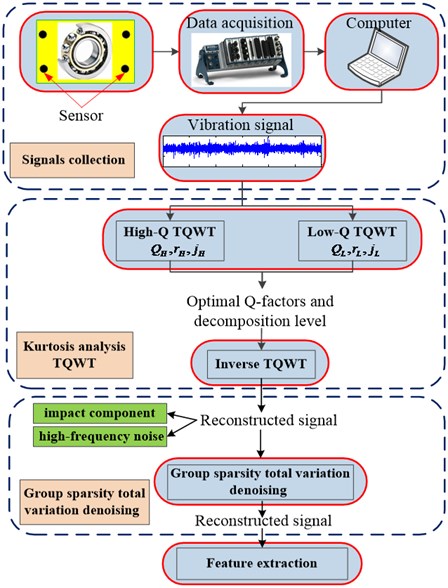
In this paper, a new incipient fault feature extraction technique by using maximal spectral kurtosis TQWT and group sparsity total variation denoising is proposed to extract fault frequencies from its measured signal. The procedures of fault feature extraction are divided into six steps:
1) Preselect the scope of quality factor- according to the spectral distribution of impulse component, and the bearing vibration signals are decomposed by TWQT within this scope.
2) Calculate the kurtosis of each scale wavelet coefficient obtained in step (1) and select the local maximum area according to its maximum kurtosis value. Keep the scale coefficient of the maximum area unchanged, and the other scale coefficients are set to 0.
3) Apply the inverse TQWT method to the scale coefficient of the maximum area and the corresponding reconstructed signal is obtained.
4) Determine the appropriate group size, and utilize the group sparsity total variation denoising method to reduce noises in the reconstructed signal, and the corresponding filtered signal is obtained.
5) Calculate envelope spectrum of the filtered signal.
6) Determine fault types by contrasting envelope spectral peak and the theoretical fault character frequency.
The flow chart of the proposed fault feature extraction technique is illustrated in Fig. 4.
Fig. 4Flow chart of the proposed model for bearing incipient fault diagnosis
4. Experimental evaluation
4.1. Case 1 – experimental setup
The bearing fault vibration signals were generated by the NSFI/UCR Center for Intelligent Maintenance Systems (IMS) [25, 26]. The experimental setup is shown in Fig. 5. The rotation speed is 2000 rpm and the sampling rate is set at 20 kHz. Vibration acceleration signals were collected every 10 mins by a NI 6062E-DAQ-Card. The accelerated life test experiment was carried out successively for 8 days until the magnetic plug exceeds a certain level and causes an electrical switch to close. Meanwhile, the severe wear failure of outer race was detected in bearing 1. The geometric parameters and ball pass frequency outer (BPFO) race of the tested bearing are presented in Table 1.
Fig. 6 shows the Kurtosis curve over the whole life-cycle of bearing 1 and shows that there is a long time in stable or normal operation for the bearing in whole life-cycle and the period of fault occurrence and severity is relatively short. As shown in Fig. 6, there is an obvious transient feature for the incipient fault at the stage of point 647.
Fig. 5Experimental setup for bearing accelerated life test [22, 23]
![Experimental setup for bearing accelerated life test [22, 23]](https://static-01.extrica.com/articles/18803/18803-img10.jpg)
a)
![Experimental setup for bearing accelerated life test [22, 23]](https://static-01.extrica.com/articles/18803/18803-img11.jpg)
b)
Fig. 6The Kurtosis curve of whole life-cycle of the rolling bearing 1
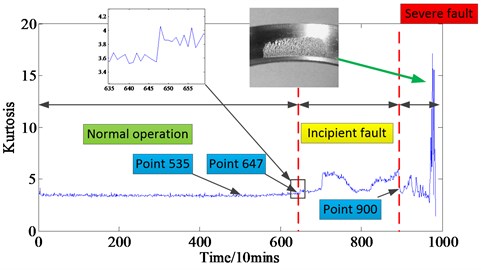
However, due to the interference of environment and background noises, the engineers are not sure whether the fault is happened before point 647 or not. Hence, to verify the effectiveness of the proposed method for bearing incipient fault diagnosis, the experimental data at point 535 was chosen which has no obviously wave phenomenon during the whole life-cycle.
Table 1Geometric parameters and expected characteristic frequencies of the tested bearing
Bearing type | Rexnord ZA-2115 |
Rotating speed of shaft | 2000 rpm |
Pitch diameter | 71.501 mm |
Roller diameter | 8.4074 mm |
Roller number | 16 |
Contact angle | 15.17 deg |
Ball pass frequency outer (BPFO) | 236.4 Hz |
4.2. Results and discussion for Case 1
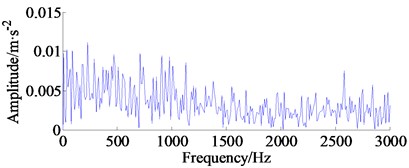
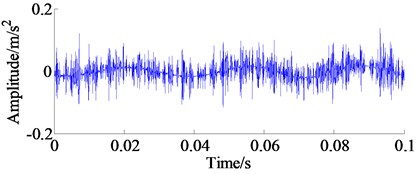
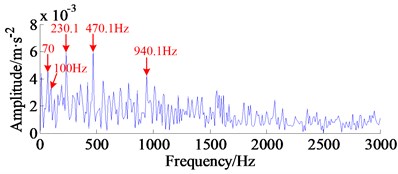
The original vibration signal (2048 sampling points is selected, namely, approximately 0.1 s), the amplitude spectrum and its corresponding envelope spectrum of outer-race at point 535 are displayed in Fig. 7(a), (b) and (c), respectively. From Fig. 7(a), the cyclic periodicity characteristic of time domain waveform relevant to bearing fault cannot be discovered. Moreover, as shown in Fig. 7(c), although the spectrum peak at 230 Hz which consists with the outer-race fault frequency can be detected without denosing, however, the spectrum peak masked by heavy background noise and features are not be evident enough to detect fault.
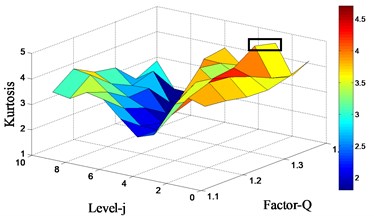
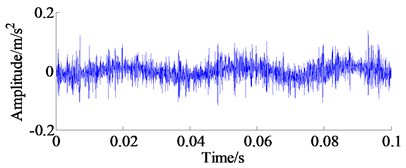
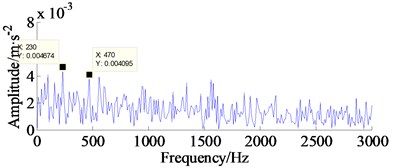
The proposed method is then employed to analyze the outer-race vibration signal. First, for parameter setting, it can be seen from the amplitude spectrum (see Fig. 7(b)) that the spectrum of the shock component is wider, and if the value of is selected higher, due to that the noise component will increase and the underlying wavelets will have more oscillations with a narrower frequency responses, hence, we set the scope of resonant quality factor is with the interval 0.1. The maximal spectral kurtosis TQWT method is applied on the original vibration signal, then the kurtosis values under different scales- are obtained. The Kurtosis surf plot under different -factor and decompose level is displayed in Fig. 8(a). It can be seen from Fig. 8(a), the maximum index of kurtosis 4.709 is emerged in -factor 1.55 and level 3.5, as marked by the black rectangle, which means that this area contains much more transient impulse components information than other -factor and levels areas. Applying the inverse TQWT method to this area and the corresponding reconstructed fault signal is shown in Fig. 8(b). Obviously, the reconstructed signal illustrated in Fig. 8(b) shows that the background noise is suppressed relatively. However, the low-frequency noise components still exist, mainly because of the range of frequencies available band. By computation, the minimum frequency is:
and the maximum frequency is 4688 Hz, thus the impact component with frequency 4252 Hz (see Fig. 7(b)) and high-frequency noise were contained within the scope [1011 Hz, 4688 Hz]. This conclusion can be verified by the corresponding envelope spectrum of the reconstructed signal as illustrated in Fig. 8(c). From Fig. 8(c), although the outer race fault frequency () can be identified, several unrelated frequencies around still remain in frequency domain and also the information are not very obvious.
Fig. 7Original experimental signal, amplitude spectrum and envelope spectrum
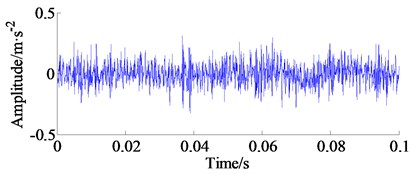
a) Original experimental signal
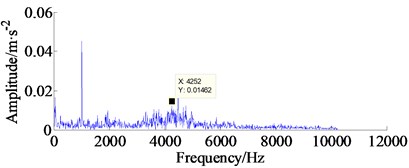
b) Amplitude spectrum of the original bearing vibration signal
c) Envelope spectrum of the original bearing vibration signal
Furthermore, the group-sparse TVD method is employed to process the reconstructed bearing vibration signal, here, the group size is set to 3, the regularization parameter 2 and the iteration time is 300. The filtered signal with group-sparse TVD method and its envelope spectrum are illustrated in Fig. 9(a) and Fig. 9(b), respectively. It can be observed that the noise components in reconstructed vibration signal have been removed evidently as shown in Fig. 9(a), and the cyclic periodicity characteristic is prominent in the filtered vibration signal. From Fig. 9(b), an obvious spectrum line 230.1 Hz, which is close to the frequency according to the Table 1, and its harmonics are exposed in the envelope spectrum, meanwhile, the amplitudes of fault frequencies illustrated in Fig. 9(b) are evidently enhanced compared with that in Fig. 8(c), thus making the feature extraction becomes easier and accurate. Moreover, besides the outer race fault frequency, it is observed that the spectrum peaks at 70 Hz and 100 Hz are also identified in Fig. 9(b), which consists with the double shaft rotating frequency (70 Hz ≈ 2 33.33×2) and its triple frequencies (100 Hz ≈ 3 33.33×3). The above results illustrate that the fault characteristic frequencies can be detected by the proposed method even if the useful failure information is extremely weak.
Fig. 8Kurtosis surf plot under different Q-factor and decompose level, and the reconstructed vibration signal from the maximum peak
a) Kurtosis surf plot under different -factor and decompose level
b) The reconstructed vibration signal
c) The envelope spectrum of the reconstructed vibration signal
Fig. 9The filtered bearing signal and its envelope spectrum processed by proposed method
a) The filtered signal with GS-TVD method
b) The envelope spectrum of the filtered signal
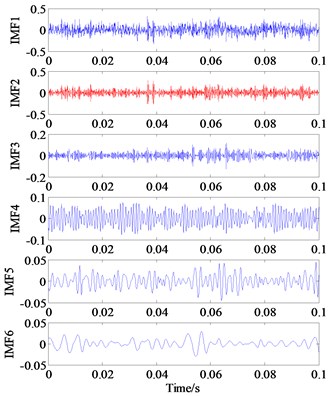
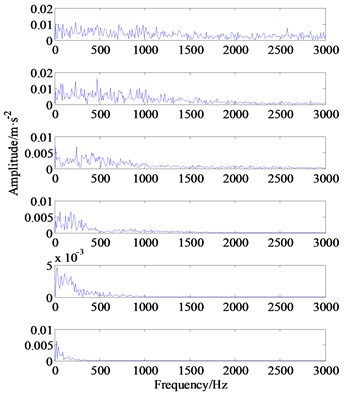
To verify the superiority of the proposed approach, the Spectral Kurtogram (SK) combined with EEMD method is employed to analyze the original vibration signal. The SK is a powerful analysis tool to detect transients feature from their noisy vibration signals and has been widely studied and applied in the rotating machine diagnosis, see refs [27] and [28]. First, we apply the EEMD method [29, 30] to decompose the original vibration signal, thus the 12 IMF components are generated and displayed in Fig. 10, which can be helping to distinguish the periodic impulse from the mixed noisy signal. Then, we calculate the Kurtosis values of all the IMFs model orderly, see Table 2, and 2nd IMF model that contains the most fault information according to its maximum kurtosis value.
Table 2The Kurtosis values of the IMFs model
IMF model | IMF1 | IMF2 | IMF3 | IMF4 | IMF5 | IMF6 | IMF7 | IMF8 | IMF9 | IMF10 | IMF11 | IMF12 |
Kurtosis | 3.350 | 3.902 | 3.819 | 2.119 | 3.118 | 3.801 | 3.051 | 2.593 | 1.548 | 1.455 | 2.143 | 3.063 |
The Kurtogram of 2nd IMF model is displayed in Fig. 11(a), from which the optimal demodulation frequency band namely [0 Hz-2560 Hz] can be detected, as marked by the black rectangle. Thus, a band-pass filter is designed to extract the potential features from the 2nd IMF model. Last, the envelope spectrum is applied to the filtered signal, the corresponding envelope spectrum is illustrated in Fig. 11(b). As can be seen, the fault characteristic frequencies 236.4 Hz cannot be detected in the envelope spectrum and it is also hard to distinguish the fault location from the incipient vibration signal. In conclusion, the comparison above re-confirms the efficiency of the proposed approach.
Fig. 10Sub-band components of original signal decomposed by using EEMD
a) IMF1-IMF6
b) The Hilbert envelop spectrum of IMF1-IMF6
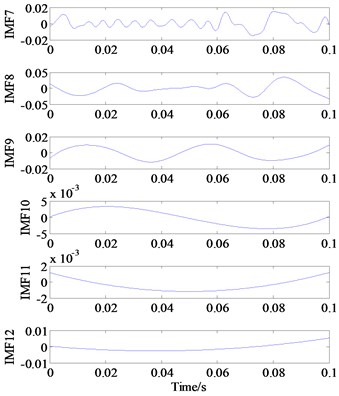
c) IMF7-IMF12
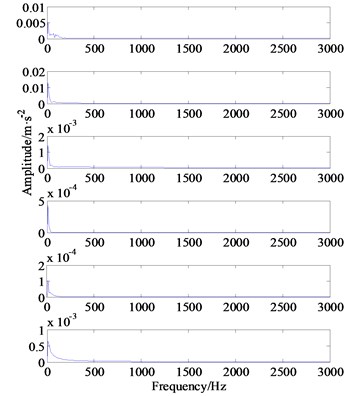
d) The Hilbert envelop spectrum of IMF7-IMF12
4.3. Case 2 – experimental setup
The bearing vibration signals were generated by the Curtin University in Australia [31]. The experimental setup (Machinery Fault Simulator, MFS) is shown in Fig. 12. The rotation speed is 29 Hz, sampling frequency is 51200 Hz and length of record is 10 seconds. The bearing information and the fault frequencies of inner race and outer race are summarized in Table 3.
In this work, the inner race fault signal was chosen as an example for the subsequent analysis, and the theoretical inner race fault frequency is 103.59 Hz based on the equation , where and are ball diameter and pitch diameter of the rolling bearing, respectively. Parameter represents contact angle ( 0), denotes the number of elements, represents shaft rotating speed ( 29×60 1740 rpm).
Fig. 11Kurtogram of second IMF model component and its frequency spectrum
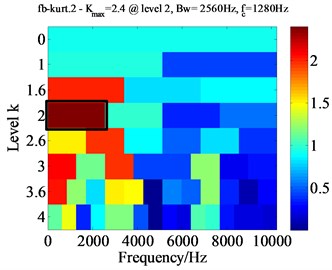
a) Kurtogram of second IMF model component
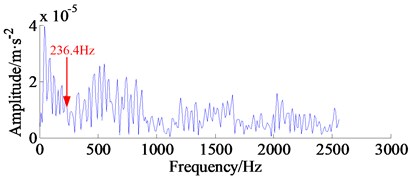
b) The envelope spectrum of band-pass filtered signal
Fig. 12Experimental setup
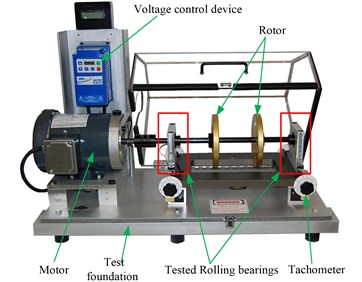
Table 3Bearing information and fault frequencies (note that SS is shaft speed, i.e., 29 Hz)
Bearing No. | Number of balls | Ball diameter | Pitch diameter | FTF | BPFI | BPFO | BSF |
MBER-16K | 9 | 7.9375 mm | 38.50 mm | 0.3969×SS | 3.572×SS | 5.428×SS | 2.32×SS |
4.4. Results and discussion for case 2
In this experiment, the inner race vibration fault signal (5120 points), i.e. 0.1 second data was selected. In order to get a real early failure, a Gaussian white noise with amplitude 17 (a high amplitude noise was added for highlighting the effect of proposed method) was added to the original signals. The time domain waveform, amplitude spectrum and its corresponding envelope spectrum are shown in Fig. 13(a), (b) and (c), respectively. However, it can be found that the periodical pulses are submerged in heavy noise in the time domain signal, and the inner fault cannot be identified from the envelope spectrum and fault type cannot be determined yet.
The proposed approach is applied to the experimental signal, the algorithm parameters of maximal spectral kurtosis TQWT method are the same as the previous section. The Kurtosis surf plot under different -factor and decompose level, and the reconstructed bearing vibration signal are shown in Fig. 14. From Fig. 14(a), the maximum index of Kurtosis 12.63 is emerged in -factor 1.55 and level 7.5, as marked by the black rectangle. The fault- induced impulses with cyclic periodicity characteristic can be identified from the reconstructed vibration signal.
Fig. 13Experimental signal of inner race failure, amplitude spectrum and its envelope spectrum
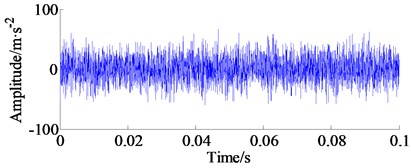
a) Experimental signal of inner race failure
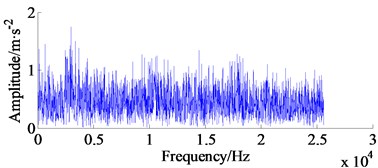
b) Amplitude spectrum
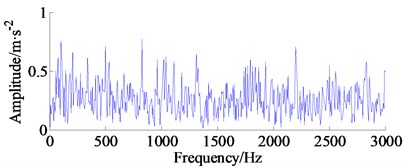
c) Envelope spectrum
Fig. 14Kurtosis surf plot under different Q-factor and decompose level, and the reconstructed vibration signal from the maximum peak
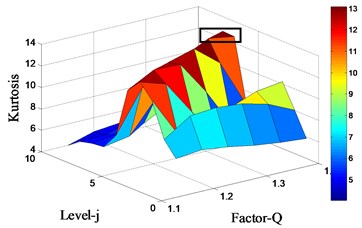
a) Kurtosis surf plot under different -factor and decompose level
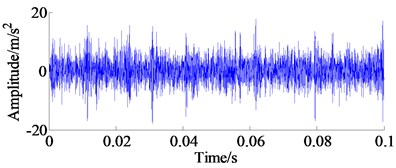
b) The reconstructed vibration signal
Fig. 15The reconstructed bearing signal and its envelope spectrum processed by proposed method
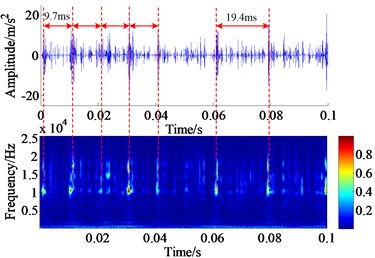
a) The filtered signal with GS-TVD method and its wavelet time-frequency diagram
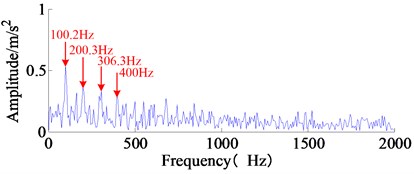
b) The envelope spectrum of the filtered signal
Similarly, the reconstructed bearing vibration signal is also processed by the group-sparse TVD method, and the group size is set to 2, the regularlization parameter is 2 and the iteration time is 300. The filtered signal with GS-TVD method and its wavelet time-frequency diagram, and its envelope spectrum are displayed in Fig. 15.
Obviously, it can be observed that the GS-TVD algorithm not only extracts the transient impulse components but also the noise components in reconstructed vibration signal have been removed evidently. As shown in Fig. 15(a), the phenomenon of frequency modulation can be clearly observed by the wavelet time-frequency diagram, and the impact interval of 9.7 ms could be also identified via the wavelet time-frequency diagram and the time-domain waveform, which coincides with the inner race fault frequency. From Fig. 15(b), as can be seen, the characteristic frequency 100.2 Hz, which is agreeable with the theoretical fault frequency of inner race 103.59 Hz, and its harmonic frequencies are clearly detected, hence, the proposed approach has a very powerful effect on the incipient fault diagnosis.
Fig. 16Sub-band components of original signal decomposed by using EEMD
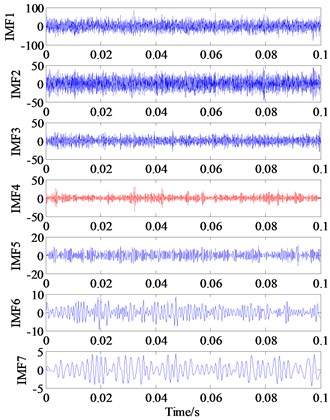
a) IMF1-IMF7
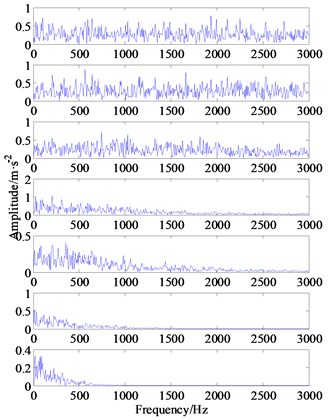
b) The Hilbert envelop spectrums of IMF1-IMF7
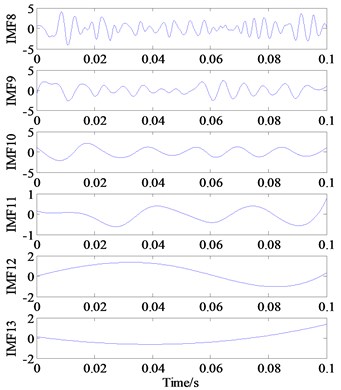
c) IMF8-IMF13
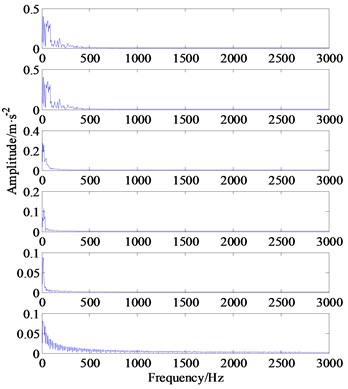
d) The Hilbert envelop spectrums of IMF8-IMF13
For a comparison, the EEMD result, i.e., 13 IMF components related to the inner race fault are shown in Fig. 16. Meanwhile, the Kurtogram is also calculated to assist selecting the optimal frequency band for envelope demodulation analysis, as illustrated by Fig. 17(a). Based on highest SK value in Kurtogram, see Table 4, an optimal frequency band namely [0-1066.66 Hz] is selected for the 4th IMF model, as marked by the black rectangle, then the sensitive component within potential fault frequency is separated via a band pass filter. Unfortunately, the inner race fault characteristic frequencies 103.59 Hz cannot be detected in the envelope spectrum, see Fig. 17(b).
Table 4The Kurtosis values of the IMFs model
IMF model | IMF1 | IMF2 | IMF3 | IMF4 | IMF5 | IMF6 | IMF7 | IMF8 | IMF9 | IMF10 | IMF11 | IMF12 | IMF13 |
Kurtosis | 2.983 | 2.199 | 3.039 | 4.840 | 2.528 | 2.816 | 2.286 | 2.717 | 2.386 | 2.050 | 1.801 | 1.672 | 3.314 |
Obviously, although the double inner fault frequency (210 Hz) can be identified, the peak amplitude is lower than that of the proposed approach. Therefore, the comparison analysis demonstrates that the proposed maximal spectral kurtosis TQWT and group sparsity TVD approach can not only provide better de-nosing performance but also has superiority in enhancing performance for incipient fault diagnosis.
Fig. 17Kurtogram and its frequency spectrum
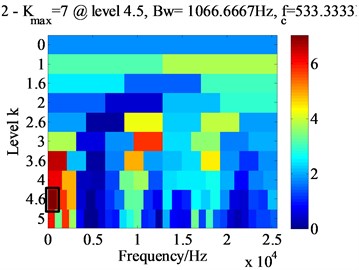
a) Kurtogram of 4th IMF model component
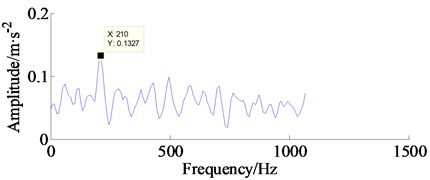
b) The envelope spectrum of band-pass filtered signal
5. Conclusions
In this paper, a novel maximal spectral kurtosis TQWT and group sparsity total variation denoising (GS-TVD) technique is proposed for bearing incipient fault diagnosis. Two main contribution of this work can be summarized as:
1) The optimal -factors and decomposition level can be found for fault feature extraction by the maximal spectral kurtosis TQWT, which match the fault periodical impulses well, overcoming the disadvantage of not being able to choose automatically using traditional TQWT method.
2) The group sparsity total variation denoising (GS-TVD) approach is applied to remove the noise from the reconstructed vibration signal generated by maximal spectral kurtosis TQWT, and the periodical transient impulses were detected obviously. Experimental results show that the proposed approach has better performance than existing algorithm.
References
-
Zhang M., Jiang Z. N., Feng K. Research on variational mode decomposition in rolling bearings fault diagnosis of the multistage centrifugal pump. Mechanical Systems and Signal Processing, Vol. 93, Issue 1, 2017, p. 460-493.
-
Rai A., Upadhyay S. H. A review on signal processing techniques utilized in the fault diagnosis of rolling element bearings. Tribology International, Vol. 96, 2016, p. 289-306.
-
Chen J., Randall R. B. Intelligent diagnosis of bearing knock faults in internal combustion engines using vibration simulation. Mechanism and Machine Theory, Vol. 104, 2016, p. 161-176.
-
Lotfi S., Jaouher B. A., Farhat F. Bi-spectrum based-EMD applied to the non-stationary vibration signals for bearing faults diagnosis. ISA Transactions, Vol. 53, Issue 5, 2014, p. 1650-1660.
-
Hemmati F., Orfali W., Gadala M. S. Roller bearing acoustic signature extraction by wavelet packet transform, applications in fault detection and size estimation. Applied Acoustics, Vol. 104, 2016, p. 101-118.
-
Lei Y. G., He Z. J., Zi Y. Y. EEMD method and WNN for fault diagnosis of locomotive roller bearings. Expert Systems with Applications, Vol. 38, Issue 6, 2011, p. 7334-7341.
-
Li Q., Liang S. Y., Song W. Q. Revision of bearing fault characteristic spectrum using LMD and interpolation correction algorithm. Procedia CIRP, Vol. 56, 2016, p. 182-187.
-
Li Q., Ji X., Liang S. Y. Incipient fault feature extraction for rotating machinery based on improved AR-minimum entropy deconvolution combined with variational mode decomposition approach. Entropy, Vol. 19, 2017, p. 317.
-
Faghidi H., Liang M. Bearing fault identification by higher order energy operator fusion: A non-resonance based approach. Journal of Sound and Vibration, Vol. 381, 2016, p. 83-100.
-
Yi C. C., Lv Y., Dang Z., Xiao H., Yu X. Quaternion singular spectrum analysis using convex optimization and its application to fault diagnosis of rolling bearing. Measurement, Vol. 103, 2017, p. 321-332.
-
Yi C. C., Lv Y., Xiao H., You G., Dang Z. Research on the blind source separation method based on regenerated phase-shifted sinusoid-assisted EMD and Its application in diagnosing rolling-bearing faults. Applied Sciences, Vol. 7, 2017, p. 414.
-
Yi C. C., Lv Y., Xiao H., Tu S. Laser induced breakdown spectroscopy quantitative analysis based on low-rank matrix approximation. Journal of Analytical Atomic Spectrometry, Vol. 32, 2017, p. 2164-2172.
-
He G. L., Ding K., Lin H. B. Fault feature extraction of rolling element bearings using sparse representation. Journal of Sound and Vibration, Vol. 366, 2016, p. 514-527.
-
Li Q., Liang S. Y. Incipient fault diagnosis of rolling bearings based on impulse-step impact dictionary and re-weighted minimizing nonconvex penalty Lq regular technique. Entropy, Vol. 19, Issue 8, 2017, p. 421.
-
Gan M., Wang C., Zhu C. A. Construction of hierarchical diagnosis network based on deep learning and its application in the fault pattern recognition of rolling element bearings. Mechanical Systems and Signal Processing, Vol. 72, Issue 73, 2016, p. 92-104.
-
Selesnick I. W. Wavelet transform with tunable Q-factor. IEEE Transactions on Signal Processing, Vol. 59, Issue 8, 2011, p. 3560-3575.
-
Selesnick I. W. Sparse signal representations using the tunable Q-factor wavelet transform. SPIE Proceedings, Vol. 8138, 2011, p. 1-15.
-
Wang H. C., Chen J., Dong G. M. Feature extraction of rolling bearing’s early weak fault based on EEMD and tunable Q-factor wavelet transform. Mechanical Systems and Signal Processing, Vol. 48, Issue 1, 2014, p. 103-119.
-
Li Y. B., Liang X. H., Xu M. Q., Huang W. H. Early fault feature extraction of rolling bearing based on ICD and tunable Q-factor wavelet transform. Mechanical Systems and Signal Processing, Vol. 86, Issue 1, 2017, p. 204-223.
-
Chen P. Y., Selesnick I. W. Group-sparse signal denoising: non-convex regularization, convex optimization. IEEE Transactions on Signal Processing, Vol. 62, Issue 13, 2014, p. 3464-3478.
-
Selesnick I. W., Chen P. Y. Total variation denoising with overlapping group sparsity. IEEE International Conference on Acoustics, Speech and Signal Processing (ICASSP), Vancouver, BC, Canada, 2013.
-
Selesnick I. W. Total variation denoising via the Moreau envelope. IEEE Signal Processing Letters, Vol. 24, Issue 2, 2017, p. 216-220.
-
Figueiredo M. A. T., Dias J. B., Nowak R. D. Majorization minimization algorithms for wavelet-based image restoration. IEEE Transactions Image Processing, Vol. 16, Issue 12, 2007, p. 2980-2991.
-
Figueiredo M. A. T., Dias J. B., Oliveira J. P., Nowak R. D. On total-variation denoising: A new majorization-minimization algorithm and an experimental comparison with wavelet denoising. Proceedings of IEEE International Conference on Image Processing, 2006, p. 2633-2636.
-
Center for Intelligent Maintenance Systems, http://www.imscenter.net/.
-
Qiu H., Lee J., Lin J., Yu G. Wavelet filter-based weak signature detection method and its applicationon roller bearing prognostics. Journal of Sound and Vibration, Vol. 289, 2016, p. 1066-1090.
-
Antoni J. The spectral kurtosis: a useful tool for characterising non-stationary signals. Mechanical Systems and Signal Processing, Vol. 20, Issue 2, 2006, p. 282-307.
-
Antoni J. Fast computation of the kurtogram for the detection of transient faults. Mechanical Systems and Signal Processing, Vol. 21, Issue 1, 2007, p. 108-124.
-
Yu K., Lin T. R., Tan J. W. A bearing fault diagnosis technique based on singular values of EEMD spatial condition matrix and Gath-Geva clustering. Applied Acoustics, Vol. 121, 2017, p. 33-45.
-
Zvokelj M., Zupan S., Prebil I. EEMD-based multiscale ICA method for slewing bearing fault detection and diagnosis. Journal of Sound and Vibration, Vol. 370, Issue 26, 2016, p. 394-423.
-
SpectraQuest, http://spectraquest.com/machinery-fault-simulator/details/mfs-lt/.
Cited by
About this article
This research is funded by the Fundamental Research Funds for the Central Universities (Grant No. CUSF-DH-D-2017059) and the National Natural Science Foundation of China (Grant No. 51675096). The authors wish to express their sincere gratitude for this support.

