Abstract
In this study, a nonlinear translation-torsion model of spur gear pair with flexible support of gearbox is proposed. The time-varying meshing stiffness, transmission error and backlash are considered in this model. Lagrange’s equations are used for establishing the mathematic model. The numerical method is presented for solutions of nonlinear differential equations. The effect of rotating speed and support stiffness of gearbox is analyzed. The numerical results show that the flexibility of the support of gearbox has a significant effect on the amplitude-frequency characteristic of the spur gear pair at low rotating speeds. The response shows flexibility while the support stiffness is smaller than the bearings and rigidity while the support stiffness is larger than the bearings. The maximum deformation of the driving gear bearings under the flexible support is generally greater than the one under rigid support.
1. Introduction
Gear transmission system is one of the most important mechanisms used for motion and power transmission in industrial machinery, such as machine tool, automobile, wind turbine, etc. Many researchers have paid their attention to analyze the characteristics of gear systems by analytical methods, simulation technique and experimental methods. Most early researches focused on the mathematic modeling of a spur gear pair supported by flexible shaft and bearings, where gear torsional vibrations were the main concern [1, 2]. Both of lamped mass method and finite element method are used for establishing the dynamic model. Both of the numerical methods and approximate analytical methods are used for solving the analyzing the dynamic characteristics of spur gear pair.
Clearances including tooth backlash and clearance of bearings provide strong-nonlinearity for the gear system and makes contributions to the vibration and noise of the gear system. In the early 1990s, Kahraman and Singh made parametric studies about bearing stiffness to meshing stiffness ratio, radial bearing preload to mean force ratio, etc. [3] and revealed interaction between time-varying meshing stiffness and backlash [4, 5] using both of the numerical method and harmonic balance method (HBM). Later in 2006, a torsional nonlinear dynamic model with 2-degree-of-freedom was reduced to a dynamic model with single-degree-of-freedom and the incremental harmonic balance method (IHBM) was used for analyzing the torsional response of spur gear pair considering time-varying meshing stiffness, static transmission error and backlash [6]. Lassâad [7] investigated dynamics of a two-stage gear system involving backlash and time-dependent meshing stiffness. Chen [8] focused on the effects of the friction and dynamic backlash on the multi-degree of freedom nonlinear dynamic gear transmission system, which incorporated time varying stiffness. Li [9] investigated the nonlinear dynamic characteristics of a gear pair system with dynamic backlash subjected to internal and external periodic excitations based on IHBM.
Friction force also provides strong-nonlinearity for the geared system. Many scholars have studied the influence of friction on gear dynamics. Benedict and Kelley [10] analyzed the friction coefficient of gear meshing in a gear contact as simulated on a roller test machine. Howard [11] provided a simplified gear dynamic model aimed at exploring the effect of friction on the resultant gear case vibration. Effect of friction force on the multi-degree of freedom nonlinear dynamic gear transmission system was also studied in reference [8]. Li [12] proposed a tribo-dynamics model which coupled a mixed elastohydrodynamic lubrication model for spur gear pairs. Ghosh [13] studied the instability due to parametric excitation from variable meshing stiffness in a gear pair system with the help of a six-degree-of-freedom translational-rotational model to consider the contribution of tooth sliding friction. Zhou [14] developed a coupled lateral-torsional nonlinear dynamic model with 16-degree-of-freedom (16-DOF) of gear-rotor-bearing transmission system (GRBTS) to study the effect of friction coefficient and mead load on the dynamic response of the GRBTS.
Parameter excitations, such as time-varying meshing stiffness and gear transmission error, provide weak-nonlinearity for the gear system. Many researchers have developed various mathematical models, such as analytical method [15-18], finite element method [19-22] and experimental method, to calculate the time-varying meshing stiffness [23, 24]. Transmission error is one of the most important internal excitation of spur gear pair and the major internal exaction of many previous models [3-6].
To the author’s knowledge, the effect of gearbox case was mostly neglected, and the support condition of the gearbox was assumed commonly to be rigid in the previous studies on spur gear dynamics. Therefore, for many mechanical equipment, such as wind turbines, the support condition of the gearbox is flexible. In these cases, the flexibility of gearbox support is non-negligible. Thus, the dynamic model of spur gear pair with flexible support of gearbox is proposed in this paper. The dynamic model of gear pair with flexible support of gearbox will be proposed in Section 2. Numerical simulation results are provided to analyze the dynamic characteristics of the gear pair in Section 3. The conclusions will be given in Section 4.
2. Dynamic model of the spur gear pair
In this paper, some assumptions are presented to simplify the dynamic model: (a) the gearbox is reduced to a rigid body, (b) the time-varying meshing stiffness is approximated by Fourier function, (c) the effect of manufacturing error and assembly error is reduced to static transmission error which is defined in Fourier series, (d) the thermal deformation of the gear pair and friction forces at the gear meshing point are neglected, (e) the support of bearings is modeled by fixed stiffness spring and (f) both of the meshing damping and support damping are modeled by viscous damping.
Fig. 1Dynamic model of a spur gear pair with flexible support of gearbox
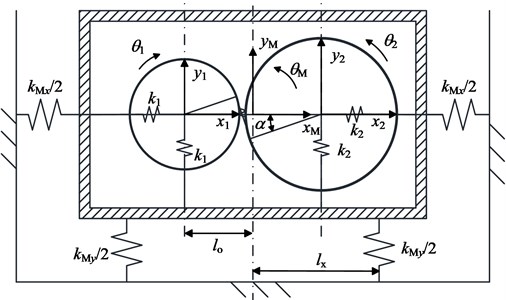
Fig. 1 shows a dynamic model of a spur gear pair with flexible support of gearbox. As shown in Fig. 1, each component has three degrees of freedom, two translational vibration degrees of freedom and one torsional vibration degree of freedom. The time-varying meshing stiffness is expressed [25]:
where, km(t) is the time-varying meshing stiffness which consists of mean component k0m and periodic components with amplitude coefficients knm and phase angles φnk. In this paper, ωm represents the meshing frequency of the spur gear pair.
Like the definition of time-varying meshing stiffness, the transmission error is also defined in Fourier series [25] as shown in Eq. (2):
Here, em(t) represents the static transmission error which consists of periodic components with amplitudes enm and phase angle φne, respectively.
The comprehensive deformation δ(t) between the driving gear and driven gear along the meshing line is expressed:
where α is the pressure angle of the driving gear and driven gear; r1 and r2 are base radii of driving gear and driven gear, respectively.
Considering the effect of backlash, the non-linearity function of the comprehensive deformation is expressed:
where b represents the half-backlash value. The meshing force, fm, is expressed:
where, cm is the meshing damping which is defined as a constant. In this system, the deformation of bearings and support springs is as follows:
where δ1x and δ1y represent the relative displacement between driving gear bearings and gearbox in x1 direction and y1 direction, δ2x and δ2y represent the relative displacement between driven gear bearings and gearbox in x2 direction and y2 direction, δLMx and δRMx represent the deformation of left and right supporting springs of gearbox in xM direction and δLMy and δRMy represent the deformation of left and right supporting springs of gearbox in yM direction. The symbol lo represents the distance between the rotary center of driving gear and driven gear and lx is the distance between the support spring of gearbox in yM direction and the mass center of the gearbox. We can obtain:
where, T represents the kinetic energy, U is the potential energy of bearings and flexible supports of the gearbox and R is the dissipation function of bearing damping and flexible support damping. The symbols, m1, m2 and mM are the masses of driving gear, driven gear and gearbox and J1, J2 and JM are the moment of inertia of driving gear, driven gear and gearbox. The symbols, k1, k2, kMx and kMy, represent the supporting stiffness of driving gear bearings, driven gear bearings and supporting springs of gearbox and c1, c2, cMx and cMy are the corresponding damping.
Using the Lagrange’s equations, the differential equations of motion of the system is established:
where Qf and is the generalized force and qf is the generalized coordinate which are defined in Eq. (13):
In Eq. (13), Td is the driving torque and Tl is the load torque. The mathematic model of the spur gear pair with flexible support of gearbox is expressed as:
3. Numerical simulation and result discussion
The parameters of the spur gear pair are shown in Table 1. In this paper, N= 1 is applied to Eq. (1) and Eq. (5) and the damping coefficient of flexible support is ξ= 0.15. The damping of flexible support is written as:
where j=[x,y]. The New-Mark-β method is used for solving Eq. (14). For a better comparison, a dynamic model of spur gear pair under rigid support condition is giving in Appendix B. The effect of rotating speed on the dynamic response will be discussed in section 3.1, the effect of support stiffness will be discussed in section 3.2 and the bearing deformation will be discussed in section 3.3.
Table 1Parameters of the gear pair
Parameter | Value | Parameter | Value |
Pressure angle α | 20° | Mass m1/m2 | 1.53/3.01 kg |
Mass mM | 19.87 kg | Moment of inertia J1/J2 | 0.041/0.079 kg·m2 |
Moment of inertia JM | 0.35 kg·m2 | Stiffness of bearings k1/k2 | 2/2×108 N·m-1 |
Meshing stiffness k0m | 3.2×10⁸ N·m-1 | Meshing stiffness coefficient k1m | 0.3 |
Phase angle of meshing stiffness coefficient φ1k | 0 | Damping of bearings c1/c2 | 1800/1800 N·s·m-1 |
Meshing damping cm | 2000 N·s·m-1 | Transmission error e1m | 1×10⁻⁵ m |
Phase angle of the transmission error φ1e | 0 | Half-backlash value b | 1×10⁻⁵ m |
Driving torque Td | 110 N·m | Loading torque Tl | 150 N·m |
3.1. Effect of rotating speed
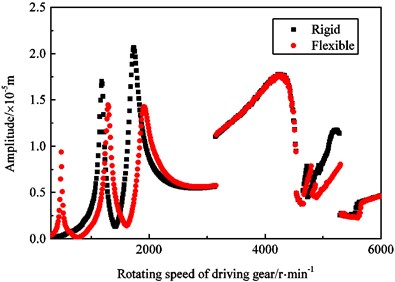
In this section, the stiffness of flexible support is supposed to be kMx= 2.5×10⁵ N·m-1 and kMy= 2.5×10⁵ N·m-1. Taking the rotating speed of the driving gear as a control parameter, both of the amplitude-frequency response curve of the driving gear in y1-direction under flexible support condition and rigid support condition are shown in Fig. 2.
Under rigid support condition, two significant peaks at 1180 r·min-1 and 1730 r·min-1 appear while the rotating speed is less 3100 r·min-1. As the speed increases, there is a jump at rotating speed of 3140 r·min-1. With the further increase of the rotating speed, another four jumps appear at n= 4650 r·min-1, n= 4730 r·min-1, n= 4930 r·min-1 and n= 5290 r·min-1. The response beyond 4650 r·min-1 becomes strongly non-linear and consists of periodic, multi-periodic and chaotic motion. Under flexible support condition, it is obvious that one more peak appears at rotating speed of 480 r·min-1. The other two peaks appear at rotating speed of 1290 r·min-1 and 1900 r·min-1 of which the rotating speeds are slightly higher than the corresponding ones under rigid support condition. Several jumps appear at rotating speed of 4670 r·min-1, 4810 r·min-1, 4880 r·min-1 and 5310 r·min-1 as the rotating speed increases. With the further increase of the rotating speed, the response beyond 4670 r·min-1 also becomes strongly non-linear and consists of period, multi-periodic and chaotic motion.
Fig. 2Amplitude-frequency response curve the driving gear in y1 direction
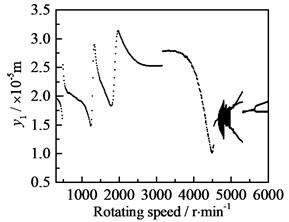
The waterfall plot of displacement of driving gear in y1-direction under flexible support condition is shown in Fig. 3(a) and the corresponding bifurcation diagram is shown in Fig. 3(c). The meshing frequency (fm) is the dominant response, the amplitude of 2-meshing frequency (2fm) is relatively small, and the bifurcation diagram shows that the response is periodic motion in the range of n∈[300,4650]. The meshing frequency (fm) is the dominant response, non-harmonic frequency components appear in the system response and the response is chaotic motion in the range of n∈(4650,4990]. Multiplication frequency components, such as fm/3, 2fm/3, fm, 2fm, etc. appear and the response is 3-T periodic motion in the range of n∈(4990,5310]. With the increase of rotating speed, the 3-T periodic motion is replaced by periodic motion, the meshing frequency is the dominant response and the amplitude of 2fm is obvious in the range of n∈(5310,5610]. With the further increase of rotating speed, multiplication frequency components, such as fm/2, fm, 2fm, etc. appear and the response is replaced by 2-T periodic motion in the range of n∈(5610,6000]. In short, the spur gear pair under flexible support condition undergoes periodic motion, chaotic motion and N-T periodic motion.
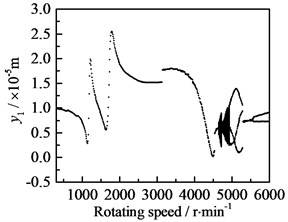
The waterfall plot of displacement of driving gear in y1-direction under rigid support condition shown in Fig. 3(b) and the corresponding bifurcation diagram shown in Fig. 3(d) are similar to the ones under flexible support condition. The spur gear pair under rigid support condition also undergoes periodic motion, chaotic motion and N-T periodic motion. The gear system exhibits periodic motion in y1-direction and the frequency components about fm and 2fm appear in the range of n∈[300,4640]∪(5400,5460]. The response is replaced by chaotic motion and the frequency components about meshing frequency and some non-harmonic frequency are obvious in the range of n∈(4640,4980]. The frequency components about fm/3, 2fm/3, fm, 2fm, etc. appear and the response is 3-T periodic motion in the range of n∈(4980,5400]. While the rotating speed is beyond 5460 r·min-1, the spur gear pair exhibits 2-T periodic motion in y1 direction and frequency components about fm/2, fm, 2fm, etc. are obvious.
Fig. 3Waterfall plots and bifurcation diagrams of driving gear in y1 direction: a) waterfall plot under flexible support condition, b) waterfall plot under rigid support condition, c) bifurcation diagram under flexible support condition, d) bifurcation diagram under rigid support condition
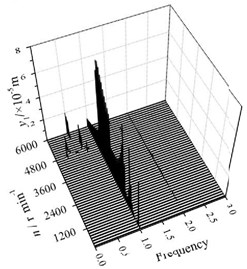
a)
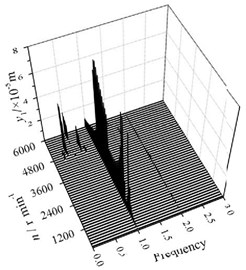
b)
c)
d)
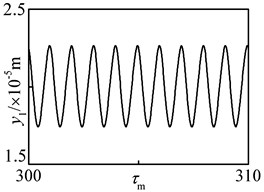
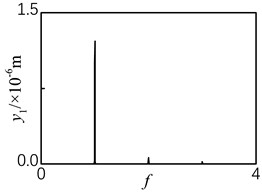
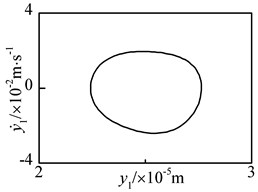
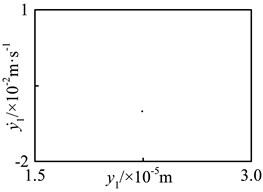
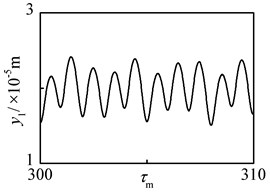
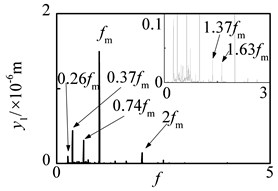
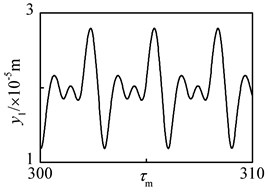
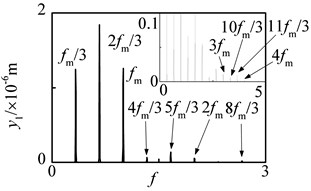
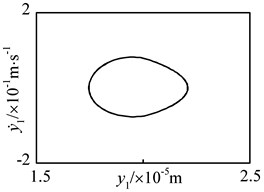
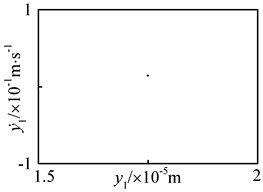
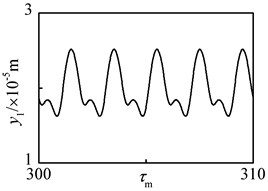
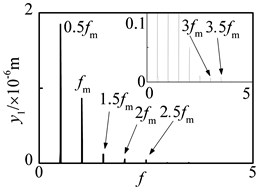
For a better clarity, the dynamic response of the spur gear pair under flexible support condition will be analyzed at five rotating speeds of n= 1500 r·min-1, n= 4900 r·min-1, n= 5300 r·min-1, n= 5500 r·min-1 and n= 5900 r·min-1. Here, the time history is shown in Fig. 3(a), FFT spectrum is shown in Fig. 3(b), the phase plane is shown in Fig. 3(c) and the Poincaré map is shown in Fig. 3(d). The response at n= 1500 r·min-1 is illustrated in Fig. 4. The time history indicates that the response is periodic. The spectrum illustrates that the meshing frequency (fm) is the dominant response and the amplitude of 2-meshing frequency (2fm) is relatively small. The phase plane and the Poincaré map indicate that response at n= 1500 r·min-1 is periodic motion. The response at n= 4900 r·min-1 is shown in Fig. 5. The time history shows that there is no obvious periodicity.
Fig. 4Periodic motion of driving gear in y1 direction at n= 1500 r·min-1 under flexible support condition: a) time history, b) FFT spectrum, c) phase plane, d) Poincaré map
a)
b)
c)
d)
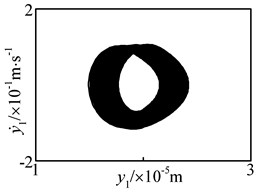
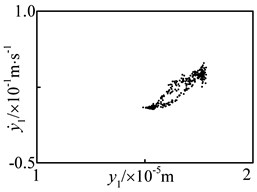
Fig. 5Chaotic motion of driving gear in y1-direction at n= 4900 r·min-1 under flexible support condition: a) time history, b) FFT spectrum, c) phase plane, d) Poincaré map
a)
b)
c)
d)
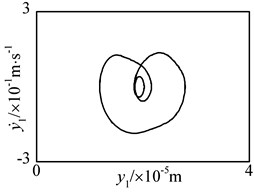
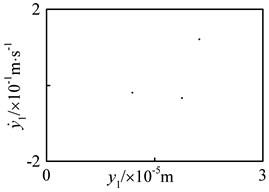
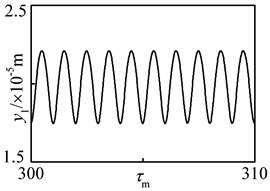
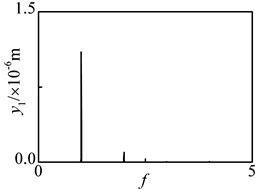
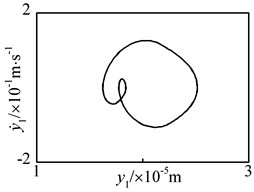
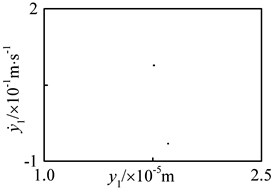
As shown in the spectrum, fm is the dominant response and non-harmonic frequency components, such as 0.26 fm, 0.37fm, 0.74fm, 1.37fm and 1.63fm, etc., appear. The phase plane and the Poincaré map indicate that response at n= 4900 r·min-1 is chaotic motion. The response at n= 5300 r·min-1 is shown in Fig. 6. The time history indicates that the response is triply period. The spectrum shows that 2fm/3 is the dominant response and amplitudes at fm/3, fm, 4fm/3, 5fm/3, 2fm and 8fm/3 are obvious. The phase plane and the Poincaré map indicate that response at n= 5300 r·min-1 is 3-T periodic motion. The response at n= 5500 r·min-1 is shown in Fig. 7. Like the response at n= 1500 r·min-1, the response at n= 5500 r·min-1 is also period as the time history shows. The spectrum shows that component at fm is the dominant response and the amplitude at 2fm is relatively small. The phase plane and Poincaré map indicate that the response at n= 5500 r·min-1 is also periodic motion. As the rotating speed increases to n= 5900 r·min-1, the dynamic response is shown in Fig. 8. The time history shows that the response is doubly period. The spectrum illustrates that the component at fm is the dominant response and amplitudes at fm/2, fm, 3fm/2, 2fm, 3fm, etc. are obvious. The phase plane and Poincaré map indicates that the response at n= 5900 r·min-1 is 2-T periodic motion.
Fig. 63-T periodic motion of driving gear in y1-direction at n= 5300 r·min-1 under flexible support condition: a) time history, b) FFT spectrum, c) phase plane, d) Poincaré map
a)
b)
c)
d)
Fig. 7Periodic motion of driving gear in y1-direction at n= 5500 r·min-1 under flexible support condition: a) time history, b) FFT spectrum, c) phase plane, d) Poincaré map
a)
b)
c)
d)
Fig. 82-T periodic motion of driving gear in y1-direction at n= 5900 r·min-1 under flexible support condition: a) time history, b) FFT spectrum, c) phase plane, d) Poincaré map
a)
b)
c)
d)
3.2. Effect of support stiffness of gearbox
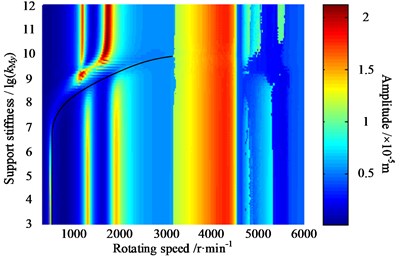
In this section, the effect of support stiffness of gearbox and rotating speed on the dynamic response is discussed. The support stiffness of gearbox in xM direction is supposed to be equal to the one in yM direction. Here, the rotating speed n and support stiffness of gearbox kMy are treated as control parameters varying in range of n∈[300,6000] and kMy∈[103,1012]. The amplitude-frequency-stiffness response map is shown in Fig. 9.
The effect of support stiffness of gearbox on the response is quite evident as the rotating speed varying in range of n∈[300,3100]. The first crest appears at n= 480 r·min-1. The crest at n= 480 r·min-1 gradually decreases and moves to the right of the figure along the black line. Another two crests at n= 1290 r·min-1 and n= 1900 r·min-1 appear as the support stiffness is blow the black line and two crests at n= 1180 r·min-1 and n= 1730 r·min-1 appear as the support stiffness is above the black line while the rotating speed is less than 3100 r·min-1. With the increase of rotating speed, the support stiffness of gearbox has little effect on the dynamic response in y1 direction in the range of n∈[3100,4400]. When the rotating speed is beyond 4400 r·min-1, the support stiffness of gearbox has some irregular effect on the dynamic response in y1 direction. Compared to the amplitude-frequency cure of the driving gear in y1 direction shown in Fig. 2, it is obvious that the response of driving gear in y1 direction under flexible support condition with large support stiffness is more similar to the one under rigid support condition.
Fig. 9Amplitude-frequency-stiffness response map of the driving gear in y1 direction
3.3. Bearing deformation
For many mechanical equipment, the failure often occurs in the bearings. Thus, the bearing deformation of the driving gear bearings under flexible support condition and the one under rigid support condition are compared in this section.
The bearing deformation of the driving gear bearings under rigid support condition, δir(t), is expressed:
The bearing deformation of the driving gear under flexible support condition, δif(t), is expressed:
The maximum relative displacement coefficient, η, is defined as:
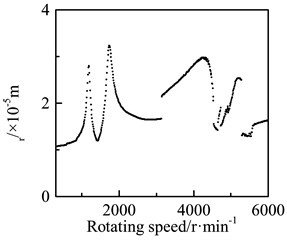
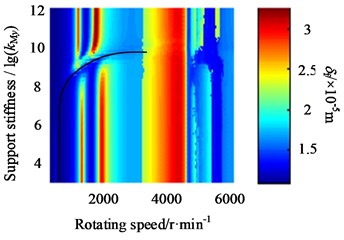
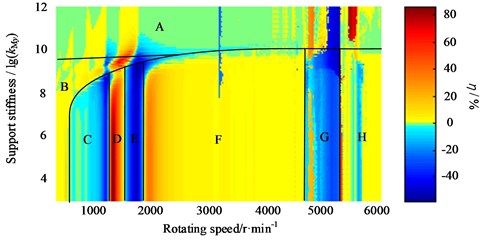
Fig. 10Bearing deformation of the driving gear bearings: a) deformation-frequency response cure under rigid support condition, b) deformation-frequency-stiffness response map under flexible support condition, c) η frequency-stiffness response map
a)
b)
c)
The deformation-frequency response cure of the driving gear is shown in Fig. 10(a), the deformation-frequency-stiffness response map of the driving gear is shown in Fig. 10(b) and the η frequency-stiffness response map of the driving gear bearings is shown in Fig. 10(c). Comparing Fig. 10(a) with Fig. 2, the deformation-frequency response cure is similar to the amplitude-frequency response curve of the spur gear pair. Comparing Fig. 10(b) with Fig. 9, it is obvious that the δf frequency-stiffness response map of the driving gear bearings is similar to the amplitude-frequency-stiffness response map of the driving gear in y direction.
The difference between these two figures is that the crest along the black line in Fig. 10(b) is inconspicuous. Fig. 10(c) shows the η frequency-stiffness response map of the driving gear bearings, which represents the quantitative comparison between the bearing deformation of the driving gear under flexible support condition and the bearing deformation of the driving gear under rigid support condition. This map is divided into several different areas for a better clarity. Area A represents the maximum relative displacement coefficient with large support stiffness. The coefficient η is generally close to zero in area A, which means that the bearing deformation of driving gear bearings with large support stiffness is close to the deformation of driving gear under rigid support condition. In area B, D, F and H, the coefficient η is generally larger than zero, which means the bearing deformation of driving gear bearings is larger than the one under rigid support condition. Furthermore, the deformation of driving gear bearings in the range as shown in area D is much larger than the corresponding one under rigid support condition as the coefficient η is much larger than zero. In area C, E and G, the coefficient η is less than zero, which means the bearing deformation under flexible support condition in these areas is smaller than the one under rigid support condition.
In short, it is obvious that the coefficient η is generally greater than zero, which means the maximum deformation of the driving gear bearings under the flexible support is generally greater than the one under rigid support.
4. Conclusions
A lumped parameter dynamic model considering the flexibility of the support of the gearbox is proposed in this study. The nonlinear equations of motion are obtained via Lagrange’s equation. The New-Mark method is adopted to investigate the nonlinear behavior of gear transmission system. The effects of rotating speed and support stiffness of gearbox are considering to be analyzed. The numerical simulation shows that the flexible support of the gearbox significantly changes the amplitude-frequency response curve of the gear transmission system at low rotating speed. The response shows flexibility while the support stiffness is smaller than the bearings and rigidity while the support stiffness is larger than the bearings. The maximum deformation of the driving gear bearings under the flexible support is generally greater than the one under rigid support.
References
-
Özgüven H. N., Houser D. R. Mathematical models used in gear dynamics – a review. Journal of Sound and Vibration, Vol. 121, Issue 3, 1988, p. 383-411.
-
Wang J., Li R., Peng X. Survey of nonlinear vibration of gear transmission systems. Applied Mechanics Reviews, Vol. 121, Issue 3, 1988, p. 383-411.
-
Kahraman A., Singh R. Interactions between time-varying meshing stiffness and clearance non-linearities in a geared system. Journal of Sound and Vibration, Vol. 146, Issue 1, 1991, p. 135-156.
-
Kahraman A., Singh R. Non-linear dynamics of a spur gear pair. Journal of Sound and Vibration, Vol. 142, Issue 1, 1990, p. 49-75.
-
Kahraman A., Singh R. Non-linear dynamics of a geared rotor-bearing system with multiple clearances. Journal of Sound and Vibration, Vol. 144, Issue 3, 1991, p. 469-506.
-
Shen Y., Yang S., Liu X. Nonlinear dynamics of a spur gear pair with time-varying stiffness and backlash based on incremental harmonic balance method. International Journal of Mechanical Sciences, Vol. 48, Issue 11, 2006, p. 1256-1263.
-
Walha L., Fakhfakh T., Haddar M. Nonlinear dynamics of a two-stage gear system with meshing stiffness fluctuation, bearing flexibility and backlash. Mechanism and Machine Theory, Vol. 44, Issue 5, 2009, p. 1058-1069.
-
Siyu C., Jinyuan T., Caiwang L., Qibo W. Nonlinear dynamic characteristics of geared rotor bearing systems with dynamic backlash and friction. Mechanism and Machine Theory, Vol. 46, Issue 6, 2011, p. 466-478.
-
Li Y., Chen X., Wang X. Non-linear dynamics of gear pair with dynamic backlash subjected to combined internal and external periodic excitations. Journal of Vibration and Control, Vol. 8, Issue 6, 2014, p. 1-11.
-
Benedict G. H., Kelley B. W. Instantaneous coefficients of gear tooth friction. ASLE Transactions, Vol. 4, Issue 1, 1961, p. 59-70.
-
Howard I., Jia S., Wang J. The dynamic modelling of a spur gear in meshing including friction and a crack. Mechanical Systems and Signal Processing, Vol. 15, Issue 5, 2001, p. 831-853.
-
Li S., Kahraman A. A tribo-dynamic model of a spur gear pair. Journal of Sound and Vibration, Vol. 332, Issue 20, 2013, p. 4963-4978.
-
Ghosh S. S., Chakraborty G. Parametric instability of a multi-degree-of-freedom spur gear system with friction. Journal of Sound and Vibration, Vol. 332, 2015, p. 236-253.
-
Zhou S., Song G., Sun M., et al. Nonlinear dynamic response analysis on gear-rotor-bearing transmission system. Journal of Vibration and Control, 2016, https://doi.org/10.1177/1077546316667178.
-
Mohammed O. D., Rantatalo M., Aidanpää J. O., et al. Vibration signal analysis for gear fault diagnosis with various crack progression scenarios. Mechanical Systems and Signal Processing, Vol. 41, Issue 1, 2013, p. 176-195.
-
Mohammed O. D., Rantatalo M., Aidanpää J. O. Dynamic modelling of a one-stage spur gear system and vibration-based tooth crack detection analysis. Mechanical Systems and Signal Processing, Vol. 54, 2015, p. 293-305.
-
Pandya Y., Parey A. Simulation of crack propagation in spur gear tooth for different gear parameter and its influence on meshing stiffness. Engineering Failure Analysis, Vol. 30, 2013, p. 124-137.
-
Wu S., Zuo M. J., Parey A. Simulation of spur gear dynamics and estimation of fault growth. Journal of Sound and Vibration, Vol. 317, Issue 3, 2008, p. 608-624.
-
Ma H., Pang X., Zeng J., et al. Effects of gear crack propagation paths on vibration responses of the perforated gear system. Mechanical Systems and Signal Processing, Vol. 62, 2015, p. 113-128.
-
Chaari F., Fakhfakh T., Haddar M. Analytical modelling of spur gear tooth crack and influence on gear meshing stiffness. European Journal of Mechanics-A/Solids, Vol. 28, Issue 3, 2009, p. 461-468.
-
Ma H., Song R., Pang X., et al. Time-varying meshing stiffness calculation of cracked spur gears. Engineering Failure Analysis, Vol. 44, 2014, p. 179-194.
-
Raghuwanshi N. K., Parey A. Effect of back-side contact on meshing stiffness of spur gear pair by finite element method. Procedia Engineering, Vol. 173, 2017, p. 1538-1543.
-
Pandya Y., Parey A. Experimental investigation of spur gear tooth meshing stiffness in the presence of crack using photoelasticity technique. Engineering Failure Analysis, Vol. 34, 2013, p. 488-500.
-
Raghuwanshi N. K., Parey A. Experimental measurement of gear meshing stiffness of cracked spur gear by strain gauge technique. Measurement, Vol. 86, 2016, p. 266-275.
-
Liu J., Wang S., Zhou S., et al. Nonlinear behavior of a spur gear pair transmission system with backlash. Journal of Vibroengineering, Vol. 16, Issue 8, 2014, p. 3922-3938.
Cited by
About this article
The authors would like to gratefully acknowledge the National Natural Science Foundation of China (Grant No. 51675350 and 51575361), and the Natural Science Foundation of Liao-Ning (201602544) for the financial support for this study.

