Abstract
Currently, those reported researches conducted optimal design for the wheel only in order to reduce the tread wear and increase the service life, but they did not consider the wheel vibration and radiation noise which seriously influence people’s life and did not achieve obvious noise reduction effects. Aiming at this question, a multi-body dynamic model of the high-speed train was established, and the vertical and radial force was extracted to input into the finite element model of the wheel to compute its vibration characteristics. Then, the wheel was conducted on a multi-objective optimization based on particle swarm optimization improved by genetic algorithm (PSO-GA) method. Finally, the optimized vibration results were mapped to the acoustic element model to compute the radiation noise of the wheel. The computational model was also validated by experimental test. In order to observe the optimized effect, the optimized results were compared with those of the traditional GA and PSO method. Solutions of the traditional GA and PSO method were relatively dispersed during iterations and the algorithm could easily fall into the locally optimal solution. The optimized results of PSO-GA method were obviously better. Compared with the original wheel, the vibration acceleration was reduced by 22.9 %, and the mass was reduced by 1.1 %. Finally, the optimized vibration was mapped to the boundary element model to compute the radiation noise of the wheel, and the computational results were compared with the original wheel. Radiation noises of the original wheel were obviously more than that of the optimized wheel, and there were a lot of obvious peak noises in the original wheel. Radiation noises of the optimized wheel only had two obvious noise peaks in the analyzed frequency. Therefore, a wheel with low noises and lightweight was achieved in this paper.
1. Introduction
Railway noises mainly includes traction noises, wheel-rail noises, aerodynamic noises and noises from other aspects. Related researches show that the wheel-rail noise plays an important role when a train speed is running at the speed of 250 km/h-300 km/h [1]. Based on generation mechanisms, wheel-rail noises are divided into rolling noises, impact noises and squeal noises. With the development of joint less tracks as well as continuous deepening of small-radius curve transformation and steel rail grinding, impact noises and squeal noises of wheel-rails are controlled effectively, so the rolling noise is the main noise source. Therefore, it is very necessary to conduct a systematic research on rolling noises of the wheel-rail.
Currently, regarding the basic research of the vibration and noise of the wheel, a lot of studied achievements have been obtained. Thompson conducted a typical spectral analysis on wheel-rail noises. Analyzed results show that in the wheel-rail rolling noise, noises caused by sleepers are mainly concentrated below 500 Hz, noises caused by steel rails are concentrated within 500 Hz-1500 Hz, and noises caused by wheels are concentrated over 1500 Hz [2]. Han systematically compared sound radiation characteristics of different wheels to study impacts of different parameters on sound radiation of wheels [3]. Fang mainly studied impacts of the train speed on wheel rolling noises through combining finite element method with boundary element method, but the computational model only took into account the radial acting force between wheels and rails and neglected the vertical force [4]. With standard wheels of a high-speed train as an example, Luo used the boundary element method to compute wheel rolling noises of a single wheel under a unit vertical force, but the applied force only considered the vertical force, and the unit force did not meet actual situations [5]. To reduce the wheel rolling noise, one effective measure is to conduct sound source control in order to reduce noises when the train is running on rails, where ideal effects can be obtained through design, research and manufacture of low-noise wheels [2]. Regarding the wheel optimization, Shevtsov proposed a wheel profile design method based on a rolling circle radius function, and solved optimization problems by a response surface fitting multi-point approximation method [6]. Without taking into account the opposite-side rolling angles, Shen designed an independent wheel profile of a low-floor light rail vehicle by the method of back-inferring wheel profile based on steel rail contact angles [7, 8]. Ding made valuable attempts to design lorry wheel profiles based on a steel rail profile extension method [9]. Persson applied genetic algorithm in tread optimization and made a lot of researches on wheel tread and rail head shape optimization [10, 11].
These reported researches conducted optimal design only in order to reduce wheel tread wear and increase wheel service life, but failed to consider the wheel radiation noise which seriously influences people’s life and failed to achieve obvious noise reduction effects. It is thus clear that it is very necessary to study sound radiation characteristics of train wheels, design low-noise wheels using a suitable optimization algorithm. Regarding many reported optimization algorithms, the particle swarm algorithm is an intelligent evolution algorithm based on independent learning and social learning. It is advantageous in that: the algorithm conducts population search based on experience learning and has a memory function; with high universality, it does not depend on problem information, has high search efficiency and a simple theory foundation, and can be achieved easily. Of course, it is deficient in some aspects. For example: Global learning ability of particles is week, so it can easily fall into locally optimal solution; algorithm performance depends on parameters, and specific theoretical guidance is insufficient. Regarding these deficiencies, different scholars improved the PSO algorithm. GA emphasizes natural optimization search, and GA is advantageous in search solution. Aiming at deficiencies of the PSO algorithm, the paper proposes a search algorithm based on interactive learning of particle swarm algorithm and genetic algorithm (PSO-GA). The algorithm is a type of hybrid strategies. Based on combined application of genetic algorithm and particle swarm algorithm, the search strategy of interactive learning is used to prevent the algorithm from falling into the local extreme points too early during the optimal solution search, so that the globally optimal solution can be obtained.
In order to reduce the vibration and noise of the wheel, the paper firstly set up a wheel-rail dynamic model using SIMPACK, extracted vertical and radial force which acted on train wheels and applied the force in a wheel finite element model to compute vibration responses. Then, the proposed PSO-GA was used to conduct a multi-objective optimization of wheels, which reduced vibration characteristics obviously. Finally, vibration responses of the optimized wheel were input into an acoustic boundary element model as the excitation, so rolling radiation noises of wheels was computed. Then, the computational result was compared with those of original wheels. The comparison result reflected the noise reduction effect is very obvious.
2. Establishment and experimental verification of the finite element model
2.1. Establishment of the finite element model
The paper takes damped wheels of a high-speed train as an example. Co-node processing was conducted to the damping layer and the wheel surface. Sizes of different parts of wheels are as follows: outer diameter of wheels is 800 mm; inner diameter of wheels is 710 mm; axle hole diameter is 156 mm; hub thickness is 85 mm; tread width is 140 mm; thickness of disc is 25 mm. A three-dimensional model of the wheel was established, as shown in Fig. 1(a). Thompson [12] analyzed free vibration of wheels by the finite element method based on comparison between computational results and experimental results of free vibration. The computational error is less than 4 % below 3000 Hz, and the computational accuracy is high. Therefore, the paper also studied vibration responses of wheels using the finite element method. The three-dimensional model of the wheel was input into ANSYS, so a finite element model was established, as shown in Fig. 1(b). A 3D model needed to be established, so an 8-node hexahedral element was selected. The wheel model was relatively small, so meshes with proper density were divided and a finite element model of the wheel was obtained. Finally, the finite element model of wheels contained 25087 elements and 34890 nodes. The parameters of the wheel material are as follows: elasticity modulus is 220 GPa, Poisson’s ratio is 0.3, and density is 7800 kg/m3. Damping of the actual wheel material is very small and only has very small impacts on its natural frequency and mode, so material damping was not considered in the computation. The Lanczos method was used to compute the natural frequency and mode of the wheel within 0 Hz-3000 Hz, as shown in Fig. 2.
Fig. 1Geometric model and finite element model of the wheel
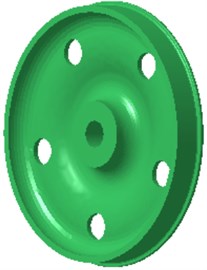
a) Geometric model
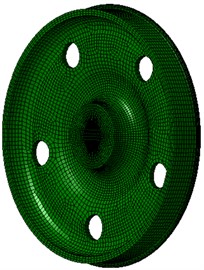
b) Finite element model
Wheel noises are closely correlated with its excited resonance modes. Wheel modes are similar with disc modes. In non-planar space, the vibration can be classified into two types: pitch diameter vibration and pitch circle vibration. The so-called pitch diameter means that displacement of one diameter or multiple diameters of a round plate passing the round center is kept at 0 during vibration. Pitch circle means that displacement of one or more than one circles of the round plate which are concentric with the boundary circle is kept at 0. Therefore, non-planar vibration can be described by 2 parameters (m, n), where m is the amount of pitch circles, and n is the amount of pitch diameters. The amount n of pitch diameters reflects characteristics of the vibration amplitude distribution along the perimeter direction, while the amount m of pitch circles reflects characteristics of the vibration amplitude distribution along the radius direction. Axle is not considered in the computational model, where fixed constraints are applied on inner boundaries of the hub hole to simulate constraint effects of the axle. This method can effectively predict all the mode of wheels. Errors are only involved for the mode with 0 pitch diameter and 1 pitch diameter, because these wheel modes have strong coupling effects with axle bending vibration modes, but these modes have high mode damping and do not have obvious impacts on vibration and sound radiation. It is shown in modes of Fig. 2 that the wheel vibration is mainly reflected by bending vibration of the tread and the vertical vibration of disc, and there are a lot of pitch diameter vibration and pitch circle vibration.
2.2. Experimental verification of the finite element model
Numerical computation models are obviously affected by boundary conditions and mesh sizes, so it is very necessary to verify the accuracy of computational models through experimental test. At present, modes of a structure are tested by a pulse hammering method in general. A transfer function with applying a pulse hammering method generally requires the following equipment: exciting hammer, piezoelectric sensor, charge amplifier, filter, signal collection equipment and computer, etc. In addition, matched wires and data lines are also needed. In the experiment, the adopted equipment involves testing equipment, and excitation system including an exciting hammer and a force sensor, as shown in Fig. 3(a).
Fig. 2Natural frequencies and modes of the wheel
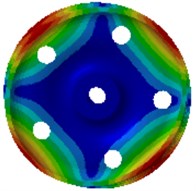
a) 255.1 Hz

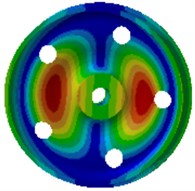
b) 579.4 Hz

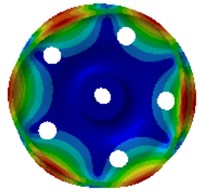
c) 688.8 Hz

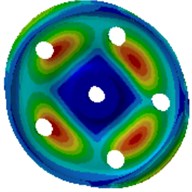
d) 1232.7 Hz

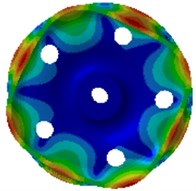
e) 1282.7 Hz

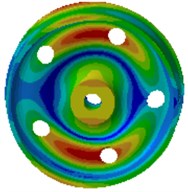
f) 1445.4 Hz

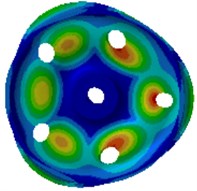
g) 1656.3 Hz

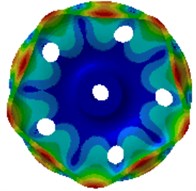
h) 1960.1 Hz

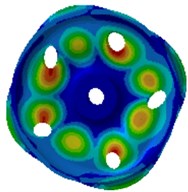
i) 2217.9 Hz

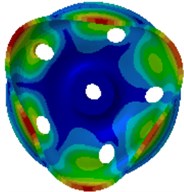
j) 2419.6 Hz

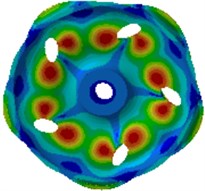
k) 2670.7 Hz

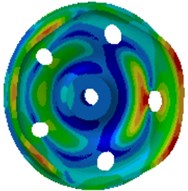
l) 2682.8 Hz

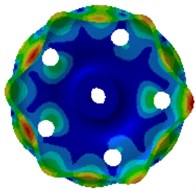
m) 2718.4 Hz

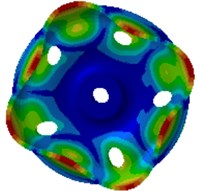
n) 2873.9 Hz

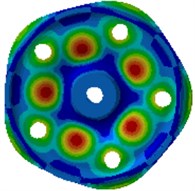
o) 2999.6 Hz

In numerical simulation, the wheel hub is fixed by constraints, so the wheel hub was fixed and then its constraint mode can be tested. Excitation types include single-point excitation and multi-point excitation. Multi-point excitation has a high accuracy, but single-point excitation can also obtain a high accuracy as for rigid components such as wheels. In the experiment, the hammering method was used to conduct single-point excitation of rim and tread respectively. The data collection equipment shown in Fig. 3(b) was used to collect the wheel transfer functions of the experiment. The functions were input into a Pulse data analyzer. Experimental data was processed, and mode frequencies were obtained. Experimental results were compared with numerical simulation, as shown in Table 1. It is shown in Table 1 that the error between numerical simulation and experimental test is less than 3.2 %, which indicates the computational accuracy is very high. The error between numerical simulation and experimental test is very small because of the following reasons. We modified related parameters and element connection of the finite element model repeatedly according to boundary conditions and models of the experimental test. We also conducted an experimental test on the damping coefficient of wheels and input it into the finite element model. 8-node hexahedral elements with high accuracy were adopted. In order to increase the accuracy of the analyzed model, meshes with proper density were divided. In addition, when the analyzed frequency was high, mode frequency distribution of wheels was very dense. All mode frequencies of wheels can be obtained through the finite element simulation. Therefore, values which fairly approached the experimental mode frequency can be found easily for comparison. As a result, the error between numerical simulation and experimental test is very small.
Fig. 3Testing equipment of experimental modes
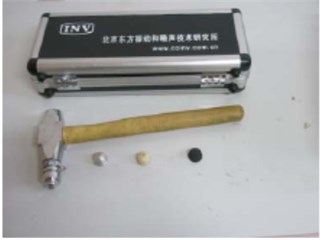
a) Exciting hammer
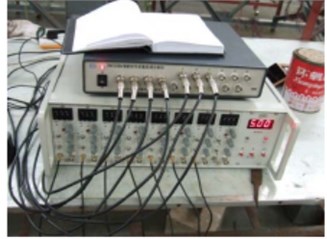
b) Data collection equipment
Table 1Comparison of natural frequencies between experiment and simulation
Order | Experimental results / Hz | Computational results / Hz | Relative error / % |
1 | 247.2 | 255.1 | 3.2 |
2 | 575.3 | 579.4 | 0.7 |
3 | 699.3 | 688.8 | –1.5 |
4 | 1226.4 | 1232.7 | 0.5 |
5 | 1288.1 | 1282.7 | –0.4 |
6 | 1439.0 | 1445.4 | 0.4 |
7 | 1647.5 | 1656.3 | 0.5 |
8 | 1969.2 | 1960.1 | –0.5 |
9 | 2223.9 | 2217.9 | –0.3 |
10 | 2410.8 | 2419.6 | 0.4 |
11 | 2665.6 | 2670.7 | 0.2 |
12 | 2688.2 | 2682.8 | –0.2 |
13 | 2714.5 | 2718.4 | 0.1 |
14 | 2878.1 | 2873.9 | –0.2 |
15 | 3002.3 | 2999.6 | –0.1 |
3. Numerical computation of vibration characteristics of wheels
To compute the wheel vibration, excitation forces of the wheel shall be obtained at first. The excitation force obtained by the theoretical computation is not very accurate. Therefore, the paper established a multi-body dynamic model in SIMPACK to extract vertical and radial forces of the wheel.
3.1. Multi-body dynamic model
SIMPACK is advantageous in that it has abundant track train modeling units; a user can easily achieve intelligence, sub-structure form and parameterization in order to establish a track train model rapidly and conveniently. A high-speed train is deemed as a multi-rigid body system including 1 body, 2 bogie frameworks and 4 wheel sets. The body is connected with bogies by secondary suspension, and bogie frameworks are connected with axle boxes by first suspension. The multi-body dynamic model of the high-speed train was established according to following processes: after necessary parameters of the high-speed train were obtained, the train system was simplified by rational hypotheses firstly. Front and rear bogies of the same train body are completely the same in structures and parameters and are symmetric relative to the train body center; components in the train system, such as bogie framework, wheel sets and body are deemed as rigid bodies, and their elastic deformation is not considered; only irregular turbulence of steel rails is considered, but their elastic deformation is not considered. Attributes of each rigid body, three-dimensional geometric shape data of the structure, as well as determination of hinged connection, and applying of force elements and sensors were defined. The steel rail was deemed as a continuous elastic foundation beam, and the standard Chinese steel rail of 60 kg/m was adopted. Standard LMA-type tread was selected for the wheel tread model as the train body with LMA-type tread has high stationarity and the vertical stationarity of the train is better than the horizontal stationarity. The Fastsim algorithm was used to compute the creep force. Vertical rigidity of first spring is 1260000 N/m; horizontal rigidity of first spring is 6500000 N/m; longitudinal rigidity of first spring is 10000000 N/m; first vertical damping coefficient is 10626 N.s/m; vertical rigidity of axle box positioning is 3267000 N/m; horizontal rigidity of axle box positioning is 6500000 N/m; vertical rigidity of secondary spring is 176400 N/m; horizontal rigidity of secondary spring is 166600 N/m; overall rigidity of secondary spring is 166600 N/m; secondary vertical damping coefficient is 40000 N.s/m; damping coefficient of anti-snake damper is 2500000 N/m; train body mass is 506504 kg; nodding rotation inertia is 528628 kg/m2; lateral rolling rotation inertia is 33832 kg/m2; head shaking rotation inertia is 506504 kg/m2. According to basic parameters of the train, modeling of the train can be conducted using SIMPACK software. A complete train model was established through establishment of environment, establishment of wheel sets, initialization of track, overall parameters of trains, component establishment, first suspension, secondary suspension, horizontal damper, vehicle body establishment, longitudinal traction spring and torsion rod spring, as shown in Fig. 4. The rail irregularity spectrum in Fig. 5 was input into the UM post-processing program, namely UM Simulation. Simulation computation was conducted combining with the established model.
Fig. 4Multi-body dynamic model of the high-speed train

Fig. 5Irregularity spectrums of the high speed train
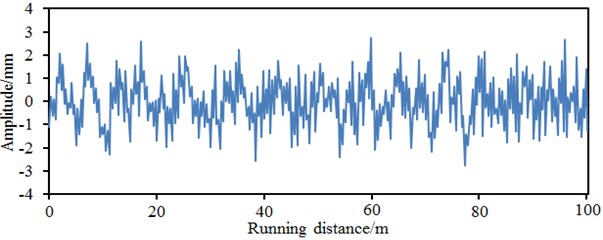
a) Horizontal irregularity in the left side
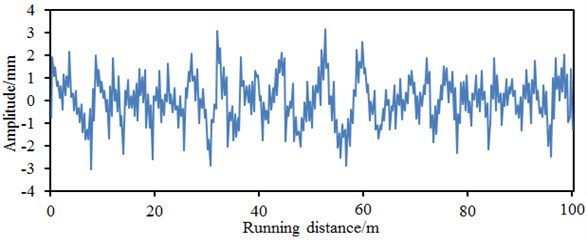
b) Vertical irregularity in the left side
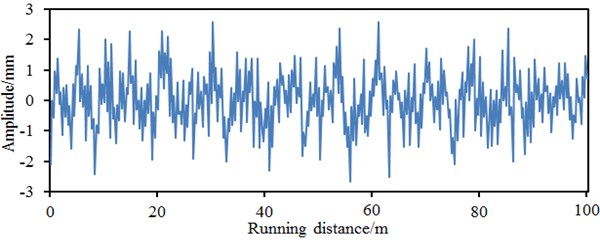
c) Horizontal irregularity in the right side
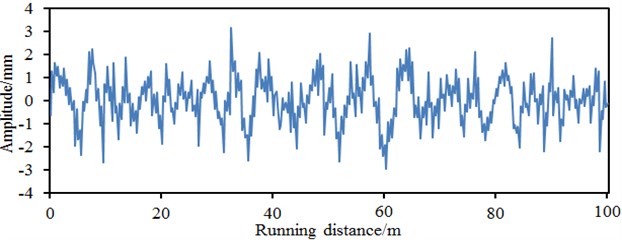
d) Vertical irregularity in the right side
The position of the vertical and radial force of the wheel was marked in Fig. 6. Vertical and radial forces of the wheel were computed based on the multi-body dynamic model, as shown in Fig. 7. It is shown in the figure that the maximum amplitude of the radial force is 101000 N, while the maximum amplitude of the vertical force is 12000 N. The radial force is obviously more than the vertical force. However, the vertical force cannot be neglected. Otherwise, the accuracy of the computational results will be reduced. The excitation force was input into the wheel finite element model as described in the second section, so vibration responses of the wheel can be computed.
Fig. 6Boundary condition of the fixed wheel
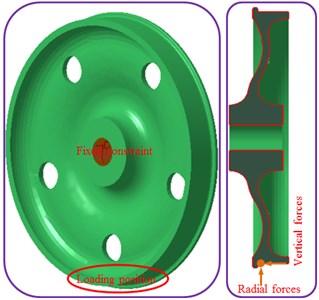
Fig. 7Vertical and radial excitation forces
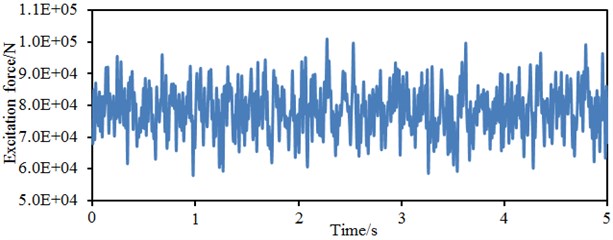
a) Radial excitation forces
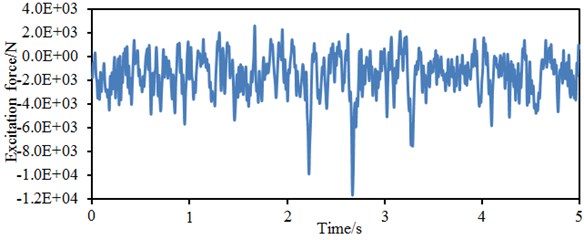
b) Vertical excitation forces
3.2. Vibration responses of wheels
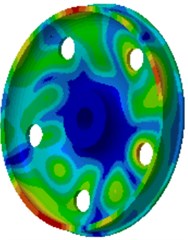
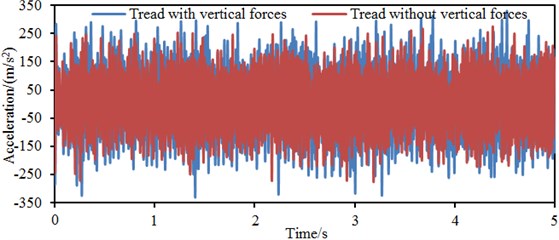
Contours of vibration accelerations of the wheel under vertical and radial forces were extracted, as shown in Fig. 8. It is shown in the figure that the wheel tread has the maximum vibration responses. In order to further study vibration acceleration responses at different parts of the wheel, vibration acceleration responses at the wheel tread, rim and disc were extracted, as shown in Fig. 9. Additionally, in order to highlight the impacts of the vertical force on the computational result, vibration acceleration responses of the wheel without the vertical force were also computed and extracted in Fig. 9. Fig. 9(a) represents the vibration acceleration response of the wheel tread. It is shown in the figure that the vibration acceleration fluctuates around 0. The maximum vibration acceleration is 338.2 m/s2, while the minimum vibration acceleration is –340.1 m/s2 when the vertical force is considered. The maximum vibration acceleration is 288.3 m/s2, while the minimum vibration acceleration is –290.3 m/s2 when the vertical force is not considered.
Fig. 8Vibration acceleration responses of wheels
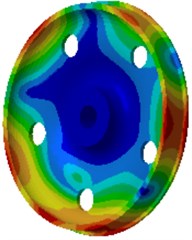
a) 100 Hz
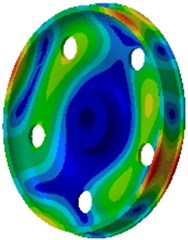
b) 1000 Hz
c) 2000 Hz
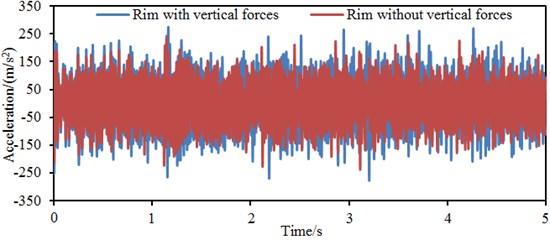
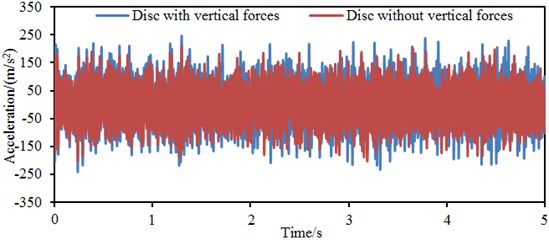
Fig. 9Vibration accelerations at different parts of wheels
a) Tread
b) Rim
c) Disc
Fig. 9(b) represents the vibration acceleration response of the wheel rim. It is shown in the figure that the maximum vibration acceleration is 276.3 m/s2, equal to 81.7 % of the maximum vibration acceleration of the tread, while the minimum vibration acceleration is –289.2 m/s2, equal to 85.0 % of the minimum vibration acceleration of the tread when the vertical force is considered. The maximum vibration acceleration is 243.1 m/s2, while the minimum vibration acceleration is –260.4 m/s2 when the vertical force is not considered. Fig. 9(c) represents the vibration acceleration response curve of the wheel disc. It is shown in the figure that the maximum vibration acceleration is 235.6 m/s2, equal to 69.7 % of the maximum vibration acceleration of the wheel tread, while the minimum vibration acceleration is –245.2 m/s2, equal to 72.1 % of the minimum vibration acceleration of the tread when the vertical force is considered. The maximum vibration acceleration is 211.2 m/s2, while the minimum vibration acceleration is –235.4 m/s2 when the vertical force is not considered. Obviously, the vibration of the wheel disc is relatively the smallest because the disc is not a direct acting position of excitation forces. Instead, the disc vibration is generated from indirect propagation of tread vibration, and the vibration is transformed by structural damping attenuation into thermal energy dissipation during the vibration propagation. The wheel tread is the direct acting position of excitation forces, so the relatively most obvious vibration responses appeared there. Additionally, the vibration response without considering the vertical force is obviously less than that with considering the vertical force. Therefore, the vertical force should not be neglected when the vibration response of the wheel is computed.
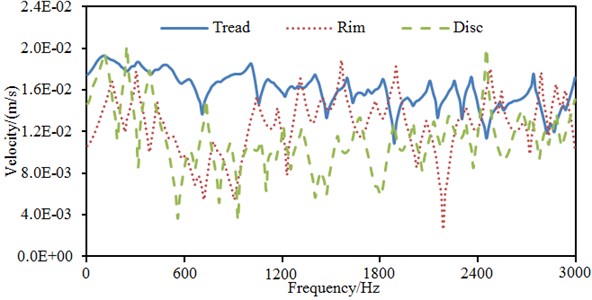
Fig. 9 shows time-domain vibration acceleration responses at different parts of wheels, but time-domain results can not reflect dynamic characteristics of structures comprehensively. Therefore, time-domain vibration accelerations were processed, and frequency-domain vibration velocities were obtained, as shown in Fig. 10. It is shown in the figure that a lot of obvious peak values and valley values are on the vibration velocity curve of wheels. Most of them are caused by structural resonances. Vibration velocities of the tread are obviously more than those of the rim and disc, which is consistent with time-domain results. In addition, vibration velocities of the disc are not completely lower than those of the rim and tread within the analyzed frequency domain. At low and high frequency bands, the vibration velocities of the disc are more than those of the rim and tread.
Fig. 10Vibration velocities at different parts of wheels
4. Numerical optimization of vibration characteristics of wheels
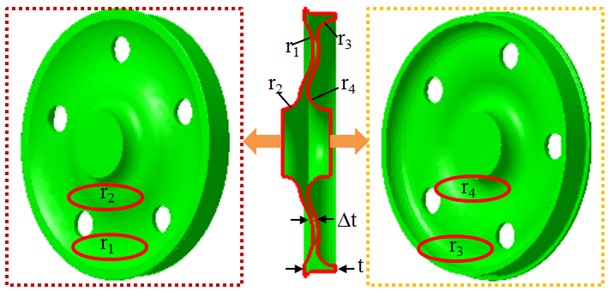
A wheel is designed completely according to related standards, so parameters which can be modified during the optimal design are limited. Parameters which can be modified include, connecting radius between rim and disc, connecting radius between disc and hub, thickness of the wheel disc, wheel radius, inner side thickness of the tread, outer side thickness of the hub and so forth, as shown in Fig. 11. In the paper, the wheel rim thickness is t; the wheel disc thickness variation is Δt; the radius of the disc and rim at the wheel inner side is r1; the radius of the disc and hub at the wheel inner side is r2; the radius of the disc and rim at the wheel outer side is r3; the radius of the disc and hub at the wheel outer side is r4. According to related standards, these design parameters shall not vary seriously during the optimal design, otherwise obvious impacts on strength of the optimized wheel will be caused. Parameters: 60mm≤t≤68mm, –4 mm ≤Δt≤4mm, 45mm≤r1≤52mm, 60mm≤r2≤66mm, 55mm≤r3≤62mm and 55mm≤r4≤62mm. During the optimal design, each order of mode frequency Modei,optimized of the wheel shall be constrained, and it should be more than the mode frequency Modei,original of the original wheel. Optimal design aims to ensure that the average vibration acceleration awheel of each wheel part and the wheel mass mwheel are the minimum. Therefore, it is a multi-objective optimization problem. Related mathematical descriptions are as follows:
Fig. 11Variables in the optimal design of wheels
Among many optimization algorithms, the particle swarm algorithm is an intelligent evolution algorithm based on independent learning and social learning. It is advantageous in that: the algorithm conducts population search based on experience learning and has a memory function; with high universality, it does not depend on problem information, has high search efficiency and a simple theory foundation, and can be achieved easily. Of course, it is deficient in some aspects. For example: Global learning ability of particles is week, so it can easily fall into locally optimal solution; algorithm performance depends on parameters, and specific theoretical guidance is insufficient. Regarding these deficiencies, different scholars improved the basic PSO algorithm, mainly including improvements based on position and velocity update strategies [13-17]; improvements based on multi-population strategies [18-21]; improvements based on topology strategies [22-25]; improvements based on hybrid particle swarm and other algorithms [27-32]; improvements based on biologic behavior strategies [32-36].
Both PSO and GA are search algorithms. PSO emphasizes comparison process search and GA emphasizes natural optimization search. Therefore, PSO is advantageous in search time, and GA is advantageous in search solution. Aiming at deficiencies of the PSO algorithm, the paper proposes a search algorithm based on interactive learning of particle swarm algorithm and genetic algorithm. The algorithm is a type of hybrid strategies. Based on combined application of genetic algorithm and particle swarm algorithm, the search strategy of interactive learning is used to prevent the algorithm from falling into the local extreme points too early during the optimal solution search, so that the globally optimal solution can be obtained. It is called as PSO-GA method. Specific process of the PSO-GA method is shown in Fig. 12.
Step 1) Parameters in the algorithm are determined, such as variation probability, population size, inertia weight, learning factor, particle dimension and selection probability.
Step 2) Velocity and position of particles are initialized randomly according to the initial search interval.
Step 3) Fitness value of particles is computed, and individual values of the optimal particle and global values are determined.
Step 4) Amount of particle iterations is added, and whether the amount of iteration generations is an even number or an odd number is judged.
Step 5) If the amount of iteration generations is an even number, position and velocity of the particles will be updated by genetic algorithm.
Step 6) If the amount of iteration generations is an odd number, position and velocity of the particles will be updated by the particle swarm algorithm.
Step 7) Aggregation degree of particles is computed. Mutation processing is conducted to some particles.
Step 8) The evaluation function is then judged. Individual and global values of the particles can be determined.
Step 9) Whether the amount of iterations satisfies requirements is determined. Step 8 will be started if the amount satisfies requirements, otherwise Step 4 will be started.
Step 10) Globally optimal position and solution of the optimal particle is output.
Through combining PSO-GA method with finite element software ABAQUS, structural optimization of the wheel can be achieved. UMAT sub-program is called by the main program of the PSO-GA method, so operations including finite element model and results can be conducted according to design variables. ABAQUS software is programmed based on Python language, so all the operations in CAE can be completed through compiling of Python script commands in the UMAT sub-program. In this way, parametric modeling and data extraction can be achieved. The compiled script documents are submitted to execution process of ABAQUS: the equipped Python interpreter of ABAQUS interprets script language; ABAQUS kernel is called to execute script commands, generate an “inp” input document and summit the document to an analyzer for finite element analysis. Finally, a result document is generated. Because of the small particle population, solution space can be fully explored, and excessive time spent on assessment and computation of adaptation values is avoided. In general, the amount of 20-40 is selected. As for most problems, 10 particles are enough to achieve good results. Regarding difficult problems or specific types of problems, the amount of particles could be 100 or 200. The learning factor is 2. The inertia weight controls effects of a previous velocity variable quantity on the current variable quantity. The larger inertia weight means larger effects, so regions which are not reached before they can be searched, the global search ability of the complete algorithm is strengthened and local minimum point can be avoided easily. The small inertia weight means that effects of the previous momentum are small, where search is conducted mainly around the current solution; the local search ability is strong; and algorithm convergence can be achieved easily. The research indicates that good effects can be achieved when the inertia weight gradually decreased from 1.4 to 0 with increase of the number of iterations. As for the genetic algorithm, population size is 60; number of evolution generations is 800; crossover probability is 0.8; mutation probability is 0.2.
This optimization algorithm was used to conduct a multi-objective optimization of wheels, and the obtained results were compared with the traditional genetic algorithm and particle swarm optimization algorithm, as shown in Fig. 12 and Fig. 13. Fig. 13 shows iteration processes with errors of three kinds of algorithms. It is shown in the figure that the genetic algorithm converged to the set target error when the amount of iterations reached 750, the particle swarm optimization algorithm converged to the set target error when the amount of iterations reached 450, while the PSO-GA method converged to the set target error when the amount of iteration reached 260. The traditional genetic algorithm and particle swarm optimization algorithm can easily fall into local extreme values during iterations. This result fully verifies the obvious advantages of the optimization algorithm proposed in this paper.
Fig. 12Optimization processes of the PSO-GA method
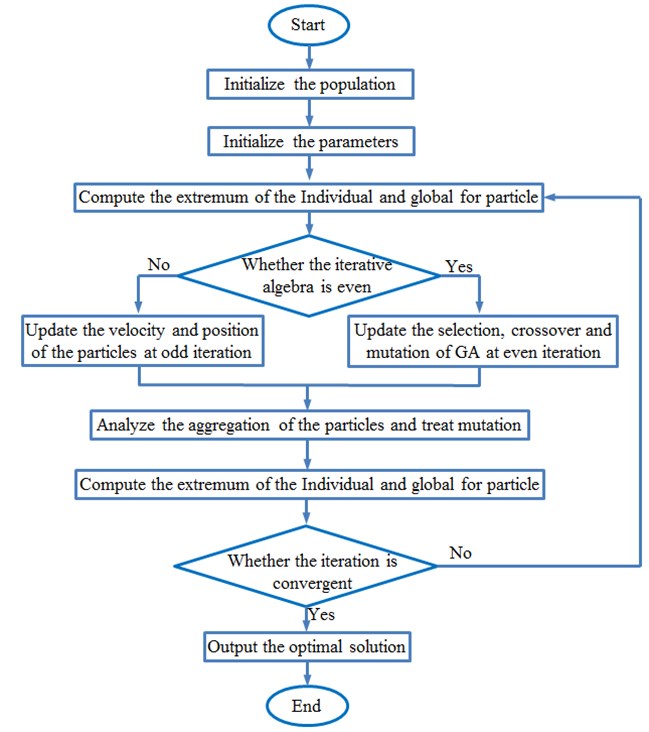
Fig. 13Iteration errors of three kinds of optimization algorithms
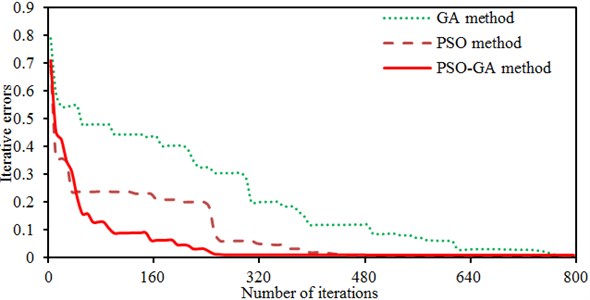
Fig. 14 shows iteration processes of three kinds of algorithms during the multi-objective optimization of the wheel. It is shown in the figure that solutions of the traditional genetic algorithm and particle swarm optimization algorithm are relatively dispersed during iterations and these two algorithms can easily fall into the locally optimal solution. On the contrary, most solutions of the PSO-GA method are concentrated.
Fig. 14Iteration processes of three kinds of optimization algorithms
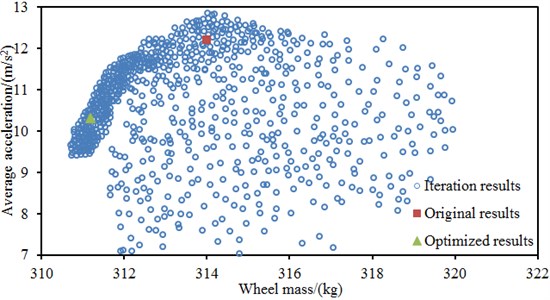
a) Traditional GA method
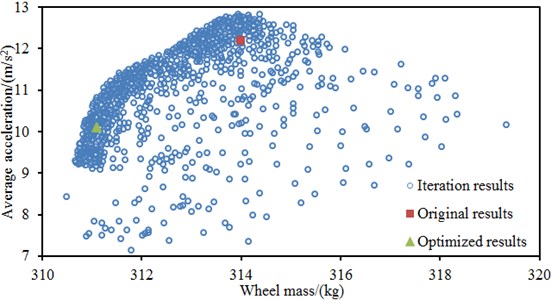
b) Traditional PSO method
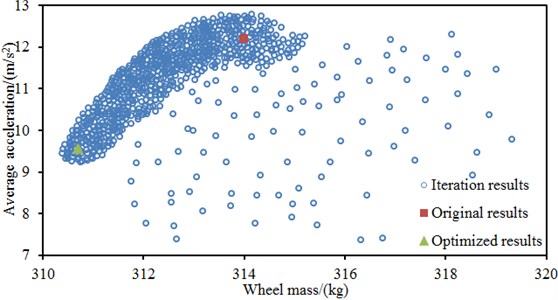
c) PSO-GA method
In addition, the average vibration acceleration of the original wheel is 12.2 m/s2, and the mass is 314 kg. Through the PSO-GA optimization, the average vibration acceleration of 9.4 m/s2 and mass of 310.6 kg are obtained. Compared with the original wheel, the vibration acceleration is reduced by 22.9 %, and the mass is reduced by 1.1 %. Through the traditional genetic algorithm optimization, the average vibration acceleration of 10.3 m/s2 and mass of 311.2 kg are obtained. Compared with the original wheel, the vibration acceleration is reduced by 15.6 % and the mass is reduced by 0.9 %. Through the traditional particle swarm optimization algorithm, the average vibration acceleration of 10.1 m/s2 and mass of 311.6 kg are obtained. Compared with the original wheel, the vibration acceleration is reduced by 17.2 % and the mass is reduced by 0.8 %. Obviously, it is very necessary to conduct a multi-objective optimization for the wheel using the PSO-GA method.
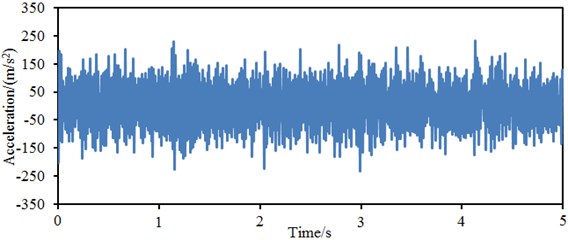
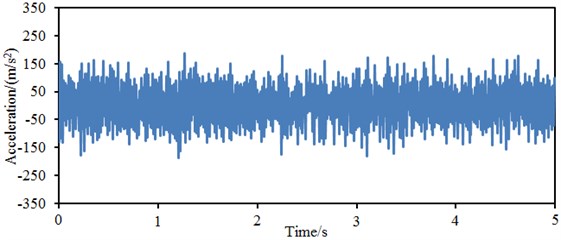
Related design parameters can be obtained after a multi-objective optimization for the wheel was completed. A geometric model of the wheel was re-established according to these parameters and input into ABAQUS for mesh division. Finally, a finite element model was established, and vibration acceleration responses at each part of the wheel were computed. Results are shown in Fig. 15.
Fig. 15Vibration accelerations at each part of the optimized wheel
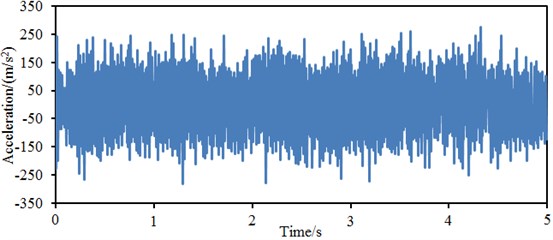
a) Tread
b) Rim
c) Disc
Fig. 15(a) represents the vibration acceleration response curve at the wheel tread. It is shown in the figure that the vibration acceleration still fluctuates obviously around 0; the maximum vibration acceleration is 267.3 m/s2, while the minimum vibration acceleration is –271.2 m/s2. Compared with the original structure, the maximum vibration acceleration is reduced by 20.9 %, and the minimum vibration acceleration is reduced by 20.2 %. Fig. 15(b) represents the vibration acceleration response curve at the wheel rim. It is shown in the figure that the maximum vibration acceleration is 239.3 m/s2, while the minimum vibration acceleration is –238.2 m/s2. Compared with the original structure, the maximum vibration acceleration is reduced by 13.4 %, and the minimum vibration acceleration is reduced by 17.6 %. Fig. 15(c) represents the vibration acceleration response curve at the wheel disc. It is shown in the figure that the maximum vibration acceleration is 221.8 m/s2, while the minimum vibration acceleration is –205.1 m/s2. Compared with the original structure, the maximum vibration acceleration is reduced by 5.8 %, and the minimum vibration acceleration is reduced by 16.4 %. It is thus clear that the vibration responses of the wheel are improved obviously.
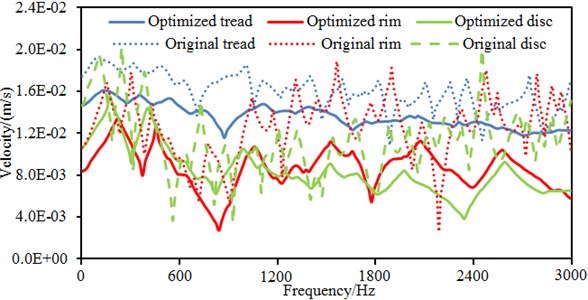
Similarly, time-domain vibration accelerations of the optimized wheel were processed, so that frequency-domain vibration velocities can be obtained and compared with the original wheel, as shown in Fig. 16. It is shown in the figure that the tread vibration velocity curve of the optimized wheel is smooth; the maximum value of vibration velocities is reduced obviously compared with the original structure. As well, vibration velocities at other parts of the wheel are improved obviously.
Fig. 16Vibration velocities at different parts of the optimized wheel
5. Numerical optimization of radiation noises of wheels
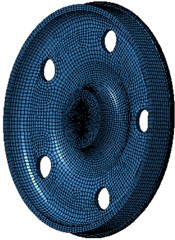
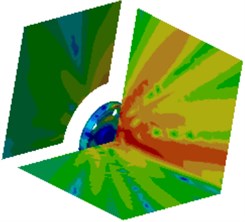
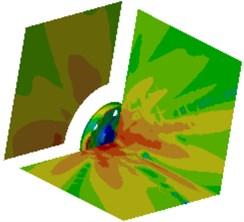
The structural vibration is the source of noises. Therefore, in order to observe effects of the improved vibration on radiation noises, the boundary element method was used to conduct a numerical computation for the radiation noise of the optimized wheel. During the numerical computation of radiation noises, extra elements were used to seal the hub hole, so that sound leak caused by the hub hole can be prevented. The boundary element model is shown in Fig. 17. Division of boundary element meshes is one of key factors which can affect the analyzed accuracy. In order to ensure the computational accuracy, there should be 6 elements at least within the minimum analysis wavelength, namely the side length of the maximum element should be smaller than 1/6 of the minimum analysis wavelength [37]. It is notable that sizes of boundary element meshes should be consistent basically, and too large or too small size should be avoided. Extra-fine division of local meshes cannot increase the computational accuracy because the computational accuracy of a fluid model is controlled by the majority of elements [38, 39]. During the computation, air density is 1.21 kg/m3 and sound velocity is 344 m/s. The computational frequency ranges within 20 Hz-3000 Hz, and the step length is 10 Hz. Density of the damping material is 1000 kg/m3, elasticity modulus is 3.4e6 Pa, Poisson’s ratio is 0.49 and the structural damping coefficient is 0.25. The vibration responses of optimized wheels were input into acoustic software, and vibration responses of the structure were mapped to boundary element meshes. In this way, the acoustic boundary meshes will obtain the structural vibration responses and structure-sound coupling can be achieved. It is set that the computational frequency is 3000 Hz, and the computational step length is 20 Hz. Finally, acoustic responses of the optimized wheel at each planar field point can be obtained, as shown in Fig. 18.
Fig. 17Boundary element model of the optimized wheel
a) Boundary element meshes
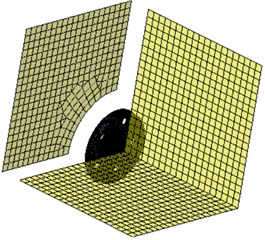
b) Boundary element field point
Fig. 18Contours of radiation noises of the optimized wheel
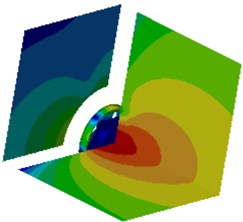
a) 100 Hz
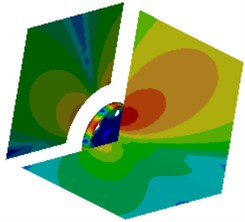
b) 500 Hz
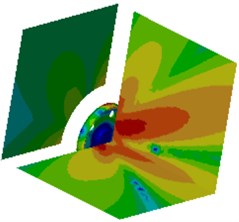
c) 1000 Hz
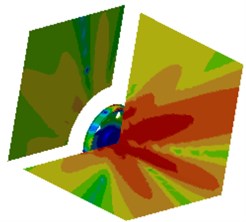
d) 1200 Hz
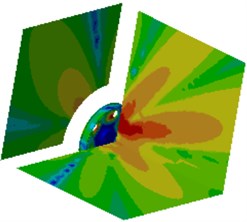
e) 1500 Hz
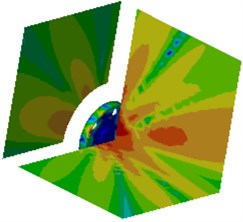
f) 1800 Hz
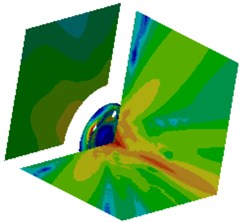
g) 2300 Hz
h) 2500 Hz
i) 3000 Hz
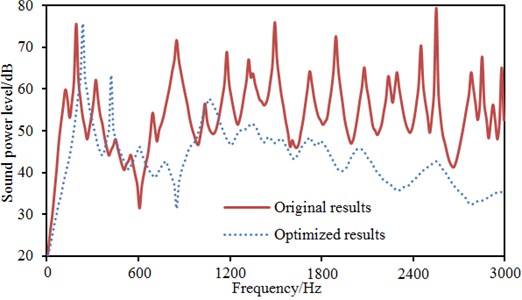
It is shown in Fig. 19 that radiation noises of the optimized wheel have an obvious directivity. Sound pressures on field point meshes parallel to the wheel plane are mainly caused by bending vibration of the wheel tread. Sound pressure responses on the field point meshes perpendicular to the wheel plane are mainly caused by the vibration of the wheel disc. In order to further observe improvements in radiation noises of the optimized wheel, the boundary element model is used to compute radiation noises of the original wheel, and results of two kinds of wheels were compared, as shown in Fig. 19. It is shown in Fig. 19 that radiation noises of the original wheel are more than those of the optimized wheel, and there are a lot of obvious peak noises. Radiation noises of the optimized wheel only have two obvious noise peaks within the low-frequency bands, which may be caused by that the boundary conditions in low-frequency have obvious impacts on the computational model and the accuracy of the computational model was low. The peak noises of the original wheel are 71.7 dB, 68.9 dB, 67.1 dB, 75.9 dB, 64.2 dB, 72.6 dB, 65.1 dB, 64.0 dB, 70.4 dB, 79.4 dB, 64.0 dB, 67.7 dB and 65.1 dB, and the corresponding frequencies are 811 Hz, 1200 Hz, 1325 Hz, 1501 Hz, 1756 Hz, 1906 Hz, 2105 Hz, 2301 Hz, 2514 Hz, 2599 Hz, 2806 Hz, 2899 Hz and 2986 Hz. The noises of the optimized wheel are 31.3 dB, 48.0 dB, 51.1 dB, 47.1 dB, 48.4 dB, 41.5 dB, 45.0 dB, 35.7 dB, 40.0 dB, 42.7 dB, 32.4 dB, 33.3 dB and 35.3 dB at the same frequency points. Therefore, the peak noises of the wheel are reduced by 56.3 %, 30.3 %, 23.8 %, 37.9 %, 24.6 %, 42.8 %, 30.8 %, 44.2 %, 43.2 %, 46.2 %, 49.4 %, 50.8 % and 45.8 %. In future researches, it is feasible to further improve the accuracy of the computational model in order to improve radiation noises of the optimized wheel in full-frequency bands.
Fig. 19Comparison of radiation noises before and after optimization
6. Conclusions
In this paper, a multi-body dynamic model of the high-speed train was established, and the vertical and radial excitation force is extracted to input into the finite element model of the wheel to compute vibration characteristics. Then, vibration characteristics of the wheel were conducted on a multi-objective optimization based on the PSO-GA method. Finally, the optimized vibration was mapped to the boundary element model to compute the radiation noise of the wheel, so the following conclusions can be achieved.
1) The error between numerical simulation and experimental test is below 3.2 %, which indicates the simulation model in this paper is reliable.
2) The maximum amplitude of the vertical force is 101000 N, while the maximum amplitude of the radial force is 12000 N. The vertical force is obviously more than the radial force. Therefore, the vertical force cannot be neglected. Otherwise, the accuracy of the computational results will be reduced.
3) Vibration acceleration response curves at the wheel tread, rim and disc are extracted. The vibration of the wheel tread is the maximum, while the vibration of the wheel disc is the minimal.
4) The wheel is conducted on a multi-objective optimization based on the PSO-GA method, and the optimized results are compared with those of the traditional GA and PSO method. Solutions of the traditional GA and PSO method are relatively dispersed during iterations and the algorithm can easily fall into the locally optimal solution. The optimized results of the PSO-GA method are obviously better. Compared with the original wheel, the vibration acceleration is reduced by 22.9 %, and the mass is reduced by 1.1 %.
5) The optimized vibration is mapped to the boundary element model to compute the radiation noise of the wheel, and the computational results are compared with the original wheel. Radiation noises of the original wheel are obviously more than those of the optimized wheel, and there are a lot of obvious peak noises in the original wheel. Radiation noises of the optimized wheel only have two obvious noise peaks in the analyzed frequency.
References
-
Thompson D. J., Jones C. J. C. A review of the modelling of wheel/rail noise generation. Journal of Sound and Vibration, Vol. 231, Issue 3, 2000, p. 519-536.
-
Thompson D. J., Gautier P. E. Review of research into wheel/rail rolling noise reduction. Proceedings of the Institution of Mechanical Engineers, Part F: Journal of Rail and Rapid Transit, Vol. 220, Issue 4, 2006, p. 385-408.
-
Han J., Xiao X. B., Jin X. S., Wang C., Fang J. Y., Zhang Y. M. Sound radiation characteristics of wheels used in urban rail traffic. Journal of Mechanical Engineering, Vol. 48, Issue 10, 2012, p. 115-121.
-
Fang J. Y., Xiao X. B., Jin X. S., Li Y. H. Effect of train speed on acoustic radiation characteristics of high-speed train wheel vibration. Journal of Mechanical Engineering, Vol. 46, Issue 22, 2010, p. 96-104.
-
Luo L., Zheng X., Lv Y., Hao Z. Y. Sound radiation characteristics of high-speed train wheel and wheel-sets. Journal of Jilin University (Engineering and Technology Edition), Vol. 46, Issue 5, 2016, p. 1464-1470.
-
Shevtsov I. Y., Markine V. L., Esveld C. Design of railway wheel profile taking into account rolling contact fatigue and wear. Wear, Vol. 265, Issue 9, 2008, p. 1273-1282.
-
Shen G., Ayasse J. B., Chollet H., et al. A unique design method for wheel profiles by considering the contact angle function. Proceedings of the Institution of Mechanical Engineers, Part F: Journal of Rail and Rapid Transit, Vol. 217, Issue 1, 2003, p. 25-30.
-
Shen G., Zhong X. A design method for wheel profiles according to the rolling radius difference function. Proceedings of the Institution of Mechanical Engineers, Part F: Journal of Rail and Rapid Transit, Vol. 225, Issue 5, 2011, p. 457-462.
-
Ding J., Li F., Huang Y., et al. Application of the semi-Hertzian method to the prediction of wheel wear in heavy haul freight car. Wear, Vol. 314, Issue 1, 2014, p. 104-110.
-
Persson I., Nilsson R., Bik U., et al. Use of a genetic algorithm to improve the rail profile on Stockholm underground. Vehicle System Dynamics, Vol. 48, Issue 1, 2010, p. 89-104.
-
Persson I., Iwnick S. D. Optimisation of railway wheel profiles using a genetic algorithm. Vehicle System Dynamics, Vol. 41, 2004, p. 517-526.
-
Thompson D. J. Wheel-rail noise generation. Part I, II, III, IV and V. Journal of Sound and Vibration, Vol. 161, Issue 3, 1993, p. 387-482.
-
Clerc M., Kennedy J. The particle swarm-explosion, stability, and convergence in a multidimensional complex space. IEEE transactions on Evolutionary Computation, Vol. 6, Issue 1, 2002, p. 58-73.
-
Ratnaweera A., Halgamuge S. K., Watson H. C. Self-organizing hierarchical particle swarm optimizer with time-varying acceleration coefficients. IEEE Transactions on Evolutionary Computation, Vol. 8, Issue 3, 2004, p. 240-255.
-
Rana S., Jasola S., Kumar R. A review on particle swarm optimization algorithms and their applications to data clustering. Artificial Intelligence Review, Vol. 35, Issue 3, 2011, p. 211-222.
-
Yang K., Yang J., Wu J. S., et al. Performance analysis of DF cooperative diversity system with OSTBC over spatially correlated Nakagami-m fading channels. IEEE Transactions on Vehicular Technology, Vol. 63, Issue 3, 2014, p. 1270-1281.
-
Yang K., Martin S., Xing C. W., et al. Energy-efficient power control for device-to-device communications. IEEE Journal on Selected Areas in Communications, Vol. 34, Issue 12, 2016, p. 3208-3220.
-
Pulido G., Coello Coello C. Using clustering techniques to improve the performance of a multi-objective particle swarm optimizer. Genetic and Evolutionary Computation, 2004, p. 225-237.
-
Van Den Bergh F., Engelbrecht A. P. A cooperative approach to particle swarm optimization. IEEE Transactions on Evolutionary Computation, Vol. 8, Issue 3, 2004, p. 225-239.
-
Shi Q. J., Wu J. S., Chen Q. C., et al. Optimum linear block precoding for multi-point cooperative transmission with per-antenna power constraints. IEEE Transactions on Wireless Communications, Vol. 11, Issue 9, 2012, p. 3158-3169.
-
Yang K., Yang N., Xing C. W., et al. Space-time network coding with transmit antenna selection and maximal-ratio combining. IEEE Transactions on Wireless Communications, Vol. 14, Issue 4, 2015, p. 2106-2117.
-
Moslehi G., Mahnam M. A Pareto approach to multi-objective flexible job-shop scheduling problem using particle swarm optimization and local search. International Journal of Production Economics, Vol. 129, Issue 1, 2011, p. 14-22.
-
Chen W. N., Zhang J., Lin Y., et al. Particle swarm optimization with an aging leader and challengers. IEEE Transactions on Evolutionary Computation, Vol. 17, Issue 2, 2013, p. 241-258.
-
Ge C., Sun Z. L., Wang N., et al. Energy management in cross-domain content delivery networks: a theoretical perspective. IEEE Transactions on Network and Service Management, Vol. 11, Issue 3, 2014, p. 264-277.
-
Han F. X., Zhao S. J., Zhang L., et al. Survey of strategies for switching off base stations in heterogeneous networks for greener 5G systems. IEEE Access, Vol. 4, 2016, p. 4959-4973.
-
Zhou Y., Pei S. A hybrid co-evolutionary particle swarm optimization algorithm for solving constrained engineering design problems. JCP, Vol. 5, Issue 6, 2010, p. 965-972.
-
Zhao L., Qian F., Yang Y., et al. Automatically extracting T-S fuzzy models using cooperative random learning particle swarm optimization. Applied Soft Computing, Vol. 10, Issue 3, 2010, p. 938-944.
-
Lee C. H., Lee Y. C. Nonlinear systems design by a novel fuzzy neural system via hybridization of electromagnetism-like mechanism and particle swarm optimisation algorithms. Information Sciences, Vol. 186, Issue 1, 2012, p. 59-72.
-
Juang C. F., Chang Y. C., Hsiao C. M. Evolving gaits of a hexapod robot by recurrent neural networks with symbiotic species-based particle swarm optimization. IEEE Transactions on Industrial Electronics, Vol. 58, Issue 7, 2011, p. 3110-3119.
-
Ding G., Tan Z., Wu J., et al. Indoor fingerprinting localization and tracking system using particle swarm optimization and Kalman filter. IEICE Transactions on Communications, Vol. 98, Issue 3, 2015, p. 502-514.
-
Luo Q. L., Fang W., Wu J. S., et al. Reliable broadband wireless communication for high speed trains using baseband cloud. EURASIP Journal on Wireless Communications and Networking, 2012, https://doi.org/10.1186/1687-1499-2012-285.
-
Wang T., Yang J. A heuristic method for learning Bayesian networks using discrete particle swarm optimization. Knowledge and Information Systems, Vol. 24, Issue 2, 2010, p. 269-281.
-
Narang N., Dhillon J. S., Kothari D. P. Multi-objective fixed head hydrothermal scheduling using integrated predator-prey optimization and Powell search method. Energy, Vol. 47, Issue 1, 2012, p. 237-252.
-
Rashid M., Baig A. R. PSOGP: a genetic programming based adaptable evolutionary hybrid particle swarm optimization. International Journal of Innovative Computing, Information and Control, Vol. 6, Issue 1, 2010, p. 287-296.
-
Xiao P., Wu J. S., Cowan C. F. N. MIMO detection schemes with interference and noise estimation enhancement. IEEE Transactions on Communications, Vol. 59, Issue 1, 2011, p. 26-32.
-
Xiao P., Wu J. S., Sellathurai M., et al. Iterative multiuser detection and decoding for DS-CDMA system with space-time linear dispersion. IEEE Transactions on Vehicular Technology, Vol. 58, Issue 5, 2009, p. 2343-2353.
-
Wu L., Wen Z., Li W., et al. Thermo-elastic–plastic finite element analysis of wheel/rail sliding contact. Wear, Vol. 271, Issue 1, 2011, p. 437-443.
-
Wu H., Liu Y., Jiang W. Analytical integration of the moments in the diagonal form fast multipole boundary element method for 3-D acoustic wave problems. Engineering Analysis with Boundary Elements, Vol. 36, Issue 2, 2012, p. 248-254.
-
Jang S., Ryue J. Study on the rolling noise model using an analysis of wheel and rail vibration characteristics. Journal of the Korean Society for Railway, Vol. 16, Issue 3, 2013, p. 175-182.
About this article
A Project Funded by the Priority Academic Program Development of Jiangsu Higher Education Institutions (PAPD).

