Abstract
Currently, the significant dynamic plastic deformation of a buried gas pipeline frequently occurs due to the ground construction process that acts as a direct threat to the operation security of a buried gas transmission system. In this study, the pipe-soil interaction structure under a dynamic consolidation load, such as high energy dynamic compaction load, was considered as a non-conservative system in the work. Two parts of structure dissipation energy were introduced into the Lagrange function, and the elastoplastic dynamic equations of a non-conservative system based on the Hamilton Variation Principle (HVP) and the finite element (FE) theory were established. Implicit solution schemes were proposed based on the dynamic equations, and a steel weight-soil-buried pipeline finite element model was developed by performing a dynamic analysis in the LS-DYNA software with an explicit format. Vivid impact responses of an underground pipeline associated with the buried depth, wall thickness, and tamping energy were simulated. The plastic failure criterion of high toughness pipeline steel indicates that treated pipeline buried depth, wall thickness, and tamping energy corresponded to the generalized loads, and limit state of a specific case. So, they were recognized via the relationship of generalized load in relation to the total strain of pipelines. This was performed by using tangent intersection criteria, two elastic slope criteria, and zero curvature criteria. Additionally, the von Mises yield stress criterion was also applied as a traditional approach. The study potentially offers significant references on the quantitative pre-evaluation of a buried gas pipeline that poses as a threat due to the occurrence of third-party damage such as extreme strong ground interference.
1. Introduction
Recently, ground construction activities including drilling exploration, foundation construction, and underground facilities installation are increasingly more frequent, and this leads to a threat with respect to the “area of opportunity” [1] where a buried pipeline is threatened by the expansion of third-party damage. Pipeline accident statistics from the U. S. Department of Transportation (DOT) indicate that approximately 20-40 % of pipeline failures are caused by third-party damages. In Europe, the third-party damage accounts for approximately 50 % of all gas pipeline failure [2]. In China, with the trunk line in the Sichuan province as an example, approximately 14.2 % of the damages were caused by third-party interferences from 1969 to 1990, and this rate increased to 52.9 % after 2000. The statistical data shows that the third party damage accident ratio continuously increases, and thus the quantitative analysis of third-party interference is a key and difficult part of pipeline risk evaluation [3].
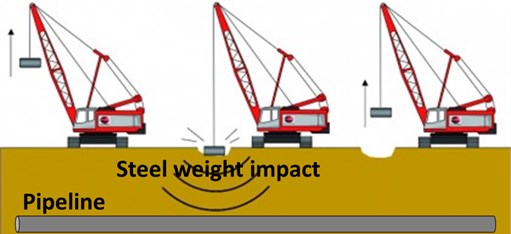
The dynamic consolidation (or dynamic compact) method was first used by Menard L. in 1969 for the treatment of abandoned stone foundation in the area of Napoule near Cannes. As shown in Fig. 1, dynamic consolidation is a complex nonlinear dynamic ground construction which makes a huge impact load by using the falling steel weight within very short time. Thus, it is considered as one of the main third-party threats of buried gas pipelines where it is possible to detect obvious dynamic characteristics. Many extant studies involving numerical analyses and experimental studies were performed on the problem of dynamic compaction kinetics. Theoretical studies examining boundary contact stress of dynamic compaction were performed by Kong et al. [4] and Tong et al. [5]. A dynamic contact finite element method was applied by Jiang et al. [6] to analyze the impact of dynamic compaction on foundation soil. Additionally, explicit transient nonlinear finite element analysis technology and a large deformation problem analysis method were employed in a study by Shui et al. [7]to examine impact response during a dynamic compaction operation on the foundation soil. Furthermore, numerical modeling methods were developed by Song et al. [8], Li et al. [9] and Y. K. Chow et al. [10] to investigate the characteristics of dynamic compaction. Several in-situ tests were made by Brandl et al. [11] and He et al. [12] to examine the subgrade compaction as well as the dynamic stress distribution of a hammer influence area.
Fig. 1Impact of dynamic consolidation operation on buried gas pipeline
General phenomena and basic laws of rammer and soil during the dynamic compaction process were analyzed in most of existing studies but seldom researchers analyzed a force on the damage response of underground facilities such as a buried steel gas pipeline. In the present study, dissipated energy was introduced into a Lagrange function for a non-conservative system. The finite element scheme for the governing equations of the elastic plastic body with energy dissipation was derived based on the Hamilton Variation Principle (HVP). During this process, the dynamic control equation of an element (including kinetic energy, strain energy, damping dissipation work, and external force potential energy) was transformed into a dynamic control equation of an element (including a stiffness matrix, mass matrix, damping matrix, and load matrix). Based on the explicit scheme, the rammer-soil-buried pipeline interaction model under dynamic contact conditions was constructed by using the finite element method. It was assumed that the rammer corresponded to the rigid body. The Drucker-Prager constitutive model was selected as the elastic-plastic state of soil under the shock load and X70 buried steel pipe with strain rate effects which were reflected by the Cowper-Symonds model. In the semi-infinite soil medium, reasonable dynamic parameters and a contact algorithm were set to analyze the extreme stress, strain, and vibration velocity of a pipe with respect to three variables including buried depth, pipe wall thickness, and compact energy. Finally, the critical status was calculated by four limit analysis methods, namely the tangent intersection criterion, double elastic slope criterion, zero curvature criterion, and stress intensity criterion.
2. Elastoplastic dynamic governing equations
2.1. Implicit derivation based on HVP
Undoubtedly, it is necessary to consider the damping dissipation of a structure in practical dynamic impact processes such as the dynamic compaction. In the present study, the dissipation energy was introduced into the Lagrange function, and the dynamic governing equations for finite element scheme of elastoplastic body that account for the energy dissipation were derived based on the HVP. First, a unit body with kinetic energy , strain energy , and external force potential energy is considered. With respect to the conservative system, the Lagrange function is expressed as follows [13]:
The plastic dissipation function is embedded into the non-conservative system of the elastoplastic medium, and thus Eq. (1) is written as follows:
Thus, the elastoplastic dynamic governing equations are described as shown in Eq. (3), and the details of the derivation process based on HVP are given in the Appendix:
where , , , and represent stiffness matrix, mass matrix, damping matrix, external load matrix, and generalized load matrix produced by plastic deformation of the unit body. Eq. (3) is re-expressed in an incremental form as shown in Eq. (4):
where, and represent the matrix incremental of external load and the generalized load matrix incremental produced by plastic deformation, respectively, and and . The details of each symbol are given in Appendix.
The finite element program of dynamic compaction involves solving a dynamic equation by using the step-by-step time integration. It is necessary to select an appropriate loading time step to control the solution stability. If the selected load time step is too low, then it increases the calculation time. And conversely, the calculation accuracy is affected if the selected time step is too high. With respect to the compaction and other dynamic impact load, the time step is determined by the following expression [14]:
where denotes characteristic size of the smallest element in the structure; and denotes the longitudinal wave velocity.
The method is used in conjunction with the Newmark method and the plastic iterative method for the solution of the incremental form of a control equation in each time step. The solution process is shown in Fig. 2.
2.2. Damping definition in explicit finite element code
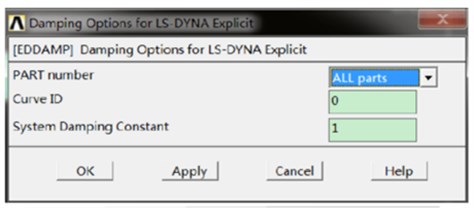
The explicit analysis of dynamic finite element program is based on a dynamic control equation [15]. In the ANSYS/LS-DYNA finite element software, a Hamilton control equation is achieved through the damping settings as shown in Fig. 3. The commands including EDDAMP, PART, LCID, and VALDMP can be selected in Damping Options. The element group number for the damping load is defined via PART. The Load curve ID (LCID) identifies the damping coefficient versus time curve, and an LCID is required if time-dependent damping is defined. Additionally, VALDMP is used to specify the mass damping with respect to time, and VALDMP is a constant system damping coefficient or a scale factor applied to the curve to define the damping coefficient relative to time. Thus, the mass-weighted (Alpha) or stiffness-weighted (Beta) damping is defined by using the EDDAMP command [16].
Fig. 2Flow chart for solving governing equations of elastoplastic dynamic process
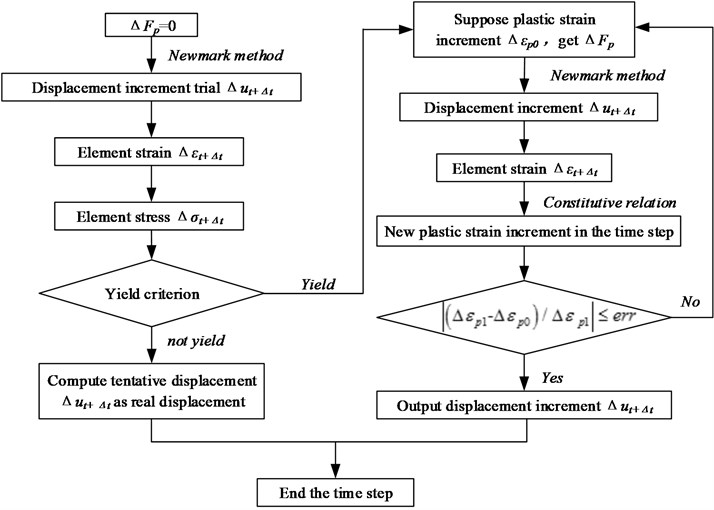
Fig. 3Damping option box in ANSYS
In addition to the Damping Option command, the mass-weighted (Alpha) or stiffness-weighted (Beta) damping is expressed in the LS-DYNA input file as *DAMPING_GLOBAL, *DAMPING_PART_MASS, and *DAMPING_PART_STIFFNESS.
3. Finite element modeling
3.1. Material parameters
Currently, pipelines with extreme strength and ductility that are composed of X70 and X80 grade steels are widely used in a long-distance natural gas transmission system. A kinematic hardening bilinear model that obeys the von Mises yield criterion can easily identify the strength and deformation of a steel pipeline under dynamic impact conditions as follows:
where denotes the partial stress tensor; denotes the back stress tensor; and denotes the yield stress.
The strain rate effect should not be ignored due to the high speed impact of dynamic consolidation. In this study, the strain rate is considered during the usage of the Cowper-Symonds (C-S) [17] model that scales the yield stress rate dependent factor as shown below:
where denotes the static yield strength or initial yield stress, and denote the C-S strain rate parameters, denotes the equivalent strain rate, , denotes the hardening parameter between 0 (kinematic hardening only) and 1 (isotropic hardening only), denotes the effective plastic strain, and denotes the plastic hardening modulus that is given by , and and denote the tangent modulus and elastic modulus, respectively. If only kinematic hardening is involved, then Eq. (7) is expressed as Eq. (8) as follows:
The material parameters of C-S model can be determined based on the related test results of high strength steel [18] as listed in Table 1 (keyword *MAT_PLASTIC_KINEMATIC in LS-DYNA).
Table 1Material parameters of pipeline steel
Density (kg/m3) | Elastic modulus (GPa) | Poisson’s ratio | Tangent modulus (GPa) | Yield stress (MPa) | C-S strain rate parameter | |
C/s-1 | ||||||
7900 | 210 | 0.3 | 13.5 | 540 | 5946 | 1.75 |
The Drucker-Prager (D-P) model was selected as the constitutive law of soil (keyword *MAT_DRUCKER_PRAGER in LS-DYNA). The D-P model is a reasonable law to model the elastic-plastic state of soil under an impact load during which the instability in the large deformation calculation is available [19]. The expression of D-P model is given below:
where , and denote the second invariant of stress deviation, , and denotes the first invariant of stress tensor, and denote the constants determined by cohesion value c and angle of friction as follows:
Table 2Soil material parameters
Soil type | Density (kg/m3) | Elastic shear modulus (MPa) | Poisson’s ratio | Cohesion value (kPa) | Angle of friction (rad) |
Clay | 1500 | 5.38 | 0.3 | 42 | 0.471 |
Sand | 1840 | 20 | 0.25 | 5 | 0.611 |
Collapsible loess | 1380 | 7.25 | 0.38 | 14.9 | 0.414 |
Gravel | 2200 | 25 | 0.2 | 55 | 0.698 |
Four different soil types were applied to analyze the buffering effect under different soil properties (as listed in Table 2), which are especially necessary for a long-distance pipeline. Specifically, when the rammer collided with the soil by surface-to-surface contact, the free surface vibration caused soil and buried pipeline turbulence. In order to save computing time, the steel weight was approximately regarded as a rigid body with a density of 7640 kg/m3.
3.2. Model design
It is assumed that the soil is an elastic-plastic material that is composed of horizontal layers, and each layer is homogeneous and isotropic. Thus, the process of dynamic consolidation can be simplified as a semi-infinite system that is impacted by a rammer with the short cylinder shape [19]. In this study, the diameter of rammer corresponds to 2 m, and the steel weight impacts immediately the soil above the pipeline (with an outer diameter , thickness , and buried depth ). Fig. 4 schematically describes the relative position and size of each part. The surface-to-surface contact mode with a pure penalty method was selected as the contact schemes between hammer, soil, and buried pipeline. An artificial boundary referred to as the non-reflective boundary condition was applied to the pipeline perimeter boundaries and the bottom boundary, which corresponded to the semi-infinite earth in reality. A solid164 hexahedral element was selected in the explicit FEA model, which included the steel rammer, soil, and buried pipelines. As shown in Fig. 5, a half model was developed due to the symmetry of the model. This was performed by using the Lagrange element where a total of 15,379 nodes and 12,792 elements were divided.
Fig. 4Geometric model
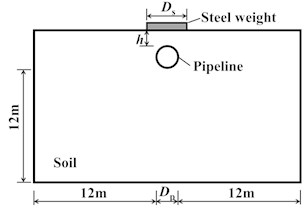
Fig. 5Finite element model
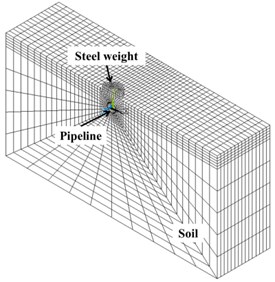
Fig. 6Interface of object-oriented program
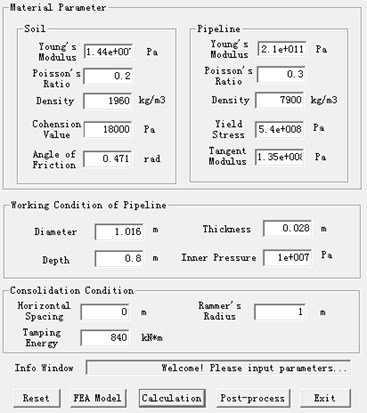
In order to enhance the simulation efficiency, an object-oriented program was designed as shown in Fig. 6, and it includes the material parameters of the soil and pipeline steel as well as the working conditions of pipeline and consolidation behavior. The function of the FEA model and its calculation and post-process in the interface triggered the corresponding software. Thus, the material parameters and working conditions could be modified conveniently.
3.3. Calculation results and discussion
3.3.1. Soil buffer mechanism
As mentioned above, in order to obtain the solution of the dynamic problem, it is necessary to gradually integrate the dynamic governing Eq. (4). Specifically, the LS-DYNA uses the explicit central difference method for time integration. The buffer mechanism of the soil above the pipe is expressed by a damping part in the dynamic governing equation, and the soil damping is divided into two terms as follows:
where and denote the constants with values that are associated with the lumped mass matrix and global stiffness matrix , and 0.7 and 0.002.
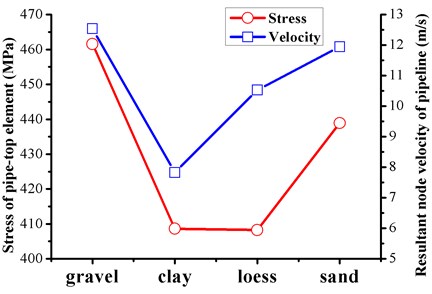
Four soil models (Table 2) were employed in the present study to identify the damping effect relative to the steel weight. Fig. 7 visually depicts the depression of the collapsible loess surface under impact during which the tamping energy corresponds to 1000 kJ. It ensures that other conditions remain unchanged as follows: 1016 mm, 1 m, 21 mm, 10 MPa, and 2 m. Fig. 8 shows the duration traces of the vertical displacement of steel weight penetrated into the soil, and it was possible to obtain a clear intuitive judgment of the strength of each soil. The most significant compaction depth that corresponded to 0.246 m appeared on the collapsible loess. The clay and gravel mediums were characterized by the obvious rebound phenomenon that was distinguished from those of the other types. Thus, a visual impression was obtained where the gravel corresponded to the most rigid medium. But it had significant flexibility that directly affected the response intensity of the buried pipeline due to the buffer mechanism. Fig. 9 shows a comparison of the von Mises stress of the pipe-top element 12165 and the maximum resultant node velocity of pipeline. The gravel medium with the highest density and elastic shear modulus always created the highest interference on pipeline. In contrast, the clay played a much better cushion role as well as a vibration mitigation effect with respect to an underground structure than with respect to the other mediums. Additionally, it is observed that clay is widely found in developed areas with active ground construction. Thus, clay is considered as the covering layer, and the dynamic response and limitation analyses of the buried gas pipeline under multiple working conditions are performed in the following sections.
Fig. 7Y-displacement contours of collapsible loess under consolidation load
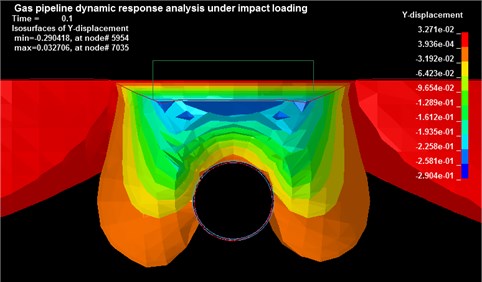
Fig. 8Y-displacement of four different soil types under a consolidation load
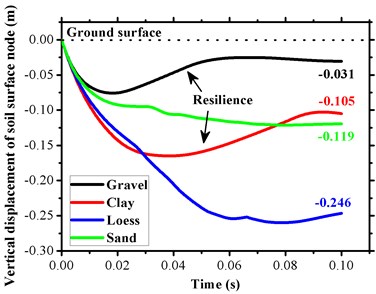
Fig. 9Comparison of dynamic responses of a pipe-top
3.3.2. Distance attenuation analysis
With respect to the ground dynamic compaction, the soil buffer mechanism is always closely related to the energy attenuation due to the increase in a construction distance, and this is illustrated by the interference of pipeline under different impacting distances. This includes both vertical and horizontal orientations. The former case is discussed here while the latter is calculated in section 3.3.3.
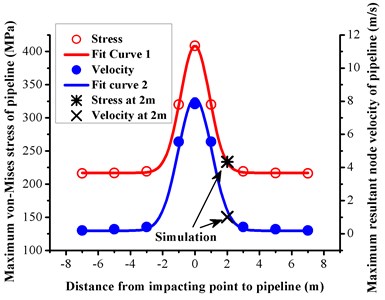
Fig. 10 shows the von Mises stress reduction of pipe-top element 12165 by using a time-history curve. There a significant decrease occurred when the distance exceeded 3 m. Since then the inner pressure was a major contributor of the equivalent stress of the pipeline, and its value approximately corresponded to 214 MPa. The maximum value of pipeline approximately corresponded to 216 MPa. Clearer distance-dependences regularities are observed in Fig. 11 in which maximum equivalent stresses of pipeline under five distances are calculated and indicated by open red circles, and the maximum resultant node velocities are denoted with solid blue circles. As observed in the figure, there is a high reduction in the slope between 1 m and 3 m in both responses, and they are fitted by the solid lines. The tendencies of the distance attenuation law for pipeline’s dynamic response are accurately described by the Gauss function as given below:
where denotes the modeling result including maximum von Mises stress and maximum resultant node velocity as shown in Fig. 11; denotes estimated minimum values; denotes distance from the pipeline to the loading position in this study; and , , and correspond to constants determined by different conditions. Thus, the fit curve for stress and velocity is analyzed by Origin 8.0, and the Gauss functions are described as follows:
With respect to the maximum von Mises stress :
With respect to the maximum resultant node velocity :
In order to verify the applicability of Eqs. (13) and (14), the simulation of a 2 m distance was performed. The stress and velocity results corresponded to 233.51 MPa and 1.0081 m/s, respectively, by modeling, and the stress and velocity results corresponded to 233.01 MPa and 1.41 m/s, respectively, when Eq. (13) and Eq. (14) were used. As shown in Fig. 11, the fit curves with a Gauss function indicate good prediction ability for a relative dynamic response. Thus, the predictive trending by Gauss functions is extremely similar to the time-history character as shown in Fig. 10.
Fig. 10Distance attenuation with respect to equivalent stress of a pipe-top element
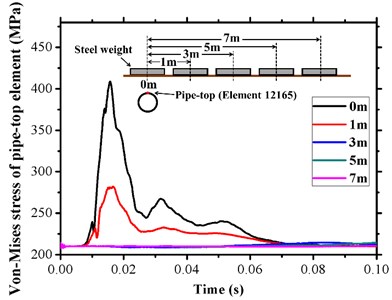
Fig. 11Distance attenuation law of dynamic response of buried pipeline (positive and negative distances indicate two opposite directions from the impacting point)
3.3.3. Multi-condition analysis
The security of a long-distance buried gas pipeline under dynamic compaction is always influenced by multiple variables, such as buried depth, wall thickness inner pressure, soil type, and tamping energy, which should be considered as the main risk factors of third-party damage. Although the inner pressure and soil type factors were discussed above, it is necessary to further clarify the relevance of other factors. Three conditions (A, B and C) containing a total of 21 cases (listed in Table 3) were investigated by using an explicit code in the following sections. It was assumed that the pipeline was always in the worst status, and this indicated that an additional protective structure was not present above the pipeline. The impact distance was assumed as 0 m, and it was assumed that the pipeline directly contacted the clay in all cases.
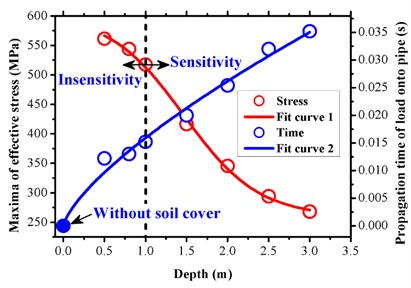
In condition A, the dynamic responses of the gas pipeline were analyzed under the following different buried depths: 0.5 m, 0.8 m, 1.0 m, 1.5 m, 2.0 m, 2.5 m, and 3.0 m. The following parameters were used in each case: pipeline diameter 1016 mm, wall thickness 21 mm, inner pressure 10 MPa, tamping energy 2500 kJ. The effective stress was considered as an example, and Fig. 12 shows the maximum effective stress-time response of the pipeline under different buried depths. Qualitatively, an obvious stress attenuation phenomenon was obtained with an increase in the buried depth (horizontal impact distance), and the time consumption of the stress curve peak also increased. It should be noted that significant fluctuations existed with respect to both stress and time when 1 m. The quantitative assessment in Fig. 13 indicated that the maximum stress decreased from 517.33 MPa to 416.12 MPa when the buried depth increased from 1.0 m to 1.5 m. This indicated that the sensitivity of the horizontal impact distance as well as the loading propagation duration existed when the pipeline was buried at a depth exceeding 1.0 m. Thus, the appropriate increase in the overlying soil can effectively protect the pipeline, especially the pipeline laid through high consequence areas.
Slope-illustrated embedded fit curves demonstrated in Fig. 13 can articulate the feature descriptions mentioned above. A dose-response curve with a variable Hill slope was used to identify the tendency of maximum von Mises stress under different buried depths as follows:
With respect to the loading propagation time , the Allometric power function was applied to describe the influence of the buried depth of the pipeline as follows:
Table 3Multi-conditions in simulation (X70 pipeline, Dp= 1016 mm)
Condition | Case | Inner pressure (MPa) | Depth (m) | Wall thickness (mm) | Tamping energy (kJ) |
A | 1 | 10 | 0.5 | 21.0 | 2500 |
2 | 10 | 0.8 | 21.0 | 2500 | |
3 | 10 | 1.0 | 21.0 | 2500 | |
4 | 10 | 1.5 | 21.0 | 2500 | |
5 | 10 | 2.0 | 21.0 | 2500 | |
6 | 10 | 2.5 | 21.0 | 2500 | |
7 | 10 | 3.0 | 21.0 | 2500 | |
B | 1 | 10 | 1.0 | 14.6 | 2500 |
2 | 10 | 1.0 | 17.5 | 2500 | |
3 | 10 | 1.0 | 21.0 | 2500 | |
4 | 10 | 1.0 | 26.2 | 2500 | |
5 | 10 | 1.0 | 28.0 | 2500 | |
C | 1 | 10 | 1.0 | 21.0 | 1000 |
2 | 10 | 1.0 | 21.0 | 1500 | |
3 | 10 | 1.0 | 21.0 | 2000 | |
4 | 10 | 1.0 | 21.0 | 2500 | |
5 | 10 | 1.0 | 21.0 | 3000 | |
6 | 10 | 1.0 | 21.0 | 3500 | |
7 | 10 | 1.0 | 21.0 | 4000 | |
8 | 10 | 1.0 | 21.0 | 4500 | |
9 | 10 | 1.0 | 21.0 | 5000 |
Fig. 12Time-history of effective stress maxima with respect to different buried depths
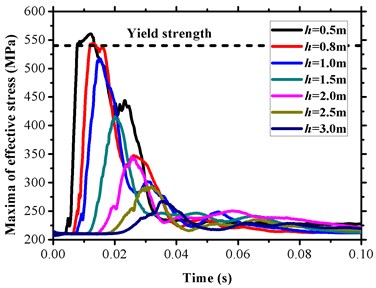
Fig. 13Stress magnitude and loading propagation characters with respect to different buried depths
The thickness-stress response was simulated in condition B where the following other parameters were considered as constant: pipeline diameter 1016 mm, inner pressure 10 MPa, buried depth 1.0 m, and tamping energy 2500 kJ. Fig. 14 shows the effective stress maxima under the following five different wall thicknesses: 14.6 mm, 17.5 mm, 21.0 mm, 26.2 mm, and 28.0 mm. The maximum von Mises stress increased with decreases in the wall thickness. Higher residual stress fluctuations due to inner pressure were observed in these cases as compared with those in the other conditions. An increase in the wall thickness increased the reliability of the state for the pipeline operation.
Fig. 14Time-history of effective stress maxima under different wall thickness
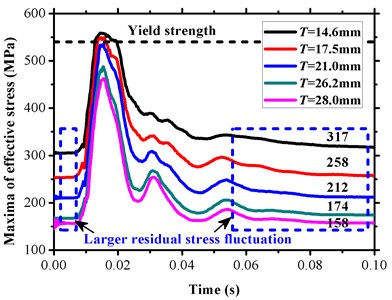
However, the extreme stress response was less insensitive to the wall thickness than expected. Thus, it is necessary to appropriately increase the wall thickness to a certain level that can enhance the ability to resist external interference in addition to considering a reasonable relationship between construction cost and system integrity with respect to a failure analysis.
In condition C, eight tamping energy levels (1500 kJ, 2000 kJ, 2500 kJ, 3000 kJ, 3500 kJ, 4000 kJ, 4500 kJ, and 5000 kJ) were imposed by the steel weight to explore the response of the pipeline with 1016 mm, 21.0 mm, 10 MPa, and 1.0 m. As shown in Fig. 15(a), the maximum von Mises stress exceeded the yield strength of the pipeline when the energy exceeded 2500 kJ. Thus, the sensitivity of the energy magnitude was motivated when the value was less than 2500 kJ. The bilinear law fitted in Fig. 15(b) distinctly proved the energy-stress characteristic via relative slopes. However, the bilinear law exhibits a close connection with the inner pressure, and this may offer an inherent interference on the pipeline resistance to the external force.
Fig. 15Maxima of effective pipeline stresses with respect to multiple tamping energy levels
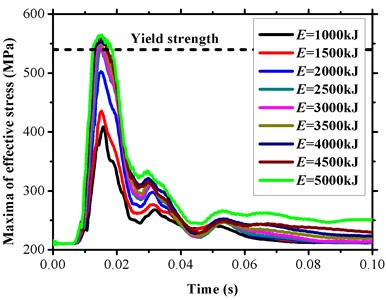
a) Time-history curve
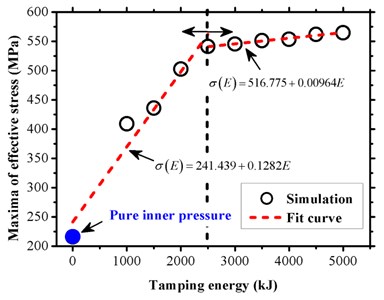
b) Bilinear law
In the pipeline system, pipeline vibrations cause loosening and breakage of the pipeline attachments as well as the pipeline connections [20]. This causes the pipeline to explode if the influence is significant and leads to serious accidents that compromise the safety [21]. From a vibration velocity viewpoint, the maximum resultant pipe velocities under a compacting load were calculated with four different soil types that could support more quantitative data for third party perturbations on the buried pipeline. Based on the results of the previous analysis, buried depth and tamping energy were selected as the variables as shown in Fig. 16 and Fig. 17.
Fig. 16Pipe vibration velocity under different depths
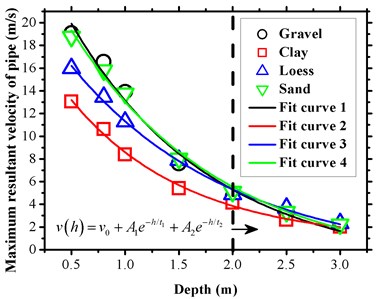
Fig. 17Pipe vibration velocity under different tamping energy
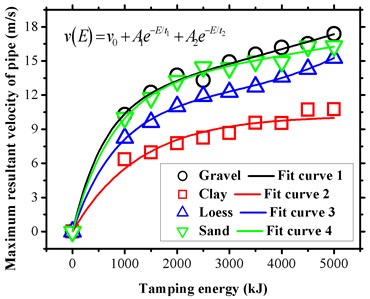
The general law for each case was similar and stated that a deeper buried depth led to a smaller vibration, and conversely that a higher load led to a stronger vibration. Each soil type with different parameters played a specific role of a different vibration damper. The damping effects due to different soil parameters were almost consistent especially when the depth exceeded 2.0 m as shown in Fig. 16, and this was not observed in Fig. 17. The prediction process was also performed by using the exponential function fit method, and the maximum resultant velocities of pipe and for each case was obtained by using five parameters, namely , , , and as listed in Table 4. The simulation results of the pipe vibration velocity under different conditions provided a theoretical reference for the field monitoring of a third-party disturbance.
Table 4Fitting parameters of maximum resultant velocity on pipeline under various depth and tamping energy
Parameter | Condition | Gravel | Clay | Loess | Sand |
Fig. 15 | –1.556 | 0.776 | –0.969 | –1.645 | |
Fig. 16 | –0.873 | 10.194 | 11.404 | 151109.776 | |
Fig. 15 | 15.719 | 9.877 | –0.969 | 14.976 | |
Fig. 16 | 12.574 | –5.097 | 0.238 | –151097.186 | |
Fig. 15 | 15.719 | 9.877 | 12.002 | 14.976 | |
Fig. 16 | –11.700 | –5.097 | –11.642 | –12.594 | |
Fig. 15 | 1.312 | 1.077 | 1.492 | 1.401 | |
Fig. 16 | –13455.090 | 1275.713 | –1786.724 | 2.050E8 | |
Fig. 15 | 1.312 | 1.077 | 1.492 | 1.401 | |
Fig. 16 | 615.517 | 1275.712 | 872.844 | 756.890 |
4. Limit state analysis
4.1. General engineering limit analysis method
Plastic failure is recognized as a common failure mode for high grade pipeline steel, and thus plastic limit load is an important parameter to determine the bearing capacity of a pipeline and to evaluate the integrity of the structure [22]. In actual working conditions, the stress-strain response exhibits strong non-linear characteristics when the material is in a plastic deformation stage. In order to avoid computational difficulties caused by a large deformation, the limit analysis method is widely adopted in engineering, and the following three limit analysis methods correspond to general options:
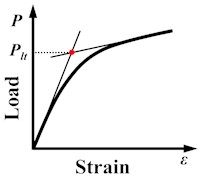
1) Tangent Intersection (TI) criterion was proposed by Save [23], and as shown in Fig. 18(a), the ultimate load is defined as the intersection of two tangent lines that are drawn based on the elastic stage and plastic flow stage of the load - strain () response by testing.
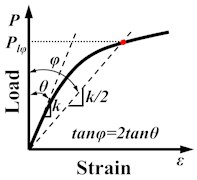
2) Double Elastic Slope (DES) criterion is accepted as an approximate criterion by multiple versions for boiler and pressure vessel code of ASME [24], and the ultimate load is determined by the intersection of the experimental load-strain () response and double elastic slope line as shown in Fig. 18(b).
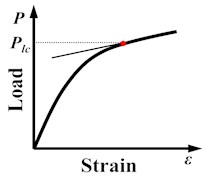
3) Zero Curvature (ZC) criterion was proposed by Zhang et al. [25] who improved the ZC criterion based on the TI criterion, and defined the ultimate load as the load value at the separation points of the load - strain () curve and the tangent of the plastic stage as shown in Fig. 18(c).
5. Limit analysis of pipeline under dynamic consolidation load
In order to determine the extreme state for a pipeline under a consolidation load, the load in Fig. 18 is converted into the relevant variables in Table 3, and the strain is considered as the maximum total stain under various conditions. Thus, it is necessary to post-process the relationship between extreme total strain ε and buried depth , wall thickness , and tamping energy . The strain results for specified operating conditions are listed in Table 5.
Fig. 18Three common limit load criteria
a) TI criterion
b) DES criterion
c) ZC criterion
Table 5Total strain for different conditions for buried gas pipeline with respect to tamping load
(1): Clay soil type, X70 pipeline, 1016 mm, 10 MPa, 21 mm, 2500 kJ | ||||||||||
Buried depth (m) | 0.5 | 0.8 | 1.0 | 1.5 | 2.0 | 2.5 | 3.0 | |||
Total strain (×10-3) | 3.6482 | 2.4103 | 2.135 | 1.7173 | 1.4257 | 1.2126 | 1.105 | |||
(2): Clay soil type, X70 pipeline, 1016 mm, 10 MPa, 1.0 m, 2500 kJ | ||||||||||
Wall thickness (mm) | 14.6 | 17.5 | 21.0 | 26.2 | 28.0 | |||||
Total strain (×10-3) | 3.4748 | 2.729 | 2.2074 | 2.0141 | 1.9072 | |||||
(3): Clay soil type, X70 pipeline, 1016 mm, 10 MPa, 21 mm, 1.0 m | ||||||||||
Tamping energy (kJ) | 1000 | 1500 | 2000 | 2500 | 3000 | 3500 | 4000 | 4500 | 5000 | |
Total strain (×10-3) | 1.6884 | 1.7986 | 2.074 | 2.2449 | 2.4838 | 2.9448 | 3.1002 | 3.6665 | 3.8718 | |
Based on three conditions listed in Table 5, strain-depth () curve, strain-thickness () curve, and strain-energy () curve are composed as shown in Fig. 19(a), 19(b), and 19(c), respectively. The limit buried depth ( by TI criterion, by TES criterion, by ZC criterion), limit wall thickness ( by TI criterion, by TES criterion, by ZC criterion), and limit tamping energy ( by TI criterion, by TES criterion, by ZC criterion) of a buried gas pipeline under a tamping load were obtained by applying three limit analysis methods as described in Section 4.1. For example, with respect to the clay medium, the limit value by the TI criterion are as follows: 0.943 m (Fig. 19(a)) and 19.073 mm (Fig. 19(b)), and they were more conservative than the other limit criterions ( 0.785 m, 16.927 mm, and 17.500 mm). With respect to the limit tamping energy, the conservative ordering corresponded to as shown in Fig. 19(c), which was contrary to the depth and thickness.
Fig. 19Limit analysis of buried gas pipeline with respect to tamping load (cases in Table 5)
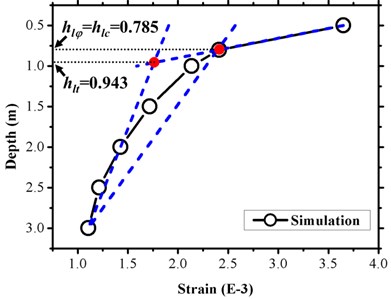
a) Total strain vs. depth
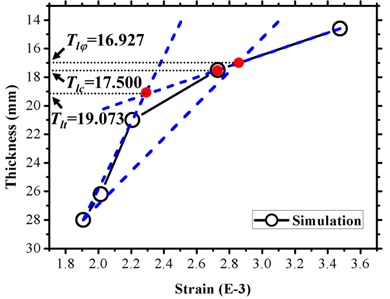
b) Total strain vs. wall thickness
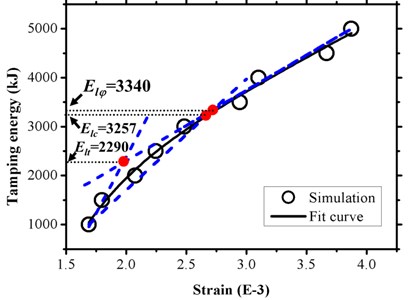
c) Total strain vs. tamping energy
Fig. 20 shows more limit analysis results of a pipeline under multi-conditions where additional von Mises yield stress criteria were used. With respect to the limit of the buried depth of pipeline shown in Fig. 20(a), the results with open blue squares by the TI criterion depict relatively conservative characteristics. In contrast, the yield stress criterion prediction with a solid pink inverted triangle is observed more clearly. Additionally, the buffer capacity of clay exceeds those of the other mediums, with the mean limit depth sequence that corresponds to Gravel > Loess > Sand > Clay, and clay also exhibited the lowest standard deviation as shown in the performed descriptive statistics plots. With respect to the limits of the wall thickness of the pipeline in Fig. 20(b), the results with respect to the yield stress criterion were more conservative than the others. The ZC criterion with an open green triangle exhibited a relatively smaller limit prediction value in gravel and sand. The lowest values of the TES criterion were observed for clay and loess. The order of the mean limit wall thickness corresponded to Gravel > Sand > Loess ≈ Clay. With respect to the limit of the tamping energy of the consolidation process as shown in Fig. 20(c), the TES criterion with a conservative property was only suitable for clay, and null for other soil types. The shock resistance of clay was also reflected by the mean energy limit values, which followed the order of Clay > Loess > Gravel > Sand. Thus, a higher value increased the buffer capability. The energy limitation data exhibited significant fluctuation as compared with those of the depth and thickness and especially with respect to the gravel and clay analysis.
Fig. 20Limit analysis results under multi-conditions
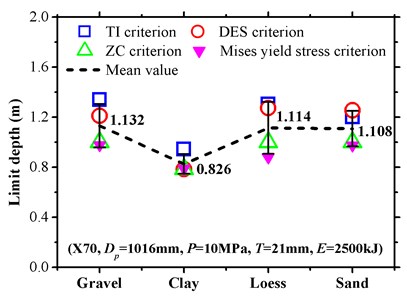
a) Limits of buried depth
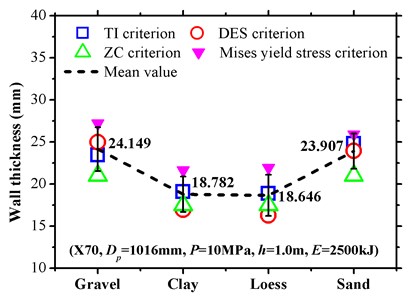
b) Limits of wall thickness
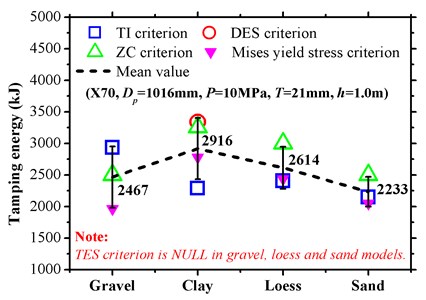
c) Limits of tamping energy
6. Conclusions
1) In this study, it is considered that the damping dissipation of a structure, such as buried gas pipeline, can be divided into a mass point movement part and strain rate related part, which are imported into the Lagrange function. Additionally, an implicit finite element scheme based on the Hamilton principle is established for the dynamic control equation of a non-conservative system composed of an elastoplastic material.
2) The finite element model of a compaction process with multi-conditions is developed and simulated by a LS-DYNA explicit solution method. The buffer mechanism of different soil types is assessed by using a one-to-one comparison where a significant role is played by clay in cushioning a steel weight-soil-pipeline system while gravel exhibits poor buffer performance. A total of 84 cases are investigated to identify the specific response law with respect to pipeline overload on the ground. The following results are obtained: 1) the magnitude on the covered soil thickness and tamping energy produced increased turbulence on pipeline as compared with that created by the wall thickness and that for the vibration velocity characteristic; 2) a significant residual stress appears under various wall thicknesses, and this barely affects the maxima of vibration velocity of a pipeline with different wall thicknesses; 3) a clear sensitivity and insensitivity boundary are statistically illustrated in both depth-stress-time response and energy-stress response where the former is located at approximately 1.0 m, and the latter has approximately 2500 kJ.
3) Based on the parametric analysis, four failure criterions are applied to determine the limit status of high toughness pipeline in specific cases. Generally speaking, clay supports increased damping ability with respect to an underground structure as compared with the other three soil types. With respect to the limit depth and limit wall thickness viewpoint, gravel soil exhibits the worst resistance capability with respect to external forces while sand performs the worst from the limit tamping energy viewpoint. The results indicate that the chat TI criterion, von Mises yield stress criterion, and ZC criterion always achieve relatively conservative results with respect to limit buried depth, limit wall thickness, and limit tamping energy, respectively. Thus, it is necessary to carefully inspect the applicability of TES criterion and especially for the limit tamping energy analysis.
References
-
Kent Muhlbauer W. Pipeline Risk Management Manual: Ideas, Techniques, and Resources. 3rd Edition, Gulf Professional Publishing, 2004.
-
Gas Pipe Line Incident: 1970-2001 5th Report of The European Gas Pipe line Incident Date Group, 2002.
-
Xu T. L., Yao A. L., Jiang H. Y., et al. Key techniques of risk assessment of oil and gas pipelines damaged by third-party. Journal of Oil and Gas Technology, Vol. 33, 2011, p. 150-154.
-
Kong L. W., Yuan J. X. Study on surface contact stress and settlement properties during dynamic consolidation. Chinese Journal of Geotechnical Engineering, Vol. 20, 1998, p. 86-92.
-
Tong X. D., Jiang Y. S., et al. A new method for dynamic contact analysis. Engineering Mechanics, Vol. 17, 2000, p. 82-86.
-
Jiang P., Li R. Q., Kong D. F. Numerical analysis of large deformation impact and collision properties during dynamic compaction. Chinese Journal of Geotechnical Engineering, Vol. 22, 2000, p. 222-226.
-
Tian S., Wang Z. Explicit nonlinear numerical analysis of dynamical performance of dynamic compaction. Rock and Soil Mechanics, Vol. 29, 2008, p. 1580-1584.
-
SongXiuguang Dynamic Analysis of Consolidation. Hehai University, Nanjing, 1997.
-
Li Benping Consolidation Mechanism Analysis by Finite Element Method. Zhejiang University, Hangzhou, 1993.
-
Chow Y. K., Yong D. M., et al. Dynamic compaction analysis. Journal of Geotechnical Engineering, Vol. 118, Issue 8, 1992, p. 1141-1157.
-
Brandl H., Sadgorski W. Dynamic stresses in soil caused by falling weights. Proceedings of the Ninth International Conference on Soil Mechanics and Foundation Engineering, Vol. 2, 1977, p. 187-194.
-
He C. M., Zou J. F., Li L. Field tests on measurement of dynamic stress of dynamic compaction. Chinese Journal of Geotechnical Engineering, Vol. 29, 2007, p. 628-632.
-
Dunne F., Petrinic N. Introduction to Computational Plasticity. Oxford University Press, 2005.
-
Fan T. Study on the Elastic Mechanics Quasi-Variational Principles of Nonlinear Non-Conservative Systems. Harbin Engineering University, 2007.
-
Fan J. H., Gao Z. H. Nonlinear Continuum Mechanics Foundation. Chongqing University Press, Chongqing, 1987.
-
LS-DYNA Keyword User’s manual (970V). Livermore Software Technology Corporation, Livermore, 2003.
-
Cowper G. R., Symonds P. S. Strain Hardening and Strain Rate Effects in the Impact Loading of Cantilever Beams. Brown University, Applied Mathematics Reports, 1958.
-
Chen Z. J., Yuan J. H., Zhao Y. Impact experiment study of ship building steel at 450MPa level and constitutive model of Cowper-Symonds. Journal of Ship Mechanics, Vol. 11, 2007, p. 933-941.
-
Zhao S. P., Zeng X. G., Yao A. L., et al. Dynamic response numerical simulation of buried gas pipeline during third-party interference. Sichuan Building Science, 2009, p. 138-139.
-
Tian Jialin, Yuan Changfu, Yang Lin, et al. Vibration analysis model of pipeline under action of gas pressure pulsation coupling. Engineering Failure Analysis, Vol. 66, 2016, p. 328-340.
-
Wang C. Q., Chai J. S., Niu W. W. Research on consequence assessment system of natural gas pipeline leakage accidents. Applied Mechanics and Materials, Vols. 295-298, 2013, p. 744-748.
-
Liang W. J., Chen P., Sheng S. P., et al. Limit Load Numerical Analysis of Pressure Pipe with Incomplete Welding Defects. Light Industry Machinery, 2008.
-
Save M. Experimental verification of plastic limit analysis of torispherical and toriconical heads, pressure vessels and piping: design and analysis. Pressure Vessels and Piping – Design and Analysis, Vol. 1, 1972, p. 382-416.
-
ASME, 2004, Boiler and Pressure Vessel Code Section VIII, Division 2. American Society for Mechanical Engineers, New York, USA.
-
Zhou Z. H. A Method of Hamiltonian System for Fracture Problems and Its Applications. Dalian University of Technology, 2011.
About this article
The authors appreciate the financial support provided by “The Young Scholars” Development Fund of Southwest Petroleum University of China. The authors declare that there is no conflict of interest regarding the publication of this paper.
