Abstract
In order to reveal the acceleration response law of shallow-buried bias double-arch tunnel under earthquake. The acceleration response of the shallow-buried biased double-arch tunnel under the action of Wenchuan wave was studied by the combination of shaking table test and numerical simulation. The effects of non-bias and bias on the acceleration response of shallow-buried biased double-arch tunnels were discussed. Research indicates: (1) Horizontal acceleration amplification factor of the left-hole (non-biased side) for the shallow-buried biased double-arch tunnel is V-shaped, and the right-hole (bias side) is ∩-shaped. The vertical acceleration amplification factor of the left-hole tends to increase continuously, and the right-hole shows a trend of decreasing first and then increasing continuously. (2) In the state of both the bias and the non-biased tunnel, the acceleration response in the vertical direction is stronger than that in the horizontal direction. (3) In the two states of bias and non-bias, the difference between the horizontal and vertical acceleration amplification factors of the double-arch tunnel is larger. It indicates that the excitation direction of the seismic wave has a great influence on the acceleration response of the double-arch tunnel. (4) Relatively biased double-arch tunnels, the regularity of non-biased double-arch tunnels is better, indicating that the bias voltage has a greater impact on double-arch tunnels.
1. Introduction
During the construction process, the tunnel project is limited by objective factors such as geological structure and environmental conditions, and it is possible to form a structural form of shallow-buried biased double-arch tunnel. The shallow-buried bias double-arch tunnel can meet the requirements of special terrain conditions and line control to a certain extent, and has been widely used in the practice of tunnel engineering.
At present, some scholars have used the shaking table test and numerical simulation to study the dynamic response of the tunnel structure. Chen J. [1] used the shaking table test and numerical simulation, found that the tunnel lining’s acceleration response is greater than the surrounding soil under high-intensity vibration. Fu X. [2] obtained the acceleration response characteristics of underground pipelines through large-scale shaking table test and ANSYS finite element software, and proposed a new method to simulate soil-pipelines interaction. Chen J. [3] studied the seismic response of the lining and the influence of the inner lining on the acceleration response of the tunnel structure by shaking table test and numerical simulation. Jiang X. [4] studied the seismic behavior of shallow buried tunnels under asymmetric pressure by shaking table test and numerical simulation and studied the damping effect of different thickness damping layers. Rabeti Moghadam M. [5] studied the influence of circular subway tunnel on ground acceleration by shaking table test and numerical simulation, and concluded that the subway tunnel has obvious influence on the seismic response of the low-period building constructed. Yang Bo [6] studied the acceleration response characteristics, strain response characteristics, dynamic stress distribution and lining crack development process by shaking table test and numerical simulation, and proposed a method to improve the tensile failure capacity of the lining. Li Lin [7] analyzed and compared the acceleration response of surrounding rock and tunnel structure by shaking table test and numerical calculation. It was concluded that the acceleration response has obvious amplification effect with the increase of elevation, and the slope of the bias tunnel leads to a significant increase in the amplification effect.
Compared with other forms of tunnels, shallow-buried biased double-arch tunnels are characterized by complex structural forms, asymmetric surrounding rock pressure and poor overall stability. Its acceleration response law is different from other tunnel forms. In order to reveal the acceleration response law of shallow buried bias double-arch tunnel under earthquake. The acceleration response of the shallow-buried biased double-arch tunnel under the action of Wenchuan wave was studied by the combination of shaking table test and numerical simulation. The effects of non-bias and bias on the acceleration response of shallow-buried double-arch tunnels were discussed. The inertial force of earthquake is the main reason for the deformation and instability of tunnel structure. The study on the acceleration response law of shallow-buried biased double-arch tunnels has certain reference significance for the seismic design of such tunnels.
2. Shaking table test
2.1. Test equipment
The test was completed in the National Engineering Laboratory of High-speed Railway Construction Technology of Central South University. The main parameters of the shaking table are as follows: the table size is 4.0 m×4.0 m (length×width); the maximum load is 30 tons; the working frequency is 0.1-50.0 Hz; the maximum displacement is 250 mm in the X and Y directions, and the Z direction is 160 mm; The acceleration is ±1.0 g in the X and Y directions; ±1.6 g in the Z direction. The shaking table equipment is shown in Fig. 1.
Fig. 1Shaking table
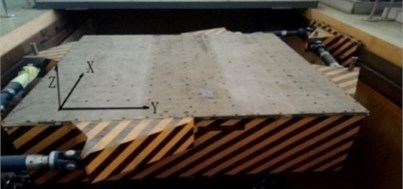
Fig. 2Model boundary
2.2. Similarity relation
The geometric similarity ratio of the model is 1:20, the acceleration similarity ratio is 1:1, the density similarity ratio is 1:1, and the other similarity constants are derived by the similarity theory [8, 9], as shown in Table 1.
Table 1The main similarity constants of the model to prototype
Physical quantity | Similar relation | Similar constants |
L (m) | Cl | 20 |
ρ (kg·m-3) | Cρ=1 | 1 |
E (MPa) | CE=Cρ∙Cl | 20 |
ε | Cε=1 | 1 |
σ (kPa) | Cσ=Cρ∙Cl | 20 |
μ | Cμ=1 | 1 |
T (s) | Ct=Cl0.5 | 4.47 |
a (m·s-2) | Ca=1 | 1 |
u (mm) | Cu=Cl | 20 |
v (mm·s-1) | Cv=Cl0.5 | 4.47 |
ω (Hz) | Cw=Cl-0.5 | 1 |
φ (°) | Cφ=1 | 1 |
γ (kN·m-3) | Cγ=Cρ | 1 |
C (kN·m-2) | Cc=Cρ∙Cl | 20 |
Note: L length, ρ density, E elastic modulus, ε strain, σ stress, μ Poisson ratio, T time, a acceleration, u displacement, v velocity, ω frequency, φ internal friction angle, γ specific weight, C cohesion | ||
2.3. Model box and treatment of boundary
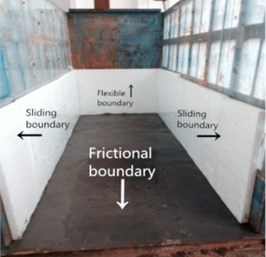
The test uses a rigid model box with an internal dimension of 350 cm×150 cm×210 cm (length × width × height), and the inside of the model box is treated as follows [10, 11]: The inner side wall is provided with a 10 cm thick polystyrene foam board to reduce the boundary effect, and a smooth polyvinyl chloride film is adhered on the surface to reduce the friction with the rock layer; The bottom of the model box is machined as a frictional boundary to prevent relative sliding of the bottom of the model box during vibration. Treatment of the boundary is shown in Fig. 2.
2.4. Test material and physical model
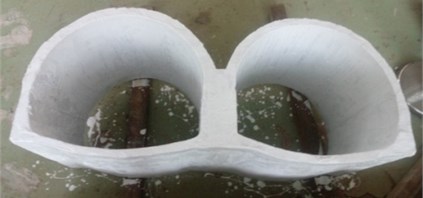
The lining was prefabricated by a mold. Before casting, a release agent was applied in the mold to prevent the lining and the mold from sticking to each other, and the wire mesh was pre-buried. Poured the configured model-concrete into the mold and fully compact it during pouring. After the pouring was completed, the mold was removed after 7 days of curing in a standard curing room that room temperature of 20±2 ℃ and humidity of not less than 95 %, and keep it for 28 days. The lining model is shown in Fig. 3.
Fig. 3Lining model
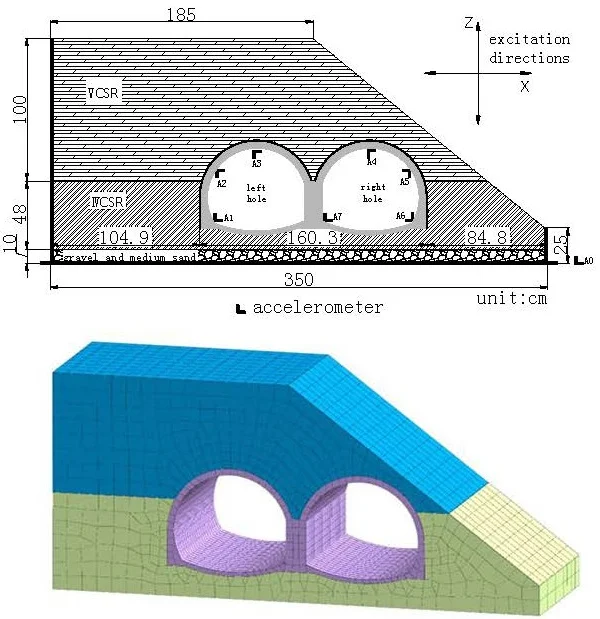
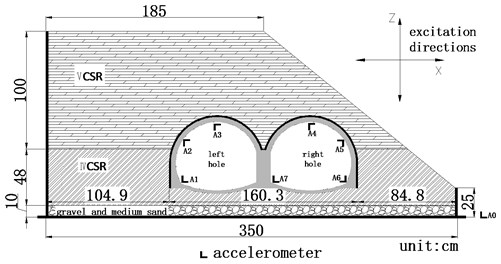
The uneven pressure of the tunnel is formed by the topographical factors, and the slope of the slope is about 1:1.2. The surrounding rock of the tunnel is divided into two layers. The upper V-class surrounding rock (VCSR) has a thickness of 1 m and is simulated by silty clay containing sand. The water content is determined to be 24 %. The lower IV-class surrounding rock (IVCSR) has a thickness of 0.48 m. Formulated with barite powder, quartz sand and lithium grease, the weight ratio of the three materials is 10:5:1. The surrounding rock dimensions are shown in Fig. 4.
Fig. 4Layout scheme of accelerometer
2.5. Layout of transducers
The test uses a one-way acceleration sensor to collect the acceleration response of the lining. The type of the accelerometer is 1221L-002, numbered A0-A7, and the acceleration measuring point is arranged as shown in Fig. 4.
2.6. Seismic wave and loading scheme
The test selected Wenchuan wave as the loading wave, the loading direction is horizontal one-way (WC-X), vertical one-way (WC-Z) and horizontal and vertical two-way simultaneous excitation (WC-XZ), the loading direction is shown in Fig. 4. The time compression ratio of the seismic wave is 4.47, and the main frequency range is 0-20 Hz. The time-history curve and the Fourier spectrum of the compressed seismic wave are shown in Fig. 5 and Fig. 6. The simulated seismic intensity is VII to X, and the loading peak of the horizontal seismic wave (X direction) is 0.1 g, 0.2 g, 0.4 g, and 0.6 g. The vertical direction seismic wave and the horizontal direction seismic wave rarely reach the acceleration peak at the same time, so the vertical Z-direction acceleration peak takes 2/3 of the horizontal X-direction peak value. In the case of bidirectional excitation, the above values are combined and loaded step by step. Before the shaking table is officially loaded with seismic waves, the loaded white noise (WN-XZ) is not less than 60 s, so that the dynamic characteristics of the model can be observed in real time. The test loading scheme is shown in Table 2.
3. Numerical simulation
MIDAS GTS NX has good applicability to anisotropic, nonlinear and heterogeneous materials, and can simulate various complex boundary conditions well, which can truly reflect the acceleration response of tunnel under seismic loading. In this paper, MIDAS GTS NX was used to analyze the shallow-buried biased double-arch tunnel and obtained the acceleration response law of the tunnel. According to the research results of Chen Guo-Xing [12], the size of the numerical model should be more than 5 times larger than the size of the physical model to reduce the boundary effect. Therefore, the length, width and height of the model in the actual calculation model are 33 m, 10 m and 14.5 m. After the numerical calculation model is reasonably meshed, the total number of nodes is 10,557 and the total number of units is 15,919.
Fig. 5Acceleration time-history curve of WC seismic wave
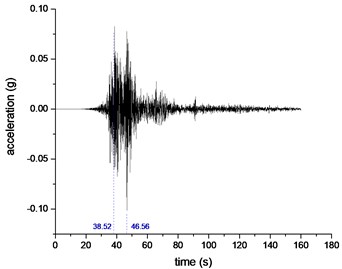
Fig. 6Fourier spectrum of WC seismic wave
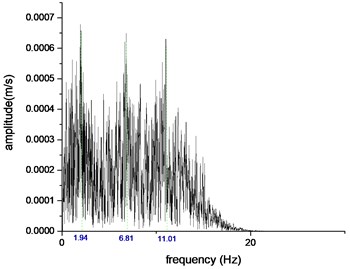
Table 2Loading scheme of shaking table test
Number | Cases | Peaks Acceleration/g | |
X | Z | ||
1 | WN-XZ-1 | – | – |
2 | WC-X-1 | 0.1 | – |
3 | WC-Z-1 | – | 0.067 |
4 | WC-XZ-1 | 0.1 | 0.067 |
5 | WN-XZ- 2 | – | – |
6 | WC-X-2 | 0.2 | – |
7 | WC-Z-2 | – | 0.133 |
8 | WC-XZ-2 | 0.2 | 0.133 |
9 | WN-XZ- 3 | – | – |
10 | WC-X-3 | 0.4 | – |
11 | WC-Z-3 | – | 0.267 |
12 | WC-XZ-3 | 0.4 | 0.267 |
13 | WN-XZ- 4 | – | – |
14 | WC-X-4 | 0.6 | – |
15 | WC-Z-4 | – | 0.4 |
16 | WC-XZ-4 | 0.6 | 0.4 |
The surrounding rock and lining of the tunnel in the calculation model are simulated by solid elements. The surrounding rock material uses the Mohr-Coulomb yield criterion. The lining uses an elastic constitutive relationship [13, 14]. The calculated model boundary uses free field boundaries, Rayleigh damping, and considers a critical damping ratio of 5 %. The specific calculation model is shown in Fig. 7.
Fig. 7Numerical simulation model for biased
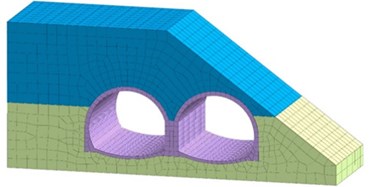
The physical and mechanical parameters for surrounding rock and lining are shown in Table 3. The input wave of the numerical model adopts two-way Wenchuan wave (WC-XZ), and the arrangement of measuring points corresponds to the arrangement of measuring points in the shaking table test. The seismic wave loading scheme is the same as the shaking table test.
Table 3Rock and lining material parameters
Materials | E / MPa | μ | φ / (°) | C / kPa | γ / (Kn·m-3) |
V CSR | 650 | 0.40 | 26 | 120 | 19 |
IV CSR | 9450 | 0.33 | 35 | 560 | 19 |
Lining | 17250 | 0.2 | – | – | 24 |
Note: E Elastic modulus, μ Poisson ratio, φ internal friction angle, C cohesion, γ bulk density | |||||
4. Comparative analysis of acceleration response
Acceleration amplification factors are used to compare and analyze the acceleration responses of each measuring point under different working conditions. The acceleration amplification factors for the X and Z directions are defined as the ratio of the acceleration response peaks at the measuring points X and Z to the peaks of the acceleration responses at the reference points X and Z. Due to space limitations, this paper only gives the acceleration time-history curve of the left hole vault (measurement point 3) and the right-hole vault (measurement point 4) under WC-XZ-3 working conditions, as shown in Fig. 8 and Fig. 9. It can be seen from the figure that the numerical simulation agrees well with the results of the shaking table test. The acceleration response of the left-hole vault is greater than the acceleration response of the right-hole vault. The vertical acceleration response of the same measuring point for the left and right vaults is stronger than the horizontal direction.
Fig. 8Acceleration time-history curve of measuring point 3 (left vault)
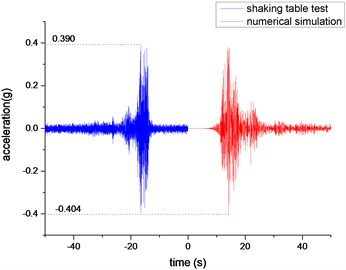
a) Horizontal acceleration time-history curve
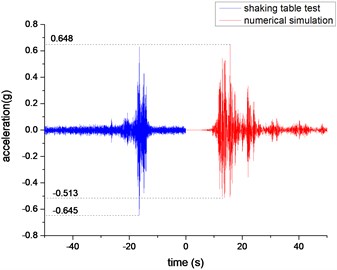
b) Vertical acceleration time-history curve
Fig. 9Acceleration time-history curve of measuring point 4 (right vault)
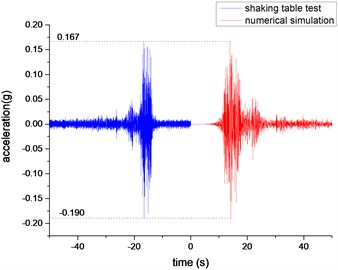
a) Horizontal acceleration time-history curve
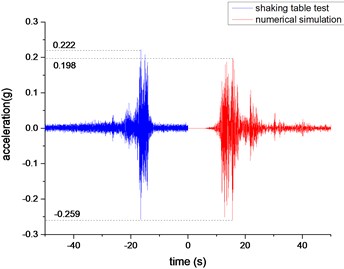
b) Vertical acceleration time-history curve
4.1. Comparative analysis of acceleration response in the horizontal direction
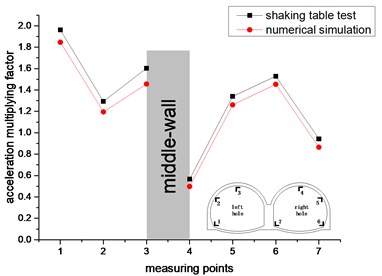
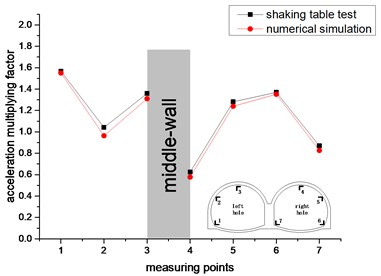
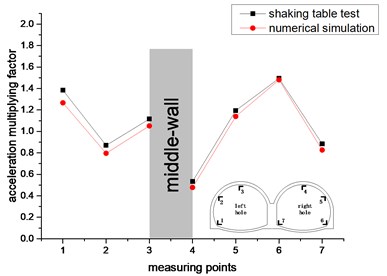
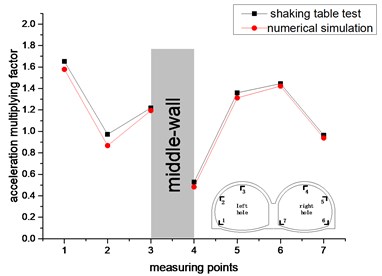
Under loading conditions of different acceleration peaks, the horizontal acceleration amplification factors of each measuring point of the double-arch tunnel in the shaking table test and numerical simulation are shown in Fig. 10.
It can be seen from Fig. 10 that in the horizontal direction, the values and trends of the acceleration amplification factor for the shaking table test and the numerical simulation are similar, and the two agree well. The left hole measurement point is V-shaped (measurement point 1-3), and the right hole measurement point is ∩-shape (measurement point 4-7). The maximum value of the acceleration amplification factor of the measuring point 1 is 1.962. The minimum value of the acceleration amplification factor of the measuring point 4 is 0.478. The acceleration amplification factor of the left-hole arch foot (measuring point 1) is larger than that of the right hole arch foot, and the acceleration amplification factor of the left-hole vault (measuring point 3) is much larger than the right-hole vault (measuring point 4). It shows that the surrounding rock pressure has an influence on the horizontal acceleration response of the double-arch tunnel.
In the shaking table test and numerical simulation, the variation trend and value of the acceleration amplification factor of each measuring point of the double-arch tunnel are in good agreement. The rationality, authenticity and reliability of the horizontal acceleration response law are proved. In the horizontal direction of the excitation wave, the left and right holes are most responsive to the acceleration of the arch foot, and the acceleration amplification factors of the other points are also greater than 1 (except the measurement point 4). It shows that the amplification effect of the double-arch tunnel on the acceleration is strong, and the amplification effect at the arch foot is the largest. Therefore, in the seismic design of double-arch tunnels, reasonable and effective measures should be taken to reinforce the arch foot.
Fig. 10The change trend of acceleration amplification factor in horizontal direction
a) 0.1 g
b) 0.2 g
c) 0.4 g
d) 0.6 g
4.2. Comparative analysis of acceleration response in vertical direction
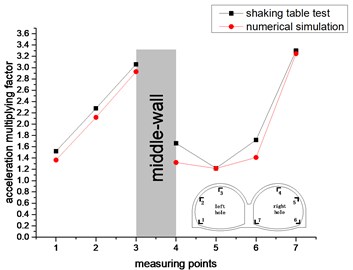
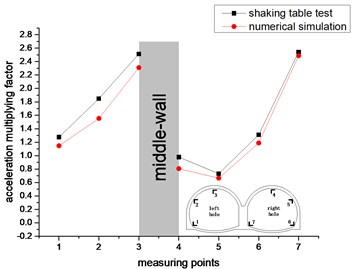
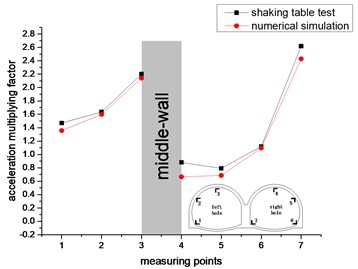
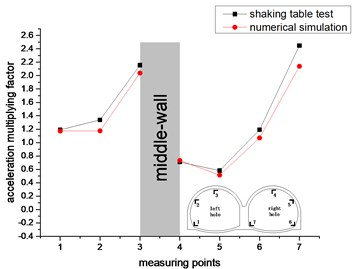
Shaking table test and numerical simulation under the loading conditions of different acceleration peaks, the variation law of the vertical acceleration amplification factor of each measuring point for the double-arch tunnel is shown in Fig. 11.
As shown in Fig. 11. In the vertical direction, the values and trends of the acceleration amplification factor for the shaking table test and the numerical simulation are similar. This shows that the test is very consistent with the numerical simulation. The acceleration amplification factor of the left hole appears to increase continuously (measurement points 1 to 3), and the right hole shows a trend of decreasing first and then increasing continuously (measurement points 4 to 7). The maximum value of the acceleration amplification factor for the measuring point 7 is 3.3, and the minimum value of the acceleration amplification factor for the measuring point 5 is 0.514. The acceleration amplification factor of measuring point 4 and measuring point 5 is less than 1 under partial working conditions, and the acceleration amplification factors of the remaining measuring points for the double-arch tunnel are greater than 1, wherein the acceleration amplification factors that the vault of left hole and middle-wall are greater than 2. It shows that the double-arch tunnel has a strong amplification effect on the vertical seismic acceleration, which should be paid enough attention in the seismic design. Under the four loading peak conditions, the acceleration amplification factors of each working condition have similar trends. The vertical centerline of the middle-wall of the double-arch tunnel is regarded as the axis of symmetry, and the acceleration amplification factor for the vault and the spandrel of the left hole are much larger than that in the right hole. The reason is that the soil of the left hole is heavy and the load on the lining is large.
It can be seen from Fig. 10 and Fig. 11 that the acceleration response of the double-arch tunnel in the vertical direction is more severe than the horizontal direction. It may be that the seismic inertial force in the vertical direction causes the tunnel structure to have an “up throwing effect”, so that the acceleration response in the vertical direction is large.
Fig. 11The change trend of acceleration amplification factor in vertical direction
a) 0.1 g
b) 0.2 g
c) 0.4 g
d) 0.6 g
The acceleration amplification factor of the shaking table test and the numerical simulation agree well in the horizontal and vertical directions, but the numerical values of the amplification factors are slightly different. The main reasons are as follows: (1) The test results are susceptible to various factors when performing the shaking table test, such as the ratio of the mortar and the compaction for the surrounding rock. However, in the process of numerical simulation, the influence of such conditions is small. (2) Surrounding rock contains various structural planes and fissures under actual conditions and is a discontinuous material. In numerical simulation, surrounding rock is regarded as a continuous material. (3) In the test method, test instrument and test operation, there are inevitable systematic errors and accidental errors. It is generally believed that the error of the value for the shaking table test and the numerical simulation is within an order of magnitude and is considered reasonable [15]. It can be seen from Table 4 and Table 5 that the error between the value of the shaking table test and the value of the numerical simulation is small, within the allowable range, and the variation laws of the two are similar. From the mutual verification of the shaking table test and the numerical simulation, the results of the shaking table test are reasonable, and the results of the numerical simulation are reliable.
Table 4Acceleration peak value in horizontal direction (m/s2)
Measuring points | 0.1 g | 0.2 g | 0.4 g | 0.6 g | ||||
STT | NS | STT | NS | STT | NS | STT | NS | |
1 | 2.04 | 1.97 | 2.95 | 2.81 | 4.80 | 4.67 | 7.67 | 7.38 |
2 | 1.34 | 1.28 | 1.96 | 1.89 | 3.02 | 2.90 | 4.52 | 4.40 |
3 | 1,67 | 1.60 | 2.56 | 2.48 | 3.87 | 3.68 | 5.66 | 5.46 |
4 | 0,59 | 0.58 | 1.18 | 1.12 | 1.85 | 1.81 | 2.45 | 2.40 |
5 | 1.39 | 1.36 | 2.41 | 2.33 | 4.15 | 3.99 | 6.32 | 6.05 |
6 | 1.59 | 1.52 | 2.58 | 2.47 | 5.18 | 5.03 | 6.71 | 6.43 |
7 | 0.89 | 0.96 | 1.64 | 1.60 | 3.07 | 2.96 | 4.48 | 4.36 |
Note: STT: Shaking table test, NS: Numerical simulation | ||||||||
Table 5Acceleration peak value in vertical direction (m/s2)
Measuring points | 0.1 g | 0.2 g | 0.4 g | 0.6 g | ||||
STT | NS | STT | NS | STT | NS | STT | NS | |
1 | 0.74 | 0.72 | 1.72 | 1.66 | 4.22 | 4.14 | 5.61 | 5.45 |
2 | 1.12 | 1.09 | 2.50 | 2.45 | 4.69 | 4.49 | 6.31 | 6.07 |
3 | 1.50 | 1.45 | 3.40 | 3.30 | 6.32 | 6.04 | 10.16 | 9.83 |
4 | 0.81 | 0.80 | 1.32 | 1.29 | 2.53 | 2.41 | 3.34 | 3.22 |
5 | 0.60 | 0.58 | 0.99 | 0.95 | 2.27 | 2.20 | 2.74 | 2.61 |
6 | 0.84 | 0.81 | 1.77 | 1.69 | 3.21 | 3.07 | 5.62 | 5.42 |
7 | 1.62 | 1.55 | 3.44 | 3.32 | 7.52 | 7.28 | 11.54 | 10.97 |
Note: STT: shaking table test, NS: numerical simulation | ||||||||
4.3. Comparison of bias and non-bias for double-arch tunnels
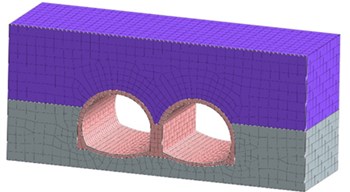
In order to further study the acceleration response law of shallow-buried biased double-arch tunnels. Based on the reliability of numerical simulation results, the three-dimensional shallow-buried unbiased double-arch tunnel model was established by MIDAS GTS NX finite element software (The boundary conditions, cell dimensions and measuring points of the model are consistent with the previous biased double-arch tunnel model), and the model was subjected to nonlinear time-history analysis. The three-dimensional model is shown in Fig. 12.
Fig. 12Numerical simulation model for unbiased
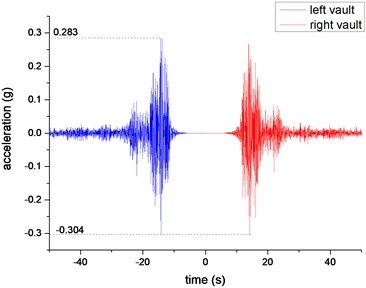
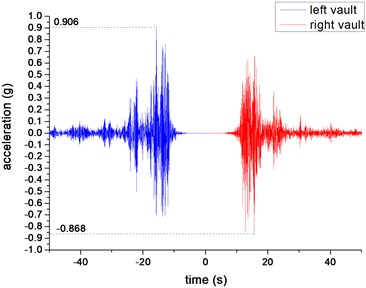
From the comparative analysis of shallow-buried double-arch tunnels under both biased and unbiased states, the acceleration response law of double-arch tunnels can be obtained. Due to space limitations, this paper only gives the time-history curve of the measuring point 3 (left hole vault) and measuring point 4 (right hole vault) under non-bias when the excitation peak is 0.4 g (WC-XZ-3), as shown in Fig. 13.
Fig. 13Time-history curves of measuring points 3 and 4
a) Time-history curve in horizontal direction
b) Time-history curve in vertical direction
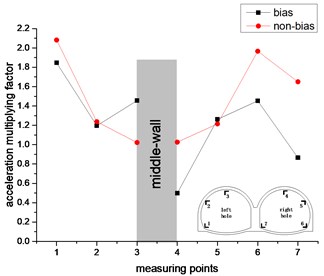
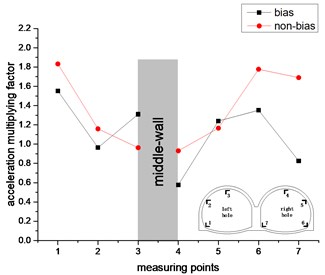
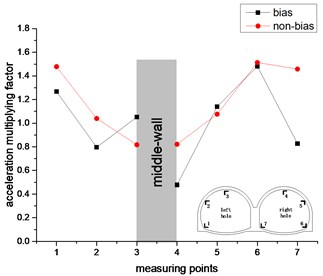
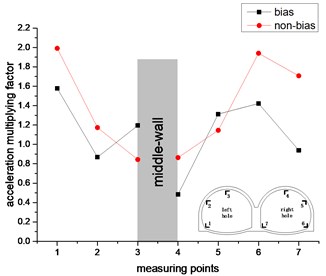
As can be seen from Fig. 14, in the horizontal direction, the acceleration amplification factor for the arch foot and the spandrel of the left hole is greater than the bias state in the unbiased state, and the acceleration amplification factor of the vault is greater than the non-bias state in the bias state. In the biased and unbiased states, the difference in the amplification factor of the spandrel of the right hole is small.
Fig. 14The change trend of acceleration amplification factor in horizontal direction
a) 0.1 g
b) 0.2 g
c) 0.4 g
d) 0.6 g
However, the acceleration amplification factor of the remaining measurement points for the right hole in the non-bias state is generally greater than the acceleration amplification factor under the bias state. In the non-biased state, the acceleration amplification factor of the measurement point of the left hole continues to decrease, and the acceleration amplification factor of the measurement point of the right hole continues to rise and then fall, and there is no such rule under the bias state. It can be seen from the comparison between the left and right holes that the acceleration amplification factors of the left and right holes are symmetrically distributed in the non-biased state, but there is no such rule under the bias state. It can be seen that the bias has a great influence on the acceleration response of the double-arch tunnel. In the two states of bias and non-bias, the most intense part of the horizontal acceleration response of the double-arch tunnel is the arched foot, which should be paid special attention in the seismic design.
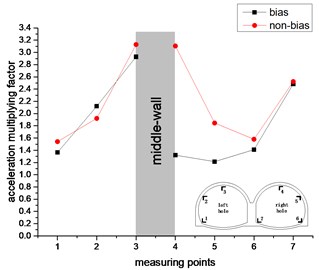
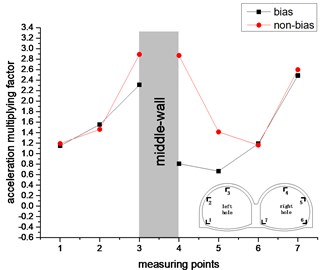
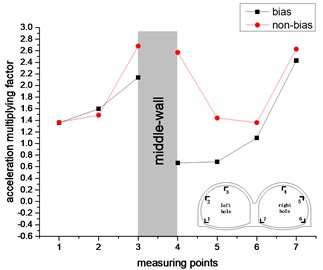
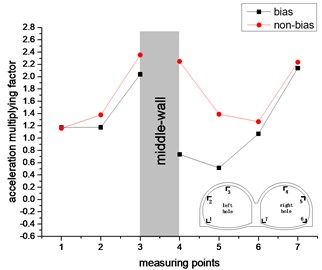
As can be seen from Fig. 15. In the vertical direction, the acceleration amplification factor of the left hole tends to increase continuously, while the acceleration factor of the right hole exhibits a U-shape in the unbiased state and continues to increase in the bias state. The acceleration factor of the left hole is the largest in the vault. The right hole also has the largest response to the vault in the unbiased state, but the response of arch foot is maximized under bias conditions. The trend and value of the acceleration amplification factor of the left hole are similar in the biased and unbiased states. The difference in the right hole is larger, and the difference in the vault is most obvious. It shows that the slope has a great influence on the acceleration response of the right hole. In the non-biased state, the acceleration amplification factors of the left and right holes are symmetrically distributed, while in the bias state, the right hole has no such rule. It can be seen that the bias has a great influence on the acceleration response of the right tunnel of the double-arch tunnel. The middle-wall has a large vertical acceleration response in both the biased and unbiased states.
Fig. 15The change trend of acceleration multiplying factor in vertical direction
a) 0.1 g
b) 0.2 g
c) 0.4 g
d) 0.6 g
It can be seen from comparison between Fig. 14 and Fig. 15. The point where the horizontal acceleration response is the strongest is the arch foot, and the point where the vertical acceleration response is the strongest is the vault. Compared with the bias state, the acceleration response laws of the double-arch tunnel in the non-biased state are better. It shows that the bias has a great influence on the acceleration response of the double-arch tunnel. Regardless of the biased and unbiased states, the horizontal acceleration response law of the double-arch tunnel is quite different from the vertical acceleration response law. Therefore, it should be considered separately in the seismic design of the double-arch tunnel.
5. Conclusions
This paper uses a combination of shaking table test and numerical simulation. Taking Wenchuan wave as the loading wave, the acceleration response law of shallow-buried biased double-arch tunnel under different acceleration peaks is studied. Moreover, the influence of unbiased and biased on the acceleration response law of shallow buried double-arch tunnel is discussed. The following conclusions were obtained:
1) Compared with the horizontal direction, the acceleration response of the double-arch tunnel in the vertical direction is large. It indicates that the incident direction of the seismic wave has a great influence on the acceleration response of the double-arch tunnel.
2) The horizontal acceleration amplification factor of the left-hole (non-biased side) of the shallow-buried biased double-arch tunnel is V-shaped, and the right-hole (bias side) is ∩-shaped. The vertical acceleration amplification factor of the left hole increases continuously, and the right hole decreases first and then continues to increase.
3) Compared with the bias double-arch tunnel, the regularity of the unbiased double-arch tunnel is better, indicating that the bias has a greater influence on the acceleration response of the double-arch tunnel.
4) The error between the shaking table test and the numerical simulation is within a reasonable range, and the overall trend of the acceleration amplification factor is similar. The two can be mutually verified, which proves the rationality of the results for the shaking table test and the reliability of the numerical simulation.
5) Regardless of the biased and unbiased states, the horizontal acceleration response and the vertical acceleration response for the double-arch tunnel are quite different. This should be considered separately when designing the seismic shock absorption of a double-arch tunnel.
References
-
Chen J., Jiang L., Li J., et al. Numerical simulation of shaking table test on utility tunnel under non-uniform earthquake excitation. Tunnelling and Underground Space Technology, Vol. 30, 2012, p. 205-216.
-
Fu X., Bi J. W., Wang Z. J., et al. Shaking table test of underground pipeline under three dimension seismic excitation – numerical simulation. Advanced Materials Research, Vol. 919, Issue 921, 2014, p. 960-964.
-
Chen J., He W., Song C., et al. Seismic response of segmental lining tunnel by using shaking table test and numerical simulation. Proceedings of GeoShanghai 2018 International Conference: Advances in Soil Dynamics and Foundation Engineering, 2018, p. 261-269.
-
Jiang X., Wang F., Yang H., et al. Dynamic response of shallow-buried small spacing tunnel with asymmetrical pressure: shaking table testing and numerical simulation. Geotechnical and Geological Engineering, Vol. 36, Issue 4, 2018, p. 2037-2055.
-
Rabeti Moghadam M., Baziar M. H. Seismic ground motion amplification pattern induced by a subway tunnel: Shaking table testing and numerical simulation. Soil Dynamics and Earthquake Engineering, Vol. 83, 2016, p. 81-97.
-
Yang Bo, Zheng Yingren, Lai Jie, et al. Shaking table model test and numerical modeling for tunnels traversing faultage. The Open Civil Engineering Journal, Vol. 9, 2015, p. 789-798.
-
Li Lin, He Chuan, Geng Ping, et al. Study of shaking table model test for seismic response of portal section of shallow unsymmetrical loading tunnel. Chinese Journal of Rock Mechanics and Engineering, Vol. 30, Issue 12, 2011, p. 2540-2548.
-
Meymand P. J. Shaking Table Scale Modeltests of Nonlinearsoil-Pile-Superstructur Interaction in Soft Clay. University of California, Berkeley, 1998.
-
Iai S. Similitude for shaking table tests on soil-structure-fluid model in 1 gravitational field. Soils and Foundations, Vol. 29, Issue 1, 1989, p. 105-118.
-
Xu Bing-Wei, Jiang Xin-Liang Soil chamber design of shaking test table for large-scale soil-pile-complex structure interaction. Journal of Tianjin University, Vol. 43, Issue 10, 2010, p. 912-918.
-
Lombardi D., Bhattacharya S., Scarpa F., et al. Dynamic response of a geotechnical rigid model container with absorbing boundaries. Soil Dynamics and Earthquake Engineering, Vol. 69, 2014, p. 46-56.
-
Chen Guo-Xing, Wang Zhi-Hua, Zuo Xi, et al. Development of laminar shear soil container for shaking table tests. Chinese Journal of Geotechnical Engineering, Vol. 1, 2010, p. 89-97.
-
Jiang Xueliang, Zhu Zhonglin, Yang Hui, et al. Study on dynamic response characteristics of rock slope with tunnel under earthquake. Journal of Natural Disasters, Vol. 25, Issue 2, 2016, p. 94-102.
-
Wang Feifei, Jiang Xueliang, Yang Hui, et al. Tests and numerical simulation for acceleration response laws of a shallow buried small spacing tunnel with asymmetrical pressure. Journal of Vibration and Shock, Vol. 36, Issue 17, 2017, p. 238-247.
-
Yang Guolin, Shen Quan, Yang Xiao, et al. Numerical and experimental study on amplification coefficient of acceleration of retaining structures of bedrock and overburden layer slopes. Chinese Journal of Rock Mechanics and Engineering, Vol. 34, Issue 2, 2015, p. 374-381.
Cited by
About this article
This work was supported by the National Natural Science Foundation of China (Grant Nos. 51204125, 51404309); The Hunan Provincial Natural Science Foundation (Grant No. 2018JJ3882).

