Abstract
Vehicle lightweighting has been considered as one of the most important solutions to improve fuel economy and reduce harmful emissions. Considering the PowerTrain System (PTS) lightweighting of a heavy-duty truck tractor, cast iron of which the transmission shell was made is replaced with aluminum. Such weight reduction caused the irrationality of the natural frequency matching and the vehicle NVH performance become worse. In order to evaluate the influence of PTS lightweighting on the vibration and noise, the theoretical analysis and experimental tests have been done. The Genetic Algorithm (GA) method was adopted for the Powertrain Mounting System (PMS) optimization. Considering the installation position of PMS, the limitations of package space, cost and available time, the mounting stiffness was chosen as the design variables. One combination of the main vibration energy distribution of PMS was selected as the objective function of optimization design. After optimization, the vehicle experimental study was carried out to investigate the vibration and noise performance of the PMS at idle and Whole Open Throttle (WOT). The test results show that the optimization of PMS had a significant improvement on the vehicle vibration and noise performance.
1. Introduction
The advancement of society and development of technology bring the convenience of people’s life along with the daily raising fuel crisis and environment pollution. The research done by the Intergovernmental Panel on Climate Change (IPCC) shown that the transportation sector accounted for 27 % of total world energy use, produced 6.7 Gt-CO2 direct emissions and represented 14 % of GHG (global greenhouse gas) emissions, 7.0 Gt-CO2-eq [1]. Moreover, road transportation dominated among the overall transportation sector CO2 emissions [2]. As a significant contributor to the global environmental impact, and more specifically greenhouse gas emissions, the automotive industry's current position is clearly unsustainable, and also less and less acceptable to modern environmentally aware societies. In recent years, there have been growing concerns over fuel consumption and pollution caused by the increasing number of automobiles, and the automotive industry was under great pressure to reduce fuel consumption and emissions [3-6].
For road transportation, vehicles have shown themselves as being the most carbon-intensive means of personal transportation on land while road freight is the dominant medium for goods transportation throughout the world without any question. Especially, many researchers predict that road freight activity will remain being of underlying importance to the society and economy alike during a long time [6]. Built with extensive use of iron and steel, most road freight transportation relies on internal combustion engine vehicles (ICEVs) and fueled with oil products. Thus, road freight transportation poses a global challenge in terms of energy consumption, GHG and local pollutant emissions.
Vehicle lightweighting has been considered as one of the most important solutions to improve fuel economy and reduce harmful emissions. Joseph and Benedy [7] demonstrated that oil consumption may decrease 6-8 % with the lightweight effect of full vehicle reaches 10 %. This reduction was critical important especially in these days, as the fuel costs were raising, and concerns on the climate change were growing. Generally, lightweighting favors through material substitution, design optimization and adopting other advanced manufacturing technologies. Specifically, the directions of lightweighting are directed towards (1) develop low-density lightweight materials, such as aluminum, carbon fiber, and plastic; (2) apply the CAE to optimize the structure design optimizations to increase the material efficiency; (3) study the material composition to improve the material performance, for instance, the development of high-strength steel. The common used measures for vehicle lightweighting during design were achieved by the applications of a aluminumalloy wheel hub, aluminum fuel tank, aluminum cylinders, little leaf spring replace multiple-leaf spring, rubber suspension, air suspension, high-strength single layer beam instead of dual layers beam, the increase of plastic body exterior trim, and so on. However, except the lightweighting, a vehicle's performance and functionalities, such as occupant or cargo space, vehicle safety, comfort, and acceleration performance should also be considered.
In a vehicle, especially in a heavy-duty truck, the PowerTrain System (PTS) generally consists of an engine, clutch, transmission, and attachments connected to the truck frame by means of mounts. As one of the key sub-system, the PowerTrain System (PTS) which contributes more weight for the vehicle are the predominant source of power and vibration. If the PTS was not properly constrained and isolated, it would cause vibrations in the vehicle frame and other’s system. Thus, the Powertrain Mounting System (PMS) plays an essential role on the noise, vibration, and harshness (NVH) characteristics. The main functions of the PMS can be summarized as (1) to support the powertrain and balance the reaction torque caused by engine driving torque; (2) to prevent the motion of the powertrain (i.e., load such as acceleration, turning, braking, and so on) to the fixed location and to avoid interference with other systems; (3) to depress the vibration of the powertrain under excitation of road and to prevent the vibration of engine transmitted to frame or sub-frame.
The reduction problem of vibration and noise of the Powertrain Mounting System (PMS) becomes a very sensitive and considerable issue in the vehicle design and attained more attention for the development of better mounting methods/devices [8-13]. This requirement becomes even more critical in future vehicles design for an application of high power powertrains with lighter weight and more compact package.
Considering the PTS lightweighting of a tractor of heavy-duty trucks, castiron of which shell of transmission was made was replaced with aluminum. Such weight reduction caused the irrationality of the natural frequency matching and the vehicle NVH performance become worse. In order to evaluate the influence of PTS lightweighting on the vibration and noise, the theoretical analysis and experimental tests have been done. Based on the Modal analysis of PMS, the problem of current PMS was obtained to determine the direction of optimization. The Genetic Algorithm (GA) method was adopted for PMS optimization. Considering the installation position of PMS, the limitations of package space, cost and available time, the mounting stiffness was chosen as the design variables. One combination of the main vibration energy distribution of PMS was selected as the objective function of optimization design. After optimization, the vehicle experimental study was carried out to investigate the vibration and noise performance of the PMS at idle and whole open throttle (WOT).
2. Performance requirements of powertrain mounting system (PMS)
The objective of the powertrain mounting system (PMS) optimization should be clear before realizing any optimization process. The purpose of this research was to decrease the engine vibration transmitted to the vehicle frame as well as the transmission of shock excitation caused by sudden acceleration and deceleration, braking and riding on uneven roads to the engine.
To obtain a low transmissibility, the natural frequency of PMS should be as low as possible at a low frequency range; a mount with higher damping was needed. Meanwhile, lighter damping was also desirable at a high frequency range.
To isolate the vibration caused by the engine-unbalanced disturbances, the natural frequency of the PMS in a certain direction should not exceed 1/√2 times of the disturbance frequency of the engine idle speed to avoid excitation of PMS resonance during normal driving conditions. The disturbance frequency correlated to engine speed depended on the numbers of stroke and cylinder of the engine and engine speed. For a four-stroke engine with six cylinders, the fundamental disturbance frequency was at the third order of the engine speed. The frequency range was 30-110 Hz with an engine speed range from 600 to 2200 rpm. Thus, the natural frequency of PMS should less than 21.2 Hz.
Furthermore, the value of natural frequency should larger than 4/3 times of the frequency value of road excitation (normally with a value less than of 3 Hz) to avoid the vibration at a low frequency range. Considering both the natural frequencies of mounting system are located at a low frequency range and very close to 5 Hz, it can be easily inferred that the natural frequency range of PMS should be 5 Hz to 21.2 Hz from the above discussion.
3. Theoretical analysis of powertrain mounting system (PMS)
A Powertrain Mounting System (PMS) of tractor usually was supported by four rubber mounts. The PMS performance was affected both by the performance of individual mounts and by the entire mounting system. In the PMS design, one of the major considerations was to decouple the system modes. Generally, the initial design of PMS was based on the engineer’s experience. And then, several procedures were followed to optimize the system to satisfy the majority of the vehicle performance goal.
To establish the theoretical analysis model, the following approximations and simplifications were made:
1) The PMS had small displacements around its equilibrium position.
2) The PMS was represented by a rigid body.
3) The powertrain was supported by rubber mounts with negligible rotational stiffness as compared to the translational stiffness (i.e., ku, kv, kw).
4) The moment and productofinertia were considered to be constant.
5) The frame of tractor may be modeled as rigid termination.
6) Some connections of wire/pipe and the attachments to the engine were ignored.
3.1. Equation of PMS motion
Fig. 1 illustrates the Powertrain mount system (PMS) analyzed in this research, which composed of an engine, clutch and transmission and connected to the rigid frame by four-point rubber mounts. The fixed global coordinate system Goxvz with the origin o located at the center of gravity (CoG) of the PMS, when it is in static equilibrium, is used in the following sections. The x-axis is parallel to the driving direction of tractor, the z-axis is in the vertical direction, and the y-axis is determined by right-hand rule. The four-point rubber mounts shown in Fig. 2 are modeled as springs with a constant value of stiffness coefficient and damping in each of three principal directions, respectively.
Fig. 1Powertrain mounting system with Six-DOFs
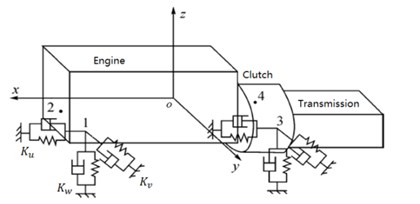
Due to a much higher value of natural frequency of the PowerTrain System (PTS) as compared with the value of mounting, it is reasonable to model the PTS as a rigid body with six degree of freedoms (DOFs) including translation in any of three directions and rotation about any of the axes respectively.
Using the assumptions above and the Lagrange principle, the equation of the motion of system may be written as:
Here, [M] is the 6×6 mass matrix of the system; {x}, {˙x}, {¨x} are the 6×1 matrix which represent displacement, velocity and acceleration vectors at the CoG of PTS, respectively; [K] and [C] represent a 6×6 complex stiffness matrix and 6×6 viscous damping matrix of the system, whose elements can be found from references [14], respectively.
3.2. Theory of decoupling
The vibration coupling can be defined as the responses along two or more directions occurred simultaneously when under one direction excitation. Meanwhile, decoupling of the PMS is to make the mode of vibration mutual-independent to each other along different directions. The coupled modes can both make the PMS dynamic property hard to control and give a great challenge for the design and double check.
Based on conservation of energy, it is can observed that principal modes of each order are mutually independent to satisfy the orthogonality. Referring to Eq. (1), we assume a principal modal matrix [ϕ]=[φ(1),φ(2),φ(3),φ(4),φ(5),φ(6)] to consist of all principal modes together with the modal orthogonality relations, it can be derived as:
Here, [M] is also called as inertial coupling (mass) matrix while [K] is named as elastic coupling (stiffness) matrix. It is clear that the [M]pand [K]p are diagonal. Excitation along (or around) a parallel direction only excites one translational (or rotational) response along (or around) its own direction. Thus, the PMS is uncoupled.
From the above discussion, it is known that the degree of coupling modes reaches minimum if all the non-diagonal elements of the stiffness matrix and damping matrix are zero. For engineering physical problem, it is reasonable to search for an appropriate coordinate system to minimize the degree of coupling modes. It is feasible in the theory analysis by selecting the principal coordinates to make the mass and stiffness matrixes complete diagonalization and then get the modes completely decoupled. However, in practice it is impossible to obtain complete decoupling of modes due to the packaging space, geometric symmetry and other constraint condition. What we can do for the PMS design is trying to achieve the “best” decoupling modes.
In practical application, several decoupling techniques are listed as follows:
1) To minimize the inertial coupling and elasticity coupling by selecting appropriate principal coordinate systems.
2) To adjust the locations, orientations, shapes and stiffness rates to decouple the elastic matrix.
Especially for the selection of mount locations, the ratio of the vertical stiffness of front mount to that of the rear mount should satisfy the following ratio in order to ensure the decoupling of the vibration around horizontal axes and parallel transition up and down:
where, Kf represents the vertical stiffness of front mount while Kr represents the vertical stiffness of rear mount; Lf represents the distance from the center of gravity (CoG) of the PowerTrain System (PTS) to the front mount; Lr represents the distance from the CoG of the PTS to the rear mount.
3) To make the elastic axes through the CoG of PMS and try to match the elastic axes to the inertial principal axes to make the complete decoupling of system. The complete decoupling of roll modal can be achieved by adjusting the orientation angle to make the plane between the front and rear mounts perpendicular to the roll axes and to make the elastic center located at roll axes.
4) In the CoG, the energy of the principal vibration in each order of the mounting system is concentrated in all six directions. Based on the mass matrix [M] and the modal matrix [ϕ], the energy percentage of vibration in all direction can be calculated when the principal vibration of the mount system at each mode occurred. Written in matrix form, the energy distribution matrix of system can be obtained. When the vibration of the system in the ith natural frequency occurred, the energy percentage in the kth generalized coordinate can be expressed as follows:
Here, ϕ(k,i) and ϕ(l,i) are the k element and l element of the i-order principal mode, respectively; M(k,l) is the element of the system mass matrix located in the k row and k column; k,i,l= 1-6, respectively. When dig(k,i)= 100 %, it denotes that all the vibration energy of the i modal vibration focuses on the k generalized coordinates. No vibrations in other coordinates and freedoms occurred. That is to say the decoupling is realized at the view of energy.
4. Computational analysis of powertrain mounting system (PMS)
Definition of a near optimum initial PMS is not an easy task due to the complex nature of the system inertia properties and the packaging constraints on the mount locations as imposed by manufacturability considerations [15, 16]. It is very time consuming to design an engine mounting system only based on the experimental method during vehicle development. The software of ADAMS was used for a numerical analysis before an experimental test to accelerate the design development. Based on the numerical analysis, the Sequential Quadratic Programming (SQP) method was adopted for the optimization.
4.1. ADAMS modeling of PMS
The powertrain mount system is a very complex system. Based on the approximations and simplifications listed in section 3.1, the ADAMS model was established as show in Fig. 2.
Fig. 2ADAMS model
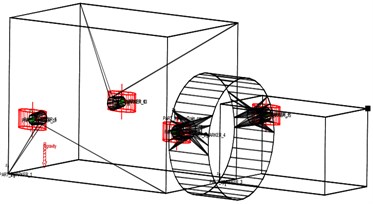
In this paper, a tractor powertrain is supported by four rubber mounts, and the position is parallel with VCS: Front Right Mount (FRM), Front Left Mount (FLM), Rear Right Mount (RRM) and Rear Left Mount (RLM). Based on the lightweight, a Cast iron shell transmission was replaced with an aluminum shell one; the reduction of weight is approximately 180 kg. The mass and inertial parameters of the PowerTrain System (PTS) are listed in Table 1. The Center of Gravity (CoG) for powertrain and the locations of mounts in the VCS are listed in Table 2.
Table 1Mass and inertial parameters of powertrain in LCS
M (kg) | Ix (kg∙mm2) | Iy (kg∙mm2) | Iz (kg∙mm2) |
1180 | 7,14E+07 | 3,95E+08 | 3,56E+08 |
Ixy (kg∙mm2) | Iyz (kg∙mm2) | Izx (kg∙mm2) | |
2,30E+06 | –5,7E+05 | 5,22E+07 |
Table 2The CoG of powertrain and mount locations in VCS (mm)
Object | X | Y | Z |
PT CoG | 3240 | 7.4 | 1052 |
FL Mount | 2499 | 425 | 1026 |
FR Mount | 2499 | –425 | 1026 |
RL Mount | 3597 | 425 | 1054 |
RR Mount | 3597 | –425 | 1054 |
For rubber mounts, the stiffness depends on preload, excitation amplitude and frequency, and temperature [17-18]. With the increase of frequency, the dynamic stiffness is increased. And the dynamic stiffness varies much faster at a lower frequency as compared with the one at a higher frequency. The dynamic stiffness has a smaller value at higher dynamic amplitude but a larger value at smaller dynamic amplitude. The dynamic stiffness varies with the change of preload. Generally, the dynamic stiffness is larger than the static stiffness. The dynamic stiffness coefficient (i.e., the ratio of dynamic stiffness to static stiffness) is around 1.2 to 3, sometimes it may exceed 3. The parameters of static stiffness and coefficients of dynamic stiffness obtained by test are listed in Table 3.
Table 3Mount stiffness in LCS
Items mount | Ku (N/mm) | Kv (N/mm) | Kw (N/mm) | Damping coefficient | Stiffness coefficient |
Front mount | 345 | 150 | 500 | 0.03 | 1.65 |
Rear mount | 1634 | 542 | 956 | 0.03 | 2.3 |
For the NVH analysis of vehicle, especially of the heavy-duty truck, the natural frequencies and mode energies for the powertrain are very important parameters to evaluate the NVH characteristic. The natural frequencies and mode energies for the powertrain systems using the models with 6 DOFs are shown in Table 4. It is seen from Table 4 that the natural frequencies in the roll direction is 28.50 Hz which is very close to the excite frequency of engine with a value of 30 Hz. It is easy to cause resonance and further make the NVH performance become worse. The coupling was existed in all the modal energies. At all the modal frequencies, the efficiency of decoupling in all the principal directions was lower with a maximum value of 77.4 % in the Y direction at the frequency of 8.93 Hz. The optimization of PMS is needed to be done to decrease the natural frequency less than 21.2 Hz and to increase the efficiency of energy decoupling.
Table 4Natural frequencies (Hz) and modal energy of powertrain (%)
Modes / Hz | X | Y | Z | Roll | Pitch | Yaw |
28.50 | 3.2 | 2.3 | 4.3 | 67 | 2.5 | 19.7 |
17.68 | 74 | 2.4 | 6.6 | 3 | 8.4 | 6.6 |
15.61 | 3.4 | 8.3 | 3.2 | 10.9 | 0.1 | 74.1 |
14.24 | 3.5 | 4 | 55 | 0 | 35.3 | 2.2 |
12.63 | 13.1 | 5 | 24.4 | 3.1 | 50.1 | 4.3 |
8.93 | 3 | 77.4 | 0 | 5.1 | 2 | 12.5 |
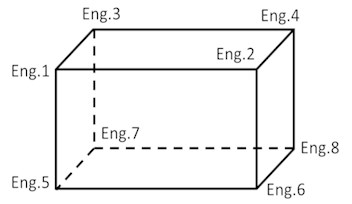
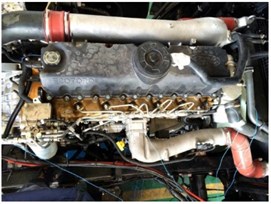
The modals of Powertrain Mount System were tested by experimental modal analysis method in the vehicle. The arrangement of sensors could be seen in Fig. 3. The natural frequencies of simulation value and testing value were shown in Table 5. The test modals of Z direction and roll direction were shown in Fig. 4. The comparison in Table.5 shows reasonable agreement for the frequencies between the simulation and experimental results. The agreement also confirmed the validity of the simulation model used for the optimization.
Table 5The natural frequencies of simulation value and test value
Roll | X | Yaw | Z | Pitch | Y | |
Simulation value | 28.50 | 17.68 | 15.61 | 14.24 | 12.63 | 8.93 |
Test value | 28.0 | – | 16.2 | 15.4 | 13.6 | 10.2 |
Fig. 3The arrangement of sensors in engine
a)
b)
Fig. 4Experimental test modals
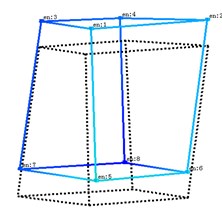
a)Z direction
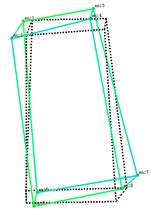
b) Roll direction
4.2. Optimization
To increase the efficiency of energy decoupling and to make the natural frequency meet the requirement of frequency matching, a Genetic Algorithm (GA) method was adopted for the PMS optimization.
4.2.1. Genetic algorithm (GA) method [19, 20]
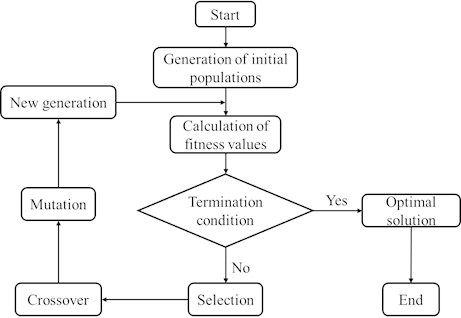
The Genetic Algorithm (GA) is a probabilistic global search method which mimics the process of natural biological evolution. Usually, the evolution begins with an initial population of randomly generated individuals. This evolution is an iterative process with the population in each iteration called a generation. In each generation, a fitness value solved from the objective function in the optimization problem is associated with each individual to evaluate the performance of the related solution. Each candidate individual (called solution) has a set of properties which can be mutated and altered. A standard representation of each candidate solution is as an array of bits. Once the genetic representation and the fitness function are defined, a GA proceeds to initialize a population of solutions and then to improve it through repetitive application of the selection, crossover, and mutation operators until a globally optimal solution is achieved. The process of GA is illustrated in Fig. 5.
Fig. 5Flow chart of genetic algorithm(GA)
4.2.2. Object function
One combination of the main vibration energy distribution of powertrain mount system was selected as the objective function of optimization design, denoted as:
Here, F(x) is the object function with the weighted sum of the decoupling index Fi(x) in each coordinate direction of the mounting system, αi is the weighting coefficient.
4.2.3. Design variables
Optimization of a Powertrain Mounting System (PMS) for vibration control includes the selection of stiffness and shape of individual mount and adjustment of placement and orientations in order to minimize the transfer of vibration from the PowerTrain System (PTS). Considering the installation position of PMS, limitations of package space, cost and available time, the mounting stiffness were chosen as the design variables. Due to the approximate symmetry around the xz-plane, only the stiffness of front and rear mount (i.e., xi=Kuf, Kvf, Kwf, Kur, Kvr, Kwr) is considered.
4.2.4. Constraint equation
The objective of optimization in this paper is to tune all the natural frequency of the PMS to the desired range (i.e., 5 Hz-21.2 Hz is shown in Section 1) to avoid resonance and to decouple each modes of vibration through dynamic analysis and optimization.
Subject to:
4.2.5. Optimization process
Combined with the content of our research, a detailed process is given as follows:
Step 1. Initialization: Considering the design variable 0<max(Kij)<211, each design variable xi of integer string is converted into an 11-bit binary number before these processes are performed. Then the binary substrings of six design variables are composed to one 66-bit candidate solution.
Step 2. Generation of initial populations: The initial population (called individual) is randomly generated. And then, N populations forms one generation “S” as the initial iteration.
Step 3. Calculation of fitness values: The fitness function represents the quality of the individual. The fitness function for the problem listed in this paper can be defined as:
here Cmax is the maximum estimated value of the objective function F(x).
Step 4. Selection: Apply the selection operator to the generation to select a relative better “parent” solutions breeding.
Step 5. Crossover: Apply the crossover operator to the generation to transform part chromosome of each individual randomly with certain crossover probability.
Step 6. Mutation: Apply the mutation operator to the generation to select some genes in an individual randomly and changing them within the respective acceptable range.
Step 7. Termination condition: when the value of genetic generation less than the value of the maximum generation, turn to step 2 repeated the following process. The process is terminated when the value of genetic generation larger than the value of the maximum generation. The individual with the maximum fitness is considered as the optimal solution.
The control parameters of GA refer to the population size, probability of crossover, and probability of mutation. These control parameters have been studied and obtained by varying them in the GA convergence process and are given in Table 6.
Table 6Parameters of GA
Control parameters | Illustration |
Initialization | Binary |
Selection method | Roulette |
Crossover method | Random multipoint crossover |
Mutation method | Disperse multipoint mutation |
Population size | N= 100 |
Crossover probability | 0.9 |
Mutation probability | 0.01 |
Evolution generation | 300 |
4.2.6. Optimization results
Using the GA method and MATLAB program, the optimized results are summarized in Table 7 and Table 8. Table 7 shows the optimized mount stiffness in a Local Coordinate System (LCS). Table 8 shows the optimized results of natural frequency and mode energy distribution. It can be seen from Tab.8 that the maximum natural frequencies are 21.1 Hz (roll direction) which meet the target value range (5 Hz-21.2 Hz) presented in Section 1. Specially, the efficiency of decoupling at that frequency was reached 96.4 % in the roll direction. Most modes except the modes along Z direction and pitch direction are well decoupled. Considering that the frequency in the Z and pitch direction is lower and far from the engine excitation, the optimization result is accepted. Next, a series of experimental test are performed to evaluate the vehicle performance after optimization.
Table 7Optimized mount stiffness (N/mm) in LCS
Items mount | Ku (N/mm) | Kv (N/mm) | Kw (N/mm) | Damping coefficient | Stiffness coefficient |
Front mount | 321 | 108 | 470 | 0.03 | 1.65 |
Rear mount | 1563 | 334 | 912 | 0.03 | 2.3 |
Table 8Natural frequencies (Hz) and mode energy for optimization solution
Modes / Hz | X | Y | Z | Roll | Pitch | Yaw |
21.0 | 0.0 | 0.3 | 0.0 | 96.4 | 0.0 | 3.3 |
13.4 | 89.9 | 0.0 | 1.0 | 0.1 | 8.6 | 0.5 |
12.0 | 0.3 | 1.8 | 7.5 | 3.0 | 8.4 | 78.9 |
11.3 | 8.5 | 0.3 | 15.9 | 0.7 | 69.5 | 5.1 |
8.8 | 1.6 | 0.0 | 70.0 | 0.0 | 26.4 | 0.0 |
6.7 | 0.0 | 97.4 | 0.0 | 0.1 | 0.0 | 2.5 |
5. Experimental studies
The experimental study was carried out on the Powertrain Mounting System (PMS) of a tractor. The LMS vibration testing apparatus was adopted to investigate the vibration performance of the PMS after optimization. The PMS before optimization was also tested for comparison. The vibration variation, transmissibility and interior noise were selected to evaluate the effect of optimization. The x-axis is parallel to the driving direction of tractor, the z-axis is in the vertical direction and the y-axis is determined by the right-hand rule.
5.1. Test plan
The purpose of the tests was to determine the improvement of the PMS isolation. Meanwhile, the effects of vibration on the vehicle were studied by the comparisons of vibrations at the steering wheel and seat track before and after optimization. To better evaluate the vibration properties, the idle condition and middle gear (i.e., 7th gear in the total of 12 gears) and whole open throttle (WOT) acceleration condition were tested for illustration. Thus, only the test results at idle and 7th gear WOT acceleration conditions are presented in this paper for analysis. The test plans are as follows:
1) To collect the accelerations of mount and steering wheel at idle condition, the test to be performed with hot engine in parking.
2) To collect the accelerations of mount, steering wheel, and seat track at 7th gear whole open throttle (WOT) condition with engine speed range at 650-2000 r/min.
WOT testing process: First, run vehicle with Hot Engine in 7th gear by cruising at minimum possible engine speed on test road. Second, open throttle fully and accelerate up to 2000 rmp. Third, the initial throttle opening process should be smooth taking about 0.5 sec. Record data from minimum possible engine speed up to maximum speed. Forth, repeat test a minimum of 3 times.
3) The testing apparatus and locations.
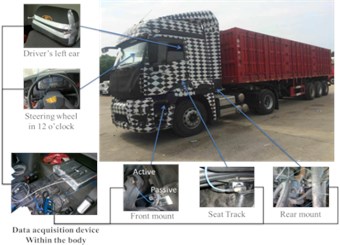
The sensors were set at 12 different points as shown in Fig. 6. Four 3D accelerators were installed in mount bracket of engine side and four 3D accelerators were installed in mount bracket of frame side, one 3D accelerator was installed in 12 o’clock position of steering wheel, one 3D accelerator was installed in seat track, the microphone was installed in driver’s left ear, respectively. The engine speed was also obtained.
Fig. 6Apparatus and sensor location in the tractor
4) Test requirements and conditions.
In order to ensure that test is effective, some test requirements and conditions need to meet before testing in the Table 9.
Table 9Test requirements and conditions
Items | Requirements | |
Check vehicle | Tire pressures | 8.0 bar/800 kPa |
Fluid levels | Meet design status | |
Fuel tank | ¾ Full - Full | |
Air conditioning | Off | |
Squeaks and rattles | Eliminate squeaks and rattles | |
Wheel balance | Meet limits | |
Others function | Normal | |
Load condition | Laden | 43 t |
Mass distribution | Rated loads on any axle should not be exceeded. | |
Road condition | Test track | Smooth road and dry |
Surfaces | To be clear of snow, dirt, gravel and other debris | |
Ambient conditions | Air temperature | –5 °C-35 °C |
Wind speed | Steady State ± 3 km/h | |
Environmental noise conditions | Other vehicles | Should not be running in the vicinity of the test vehicle. |
Ambient noise | As measured at the test microphone should be10 dB lower than the level of the measured signal through the frequency range specified for analysis | |
5.2. Results and discussion
5.2.1. Vibration analysis of mount and steering wheel at idle
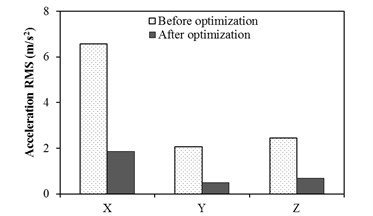
The test results of mount and steering wheel before and after optimization at idle are summarized in Fig. 7 and Table 10, respectively. Here, active in Table 10 represents the engine side and passive represents the frame side. It is seen from Fig. 7 that the vibration accelerations of steering wheel after optimization decreased significantly at all the directions.
Table 10Transmissibility of mount at different locations
Test location | Before optimization (m/s2) | After optimization (m/s2) | Transmissibility | |||
Active | Passive | Active | Passive | Before optimization | After optimization | |
Spectrum FL_X | 1.05 | 0.29 | 0.81 | 0.07 | 28 % | 8 % |
Spectrum FL_Y | 1.67 | 1.75 | 0.90 | 0.59 | 104 % | 65 % |
Spectrum FL_Z | 6.73 | 0.65 | 3.82 | 0.16 | 10 % | 4 % |
Spectrum FR_X | 1.49 | 0.35 | 0.98 | 0.13 | 23 % | 13 % |
Spectrum FR_Y | 1.60 | 0.92 | 0.86 | 0.40 | 57 % | 47 % |
Spectrum FR_Z | 7.15 | 0.96 | 4.02 | 0.37 | 13 % | 9 % |
Spectrum RL_X | 1.09 | 0.49 | 0.63 | 0.12 | 45 % | 20 % |
Spectrum RL_Y | 2.16 | 3.95 | 1.31 | 1.04 | 183 % | 79 % |
Spectrum RL_Z | 6.15 | 3.08 | 3.81 | 0.61 | 50 % | 16 % |
Spectrum RR_X | 1.64 | 0.21 | 0.74 | 0.14 | 13 % | 12 % |
Spectrum RR_Y | 1.86 | 1.80 | 1.25 | 0.70 | 97 % | 56 % |
Spectrum RR_Z | 6.24 | 3.07 | 3.87 | 0.52 | 49 % | 13 % |
As shown in Table 10, it can be observed that all the transmissibility decreased after optimization. Especially, before optimization, the transmissibility of mount front left and mount rear left at y-direction exceeds one, that is to say, at y-direction of those two mounts, the vibration shows a magnified effect. The value of the transmissibility of mount rear right at y-direction is very close to one. After optimization, those three values have an obvious reduction.
Fig. 7Accelerations of steering wheel with and without optimization at idle
5.2.2. Vibration of engine mount at 7th gear WOT
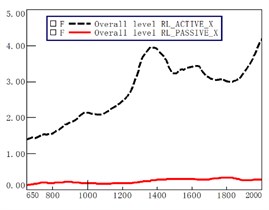
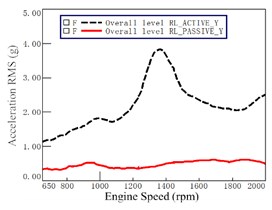
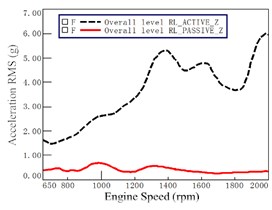
At the 7th gear WOT running condition, the mount accelerations at active and passive of front left, front right, rear left and rear right in X, Y and Z directions of VCS are measured, and here the accelerations in X, Y, and Z-direction for the RL mount are given for illustration in Fig. 8. It is seen that the accelerations at the active side (i.e., the dashed lines) increase significantly with the engine speed, but the accelerations at the passive side (i.e., the solid lines) increase slowly and relative smooth with the engine speed.
Fig. 8Mount accelerations at active and passive of Rear Left (RL)
a)X direction
b)Y direction
c)Z direction
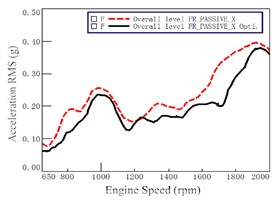
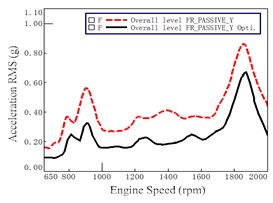
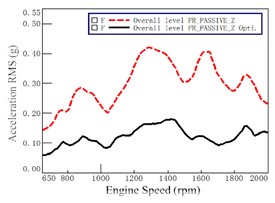
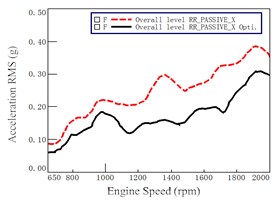
As the curves are very similar in both the left and right side, only the results of the right side were presented for illustration. Figs. 9-10 show the test results of the mount accelerations of before and after optimization at passive sides in three directions (i.e., X, Y, Z direction). The dashed lines in figures represent the initial status without optimization. The solid lines in figures represent the status after optimization. From Fig. 9-10, it can be observed that nearly all the accelerations decreased to a different extent after optimization. It demonstrated that the optimization had significant improvement on vibration.
It is seen from Fig. 9 that the lines at the X direction before and after optimization are very close to each other while the lines at Z direction before and after optimization have obvious improvement. The reduction of acceleration at the Z direction is much larger than other two directions with engine speed. The second one is at the Y direction. The reduction of acceleration at the X direction is the smallest one. That is to say, the optimization for the mount at the front side has a better effect on vibration in the Z direction than other two directions.
As shown in Fig. 10, it is seen that the lines at all three directions before and after optimization have a quite difference. The reduction of acceleration at the Z direction is relative larger than other two directions at all engine speeds. The second one is at the Y direction. The reduction of acceleration at the X direction is the smallest one. That is to say, the optimization for the mount at rear side has relative better improvement on vibration at all directions.
Fig. 9Mount accelerations before and after optimization at passive of Front Right (FR)
a)X direction
b)Y direction
c)Z direction
Fig. 10Mount accelerations before and after optimization at passive of Rear Right (RR)
a)X direction
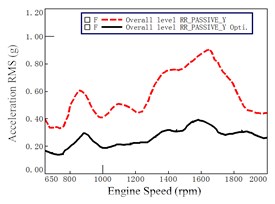
b)Y direction
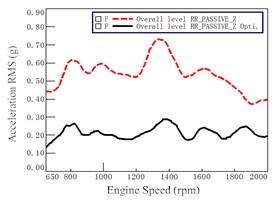
c)Z direction
5.2.3. Vibration of seat track and steering wheel at 7th gear WOT
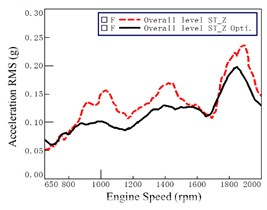
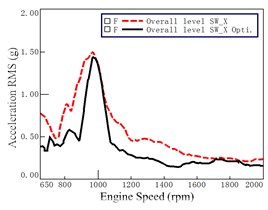
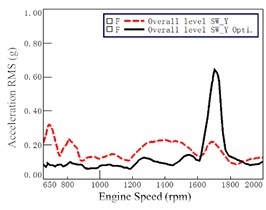
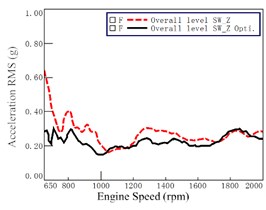
When the engine speed is from 650 to 2000 rpm at 7th gear WOT, the accelerations at seat track before and after optimization in the X, Y, and Z directions are shown in Fig. 11 while the accelerations at steering wheel before and after optimization in the X, Y, and Z directions are shown in Fig. 12.
Fig. 11Acceleration before and after optimization at seat track (at 7th gear WOT)
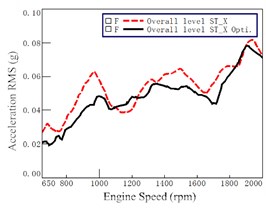
a)X direction
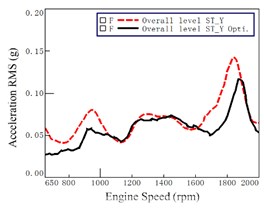
b)Y direction
c)Z direction
Fig. 12Acceleration before and after optimization at steering wheel (at 7th gear WOT)
X direction
b)Y direction
c)Z direction
As compared with the lines before optimization (i.e., the dashed lines), Fig. 11 and Fig. 12 show that most of the accelerations decreased after the optimization at each engine speed. However, the variations of accelerations before and after optimization are very obvious. It demonstrated that the optimization has significant improvement on vibration at seat track and at steering wheel.
5.2.4. Vibration transmissibility analysis at 7th gear WOT
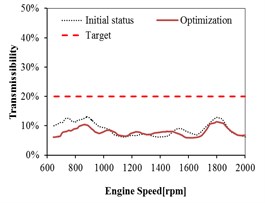
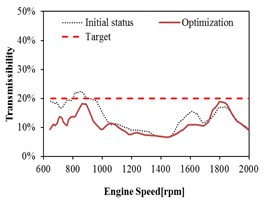
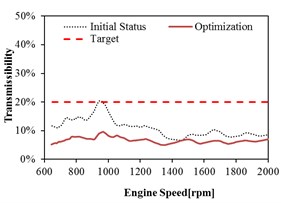
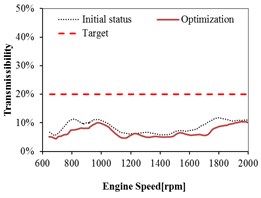
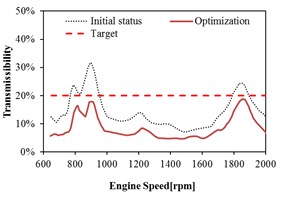
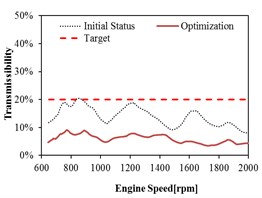
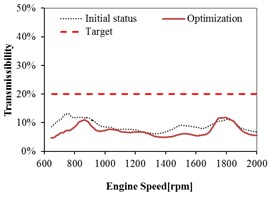
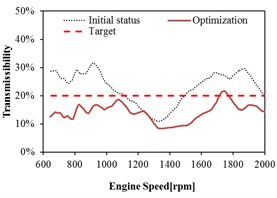
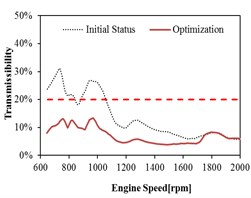
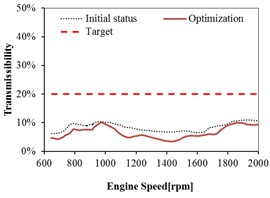
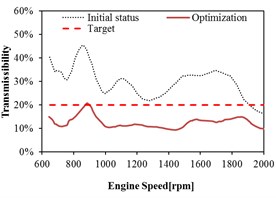
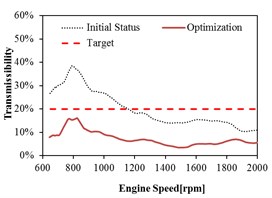
To evaluate the performance of vibration isolation, we defined the transmissibility as the ratio of active accelerations to the passive ones. Usually, the transmissibility is as low as possible. The value of transmissibility equals to 20 % and is set up as the target in the engineering application. It can be written as:
Here, apis the vibration of passive side, aa is the vibration of active side, TA is the transmissibility.
The relations between the transmissibility before and after optimization with the engine speed are plotted in Figs. 13-16 in three directions (i.e., X, Y, Z direction). The dashed curve lines in figures represent the initial status without optimization. The solid curve lines in figures represent the status after optimization. The dashed straight lines in figures represent the requirement target. All the curves after optimization show that the transmissibility of each mount decreased significantly as compared with the curves before optimization. After optimization, the reduction of all the curves is relative flat which is good for the improvement of comfort. It demonstrates that the vibration isolation meets the requirement after optimization.
Fig. 13Mount transmissibility before and after optimization at Front Left (FL)
a)X direction
b)Y direction
c)Z direction
Fig. 14Mount transmissibility before and after optimization at Front Right (FR)
a)X direction
b)Y direction
c)Z direction
As shown in Fig. 13 and Fig. 14, the transmissibility of front mount in all the directions meets the targets before optimization, except in the Y direction. With the increase of engine speed, the transmissibility has some improvements and the targets in all the directions are satisfied after optimization. It is can be observed that the front mount has better isolation performance in all the directions after optimization.
As shown in Fig. 15 and Fig. 16, the transmissibility of rear mount in the Y and Z directions do not meet the target before optimization. The transmissibility of rear mount has relative larger decrease in the Y and Z directions after optimization, and the targets in all the directions are satisfied. It can be observed that the optimization can improve the isolation performance of rear mount in any direction, especially the improvement in the Y and Z directions are relative significant.
Fig. 15Mount transmissibility before and after optimization at Rear Left (RL)
a)X direction
b)Y direction
c)Z direction
Fig. 16Mount transmissibility before and after optimization at Rear Right (RR)
a)X direction
b)Y direction
c)Z direction
5.2.5. Interior sound pressure level (SPL) at 7th gear WOT
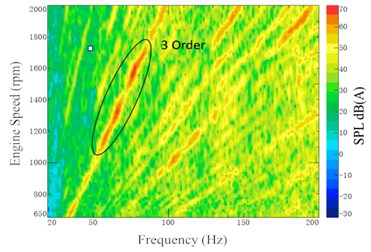
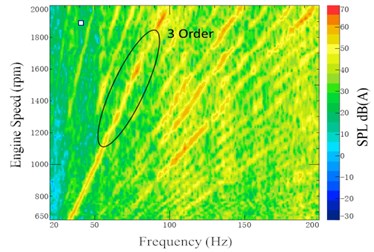
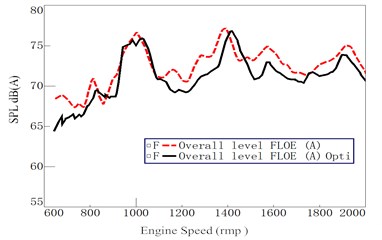
The interior noise is mainly composed of structure vibration noise (i.e., engine vibration, etc.) and air noise (i.e., engine noise, exhaust noise, road noise, etc.) via different paths to reach the target location and superposition. In order to evaluate the effects of the optimization of the Powertrain Mounting System (PMS) on the interior noise, interior noise at the driver’s left ear was measured at 7th gear WOT acceleration condition. Both the noise test results with and without optimization are presented in Fig. 17 and Fig. 18.
Fig. 17Noise color map at driver’s left ear (at 7th gear WOT)
a) Initial status
b) Optimization status
As shown in Fig. 17(a), it can be seen that the third-order vibration of engine contributes more on the interior noise before optimization, referred to engine speed at 1100-1700 RPM and the frequency at 55-85 Hz. From Fig. 17(b), it can be seen that the energy distribution of the interior noise at the third-order vibration of engine was significantly decreased after optimization. And no obvious peak point appeared. From Fig. 18, it can be seen that interior sound pressure level (SPL) at the 7th gear WOT acceleration condition was obviously improved as compared with the initial status before optimization, especially the improvement at the peak point. Therefore, the optimization of the PMS can better improve the vehicle interior noise at a low-frequency band.
Fig. 18Interior noise at driver’s left ear (at 7th gear WOT)
6. Conclusions
Design optimization of the Powertrain Mounting System (PMS) of a tractor for vibration control is presented in this paper. In order to evaluate the influence of PowerTrain System (PTS) lightweighting on the NVH performance, modal analysis and optimization of PMS is made before experimental testing. After optimization, a series of experimental tests are performed to evaluate the vehicle NVH performance. Based on the above analysis, the following conclusions can be made:
1) Several decoupling techniques in practice application are summarized in our research. These techniques can provide a more faster and effective way for the arrangement of mounts.
2) Based on the Genetic Algorithm (GA) method and optimization scheme, accepted optimization results were obtained by numerical analysis. It can be proved that the combined method was an effective way which can provide the possible optimization faster.
3) The vibration accelerations of steering wheel and mount after optimization decreased significantly along all the directions at idle condition. When the engine speed is from 650 to 2000 rpm at 7nd gear WOT, most of the accelerations decreased after the optimization at each engine speed. The variations of accelerations before and after optimization are very obvious. The optimization has significant improvement on vibration at seat track and at steering wheel. The improvement of PMS can improve the vibration performance of the vehicle systems.
4) After optimization, the transmissibility of mounts in all direction meets the engineering application. Furthermore, the improvement of isolation performance will increase the vibration performance of the vehicle.
5) The optimization of PMS had a better effect on the interior noise in a low-frequency band. The results also showed that the improvement of the vibration transmission path decreased the vehicle noise significantly.
References
-
Edenhofer O., Pichs-Madruga R., Sokona Y., et al. IPCC: Summary for Policymakers. In: Climate Change 2014: Mitigation of Climate Change. Contribution of Working Group III to the Fifth Assessment Report of the Intergovernmental Panel on Climate Change. Cambridge University Press, Cambridge, United Kingdom and New York, USA, 2014.
-
Edenhofer O., Pichs-Madruga R., Sokona Y., et al. Technical Summary. In: Climate Change: Mitigation of Climate Change. Contribution of Working Group III to the Fifth Assessment Report of the Intergovernmental Panel on Climate Change. Cambridge University Press, Cambridge, United Kingdom and New York, USA, 2014.
-
Raugei M., Morrey D., Hutchinson A., Winfield P. A coherent life cycle assessment of a range of lightweighting strategies for compact vehicles. Journal of Cleaner Production, Vol. 108, 2015, p. 1168-1176.
-
Galos J., Sutcliffe M., Cebon D., Piecyk M., Greening P. Reducing the energy consumption of heavy goods vehicles through the application of lightweight trailers: Fleet case studies. Transportation Research Part D, Transport and Environment, Vol. 41, 2015, p. 40-49.
-
Ribau J. P., Sousa J. M. C., Silva C. M. Reducing the carbon footprint of urban bus fleets using multi-objective optimization. Energy, Vol. 93, 2015, p. 1089-1104.
-
Tian J., Yang D., Zhang H., Liu L. Classification method of energy efficiency and CO2 emission Intensity of Commercial Trucks in China’s Road Transport. Procedia Engineering, Vol. 137, 2016, p. 75-84.
-
Benedyk J. C. Light metals in automotive applications. Light Metal Age, Vol. 58, Issues 9-10, 2000, p. 34-35.
-
Ford D. M. An analysis and application of a decoupled engine mount systems for idle isolation. SAE Technical Paper 850976, 1985, https://doi.org/10.4271/850976.
-
Spiekermann C. E., Radcliffe C. J., Goodman E. D. Optimal design and simulation of vibrational isolation systems. Journal of Mechanisms, Transmissions, and Automation in Design, Vol. 107, 1985, p. 271-276.
-
Kim G., Singh R. A study of passive and adaptive hydraulic engine mount systems with emphasis on non-linear characteristics. Journal of Sound and Vibration, Vol. 179, Issue 3, 1995, p. 427-453.
-
Snyman J. A., Heyns P. S., Vermeulen P. J. Vibration isolation of a mounted engine through optimization. Mechanism and Machine Theory, Vol. 30, Issue 1, 1995, p. 109-118.
-
Tao J. S., Liu G. R., Lam K. Y. Design optimization of marine engine-mounting system. Journal of Sound and Vibration, Vol. 235, Issue 3, 2000, p. 477-494.
-
Fouladi M. H., Nor M. J. M., Ariffin A. K., Abdullah S. Inverse combustion force estimation based on response measurements outside the combustion chamber and signal processing. Mechanical Systems and Signal Processing, Vol. 23, Issue 8, 2009, p. 2519-2537.
-
Harris C. M., Crede C. E. Shock and Vibration Handbook. McGraw-Hill, New York, 1961.
-
Yu Y., Naganathan N. G., Dukkipati R. V. A literature review of automotive vehicle engine mounting systems. Mechanism and Machine Theory, Vol. 36, 2001, p. 123-142.
-
Novotny P., Prokop A., Zubik M., Rehak K. Investigating the influence of computational model complexity on noise and vibration modeling of powertrain. Journal of Vibroengineering, Vol. 18, 1, p. 378-393.
-
Shangguan W. B., Lu Z. H. Experimental study and simulation of a hydraulic engine mount with fully coupled fluid structure interaction finite element analysis model. Computers and Structures, Vol. 82, Issue 22, 2004, p. 1751-1771.
-
Lu M. Study of Automotive Hydro Mount Mechanism. Ph.D. Dissertation, Western Michigan University, 2001.
-
Whitley D. A genetic algorithm tutorial. Statistics and Computing, Vol. 4, Issue 2, 1994, p. 65-85.
-
Mitchell M. An Introduction to Genetic Algorithms. MIT Press, 1996.
Cited by
About this article
This work was supported by the Project of the New and High Technology Industrialization of Shanxi, China (No. 2011-2368) and Major Science and Technology Project of Shanxi, China (No. 20111101035). Their sponsorship is greatly appreciated.
