Abstract
The bump height is one of the key factors which affects the vehicle bump test. If the adopted value of bump height is too small, the test couldn’t get obvious excitation effect for bridge structures. On the other hand, it will cause additional structural damage when the value is rather large. Aiming at this point, the theoretical calculation method to determine limit bump height is proposed in this paper. The vehicle bump test is decomposed into three stages, i.e., the period before rear wheels contacting with bridge, the moment at rear wheels contacting with bridge, the period after rear wheels contacting with bridge. In stage I, the total momentum generated by vehicle rotating around front wheels is calculated. Then, the initial conditions for stage III are derived using the principle of momentum conservation in stage II. Finally, combining with vehicle-bridge coupling equations, the free-decay response of bridge could be calculated to determine the limit bump height in stage III. In this paper, the reliability of the proposed method is validated by finite element method (FEM), and numerical simulations on an actual simply supported hollow slab bridge are used to calculate the dynamic response of bridge considering various transverse positions of vehicle bump and determine the limit bump height.
1. Introduction
Bridge dynamic load test is the most effective approach to determine the bridge structural parameters, which excites bridge structures through some excitation methods. These structural parameters including dynamic characteristics (natural frequency, modal shape, damping ratio, etc.), dynamic response and impact coefficient are important for evaluating the operation performance, bearing capacity and damage identification for bridge structure. The excitation methods of bridge dynamic test range from the free vibration method including impact excitation [1], vehicle bump test [2], step-relaxation test [3], forced vibration method through electrohydraulic shakers [4], test vehicle [5], to the pulsation method considering the disturbance of natural vibration such as seismic ground motion and wind and waves [6]. In general, vehicle bump test is the most commonly used method for free vibration test of short to medium span bridges [2, 7, 8].
The researchers have conducted lots of useful exploratory works in the field of vehicle test with obstacles. Huang et al. [9] let the rear wheels of the truck fall down from the concrete block with 20 cm height at the deck to generate the impulsive force in dynamic test. Kwasniewski et al. [10] placed a wooden plank across the deck to simulate major deterioration of the deck surface. Racanel [11] artificially produced an obstacle at the deck in order to induce an impulse at the superstructure level in the dynamic loading of bridge. Swannell and Miller [5], Alaylioglu H. and Alaylioglu A. [12] artificially amplified the effect of the deck surface undulations with the use of a wooden plank positioned transversely across the deck centerline, respectively. Cantieni [13] performed dynamic load test on the undisturbed pavement which placed a thick plank on the roadway. The excitation imposed to bridges by vehicle test with obstacles is forced excitation, whose purpose is to obtain the impact factor of bridges. These are all essentially different from the vehicle bump test of Chinese bridge dynamic test in excitation method and experimental objective.
However, the so called vehicle bump test of Chinese code JTG/T J21-2011 [14] suggests that the front wheels stay at bridge in static and the rear wheels fall from the obstacle with h height. Then vehicle-bridge coupling system starts to free-decay vibration under the impact load generated by the process of vehicle bump to bridge structures. Through analyzing the free-decay response, free vibration characteristics (natural frequency, damping ratio, modal shape, etc.) of bridge structure can be obtained. In the process of vehicle bump test, if the selected bump height is too small, the more obvious excitation effect on bridge structure can’t be obtained and the signal-to-noise ratio of dynamic response is smaller. Therefore, the dynamic characteristic derived through analysis has a larger error, which results in the inaccurate state evaluation result of bridge structure. However, it will cause additional damage for bridge when the selected bump height is too large. Thus, the determination of limit bump height is the key for the success of vehicle bump test. “Industry Standards of Transport Ministry” in 2013 [15] suggests that the heights of vehicle bump are 5-15 cm for long span concrete bridges. The Chinese code JTG/T J21-2011 regulates that the height is 15 cm in the case that a single truck approximate to standard load is adopted as the bump excitation. However, there is only an empirical approximate range of limit vehicle bump height according to the literatures, which the theoretical basis of the height specified is not given. In addition, the limit vehicle bump height should be different for various types of bridges and the specified values in standards seem to be a safety value for common bridges. Therefore, it is necessary to establish a theoretical calculation model of vehicle bump height and determine it accurately.
The present work aims at the current status that there is no theoretical calculation method for the determination of limit vehicle bump height. The theoretical calculation model for solving dynamic response in vehicle bump test is established, and the fundamental equations to determine initial conditions required for the solution of theoretical calculation model are deduced. Thus, the solution of theoretical calculation model can be realized through Runge-Kutta method. Then the determination method of limit vehicle bump height is presented based on dynamic response of bridges. Finally, the reliability of the proposed method is validated by finite element method (FEM), and the numerical simulations on an actual simply supported hollow slab bridge are used to calculate the dynamic response of bridge considering various transverse positions of vehicle bump and determine the limit vehicle bump height.
2. Theoretical background of vehicle bump test and simplified models for bridge and vehicle
The spatial model of vehicle bump test is shown in Fig. 1. An obstacle with triangular cross section of h height is placed at bridge deck in mid-span. The vehicle bump test suggests that front wheels of test vehicle stay at bridge in static and rear wheels fall from the obstacle. Then, vehicle-bridge coupling system starts free-decay vibration under the impact load generated by the process of vehicle bump. Through analyzing the free-decay response, the free vibration characteristics of bridge structure can be obtained.
Fig. 1The spatial model of vehicle bump test
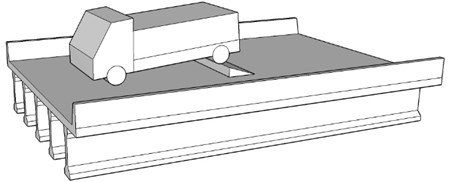
Generally speaking, the multi-girder bridge is the most widely used type for simply supported bridge of short-to-medium span in structural design. The dynamic response analysis for multi-girder bridge should be specific for each girder. According to the present research [16], load transverse distribution coefficient is the key to simplify the integral mechanics performance of multi-girder bridge to that of single girder. By using transverse distribution coefficient, the load of multi-girder bridge is distributed into single girder for calculation and the spatial model of vehicle bump test can be simplified into the planar one.
There are several vehicle models, which possess two degrees of freedom, four degrees of freedom and six degrees of freedom, respectively. In this study, a half-car planar model with four degrees of freedom is adopted. The vehicle bump test – dynamic response problem of the bridge excited by a test vehicle is the research object of this paper, in which the test vehicle is considered as a specific vehicle (i.e., all the vehicle parameters are given) and only one test vehicle acts on the bridge. Due to the certain vehicle parameters and position in vehicle bump test, the statistic characteristics of vehicles are not needed to consider in this paper.
3. Establishment of theoretical model for vehicle bump test and solution for dynamic response
3.1. Decomposition for the process of vehicle bump test
According to different contact forms and coupling mechanisms between vehicle and bridge, the process of vehicle bump test is decomposed into three stages i.e., the period before rear wheels contacting with bridge, the moment at rear wheels contacting with bridge, the period after rear wheels contacting with bridge. The first stage is shown in Fig. 2(a) and the second and third stages are shown in Fig. 2(b).
In Fig. 2, mb, Ib are the mass and moment of inertia of vehicle body; mt1, mt2 are the masses of front and rear wheels; yb, θ are the transverse displacements and rotation angle of vehicle body; yt1, yt2 are the transverse displacements of front and rear wheels of vehicle, ri is the distance from tires to the center of vehicle body (i=1, 2); l, a, c are the beam length; the axle spacing of vehicle and the distance between rear wheels and coordinate origin; h is the height of obstacle.
Fig. 2The planar vehicle-bridge coupling model of vehicle bump process
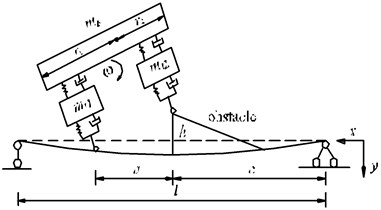
a) Stage I: the period during vehicle rotating around front wheels
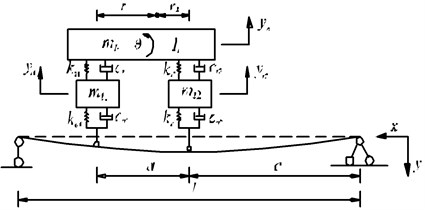
b) Stages II and III: the moment and the period after rear wheels contacting with bridge
In these three stages, there are static displacements for simply supported bridge all the time. Therefore, the static status of bridge is considered as the equilibrium position of bridge vibration. The vehicle stays at bridge in static and its rear wheels suddenly fall from the obstacle with h height in stage I, which could be considered as vehicle rotating around front wheels. Stage II is the moment of rear wheels contacting with bridge, in which the rear wheels generate an impact load on bridge. In stage III, there is no external force acting on the vehicle-bridge coupling system, and it could be considered as the coupling system performing a free-decay vibration.
From the point of view of energy transformation for vehicle-bridge system, stage I is the process of vehicle-bridge system gaining energy, stage II is the process of energy redistribution for vehicle and bridge, and stage III is the process of energy dissipation under damping for vehicle-bridge system. In the perspective of dynamic response analysis, stage I is regarded as the rotation of a rigid body, and stage III is the free-decay vibration of vehicle-bridge coupling system. However, the most critical point among three stages is the force analysis of stage II, i.e., how to utilize the force analysis results of stage I to determine the initial conditions of vehicle-bridge coupling vibration in stage III.
3.2. Vibration equations of vehicle-bridge coupling system in stage III
The bridge is assumed as a simply supported Euler-Bernoulli beam. The equation of motion for bridge structure in stage III can be written as:
wherem, C, y(x,t) are the mass per unit length, damping and dynamic displacement function of bridge, respectively; EI is the flexural rigidity of bridge; δ1(x-(c+a)) and δ2(x-c) are Dirac delta functions; P1(t) and P2(t) are the dynamic vehicular load of front wheel and that of rear wheel, then P1(t) and P2(t) can be expressed by:
where ∅ is the load transverse distribution coefficient of single beam in the whole bridge.
According to mode superposition method (MSM), the dynamic displacement y(x,t) of the beam in modal coordinates can be expressed by:
where φi(x)=sin(iπx/l) is the ith order mode shape function of simply supported bridge, which is determined from the eigenvalue and eigenfunction analysis; qi(t) is the corresponding modal amplitude.
Substituting Eq. (3) into Eq. (1), and multiplying by φi(x) on both sides, integrating with respect to x between 0 and l, by applying the orthogonal property of mode shape it can lead to:
=∫l0φn(x)[P1(t)δ1(x-(c+a))+P2(t)δ2(x-c)]dx,
where β=C/2m;ωn is the nth natural frequency of simply supported bridge. Let sn=∫l0mφ2n(x)dx, then Eq. (4) can be expressed by:
Equations of motion for wheel masses mt1 and mt2 are given by:
mt2¨yt2+ca2(˙yt2+˙y2)+ka2(yt2+y2)+ct2(˙yt2-˙yb-r2˙θ)+kt2(yt2-yb-r2θ)=0.
The force balance equations for vehicle body are given by:
+kt2(yb-yt2+r2θ)=0,
Ib¨θ-r1[ct1(˙yb-˙yt1-r1˙θ)+kt1(yb-yt1-r1θ)]
+r2[ct2(˙yb-˙yt2+r2˙θ)+kt2(yb-yt2+r2θ)]=0,
where ka, ca are the stiffness coefficients and damping coefficients of tire; kt, ct are the sprung constants and damping constants of suspension; y1 and y2 are dynamic deflections at positions of front and rear wheel for bridge.
Combining Eq. (1) and Eqs. (5-7), the generalized motion equation of vehicle-bridge coupling system after vehicle falling down could be expressed in matrix form:
here:
Cn=-∅(φn(c+a)mb∙r2r1+r2+φn(c)mb∙r1r1+r2),Dn=∅(φn(c+a)Iba-φn(c)Iba),
Eq. (8) can be solved to obtain u, and the dynamic displacement time-history curve y(x,t) of bridge can be derived from u.
3.3. The rotational motion of vehicle in stage I
As shown in Fig. 2(a), let ω be the rotation angular velocity of vehicle body at the period during rear wheel falling to the deck. According to conservation of energy, the potential energy of vehicle system at the highest point of obstacle is equal to kinetic energy at the moment of vehicle contacting with the deck, one can obtain:
where h is the vehicle bump height.
Let γ be the distance between front wheel and the mass center of particle system composed of mb and mt, it has:
The total momentum p0 of vehicle system before vehicle contacting with bridge can be written as:
3.4. Force analysis of stage II: determination of initial conditions for vehicle-bridge coupling vibration in stage III
In stage II, the rear wheel of vehicle only exerts an impact load on bridge. At this moment, the bridge gets the initial velocity merely without deformation and acceleration. Let p1 be the momentum of bridge at the moment of vehicle contacting with bridge. Assuming that the momentum p1 is evenly distributed along the beam length, it has:
Differentiating both sides of Eq. (12) with respect to x yields:
Substituting Eq. (3) into Eq. (13) at the time t=0 with the orthogonal property of mode shape can obtain:
Let sn=∫l0mφ2n(x)dx, then Eq. (14) can be expressed by:
According to the vehicle-bridge interaction in stage II, it is considered that the four degrees of freedom of vehicle in u only have initial velocities at the moment of vehicle contacting with bridge. Based on the momentum conservation law, it has:
Combining Eqs. (6-7) and Eqs. (11, 15, 16), the initial velocities of all degrees of freedom in u can be calculated. Then, all the initial conditions required for solving the theoretical calculation model could be determined.
3.5. Solution for dynamic response
In order to solve the theoretical calculation model and derive the dynamic response of bridge structure, different methods have been studied, and generally there are three kinds of methods: numerical method [17-19] including Newmark-β method, Wilson-θ method and Runge-Kutta method, and theoretical method [17, 20, 21]. For simple structures, analytical method [17, 22, 23] is also used for its simplicity and reliability which can be used to validate the numerical method for the same conditions.
In this paper, once the initial velocities of all degrees of freedom in u are identified, the values of u of each moment can be calculated step-by-step using fourth-order Runge-Kutta method [24, 25]. Consequently, the time-history curve of dynamic displacement of bridge y(x,t) can be obtained according to MSM.
The bending moment value of each section at any moment M(ti,x) can be expressed as:
where yj(x) is the static displacement of bridge.
Assuming that the design bending moment of each section of bridge is Ms(x), if the following equation is satisfied, h can be considered as the limit vehicle bump height:
In summary, the detailed process for determining limit vehicle bump height is as follows: Firstly, a vehicle bump height h is assumed, and the initial conditions of vehicle-bridge coupling vibration can be determined according to Section 3.4. Then, the dynamic displacement response of each section of bridge can be calculated by Eq. (8). Thus, the total displacement of each section of bridge could be obtained according to dynamic and static displacements. Finally, the bending moment of each section of bridge at any moment is calculated by Eq. (17). Through comparing with the design bending moment to determine whether this bump height h is the limit vehicle bump height. If not, increasing the value of vehicle bump height h. The same calculations are repeated to determine the limit vehicle bump height.
4. Reliability of the proposed method
4.1. Comparison with finite element method (FEM)
To verify the correctness of the proposed method, a finite element analysis model of entire process of vehicle bump test is established using ANSYS software and the displacement response of simply supported bridge under various bump heights are calculated. In the finite element analysis model, a single simply supported Euler-Bernoulli beam is adopted to simulate simply supported bridge, and the parameters are: the beam length l is 20 m, moment of inertia for cross section I is 0.0832 m4, density is 2500 kg/m3, the Yong’s modulus is 3.25×10¹⁰ Pa and damping ratio is 0.2.
The vehicle parameters are adopted from Mulcahy [26] which were measured from a real vehicle: mt1= 1500 kg, mt2= 1000 kg, Ib=1.47×10⁵ kg·m2, ka1= 3.74×10⁶ N∙m-1, ka2=4.6×10⁶ N∙m-1, ca1= 3.9×10³ N∙m-1, ca2= 4.3×10³ N∙m-1, kt1= 2.47×10⁶ N∙m-1, kt2= 4.23×10⁶ N∙m-1, ct1=3×10⁴ N∙m-1, ct2=4×10⁴ N∙m-1, r1= 2.22 m, r2= 2.05 m, a= 4.27 m and c= 10 m. The mass of carriage mb is assumed as 10000 kg which is related to the weight of goods loaded.
According to the previous literatures [27-31], research on bridge structures modeled by beam elements are very popular in vehicle-bridge coupling models, which are satisfied the requirement of this paper. Thus, in the finite element analysis model, the simply supported beam is built with beam3 element, and it is divided into 40 beam elements with length 0.5 m. The mass of vehicle body and tires are established by mass21 element, and the former is set as a mass element with moment of inertia. The spring and damping of suspension and tires are constructed by combin14 element. And the connection between vehicle body mass and suspension springs are built with beam3 element, its density is assigned to 0 and flexural rigidity is 100 times of that of simply supported beam. This makes the beam3 element is closer to a rigid one, which is consistent with the simplified vehicle model. Then coupling the front wheel node of vehicle with the contact node of simply supported beam and releasing their rotational constraints. The rear wheel node is set as conta175 element, the nearby area of beam mid-span is set as targe169 element. The contact element and target element form a contact pair by sharing the same real constant to simulate the contact process. The finite element model of vehicle bump test is shown as Fig. 3.
Fig. 3The finite element model of vehicle bump test

The calculation of dynamic response for vehicle bump test includes two steps of static analysis and transient analysis in FEM. The static analysis is carried out firstly, the constraints of rear wheel node are imposed and the gravity acceleration is exerted. Then, the force is applied at mid-span which is equivalent to the sum of the gravity of rear wheel and half of vehicle body, so the initial displacement of simply supported beam can be obtained. Next, the transient analysis is performed based on the static displacement of beam. Releasing the constraints of rear wheel node and removing the force at mid-span, then the displacement response of simply supported beam at mid-span could be solved.
The displacement response (i.e., including the static and dynamic displacement of vehicle, without the static displacement caused by the deadweight of simple supported beam) of simply supported beam at mid-span could be calculated under various bump heights of 0.2 m and 0.25 m by using FEM and the proposed method, respectively. As the single beam is adopted in the finite element model, the calculation results of FEM are equivalent to those of the proposed method in which the transverse distribution coefficient is equal to 1. The corresponding results are shown in Figs. 4-5.
Fig. 4The displacement response of simply supported beam at mid-span under bump height of 0.2 m
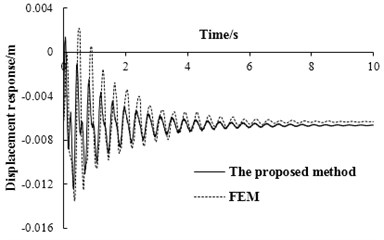
Fig. 5The displacement response of simply supported beam at mid-span under bump height of 0.25 m
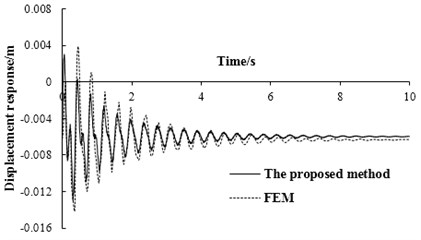
It can be seen from Figs. 4-5, the displacement responses of simply supported beam at mid-span are relatively close for the proposed method and FEM. The errors between the absolute maximum values of dynamic displacements from the two methods are 9.02 % and 9.12 %, respectively. And the variation trends of these two displacement response curve results have a good agreement which verifies the correctness and reliability of the proposed method. In Figs. 4-5, the maximum dynamic displacements calculated by FEM are larger than those calculated by the proposed method. This is because that the momentum is considered as evenly distributed along the beam length in stage II for the proposed method, but it is not like this for FEM.
The displacement response calculated by the proposed method is smaller than the actual value under a certain bump height, which leads to the limit bump height by the proposed method slightly larger than the actual value. Thus, the limit bump height calculated by the proposed method needs to be reduced as the actual value in the actual vehicle bump test. According to the difference between the calculation results by these two methods, it is suggested that the reduction coefficient is 90 %.
4.2. Comparison with the method by Tan in 2009
In 2009, the author of this paper performed the research on vehicle bump test and proposed a theoretical method for determining the bump height [32]. To compare the results between the present method in this paper and the method by Tan in 2009, the same models of vehicle and simply supported beam in Section 4.1 are adopted and the displacement responses of simply supported beam at mid-span with different modal orders adopted in MSM (represented as the symbol n) are calculated by these two methods. The relationships between modal order adopted in MSM and maximum displacement response under bump heights of 0.2 m and 0.25 m are shown as Figs. 6-7, respectively. When the bump height is 0.25 m, the displacement responses of simply supported beam at mid-span with n=5 and n=6 are shown in Figs. 8-9.
Fig. 6The relationships between modal order adopted in MSM and maximum displacement response under bump height of 0.2 m
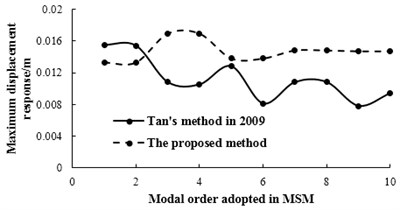
Fig. 7The relationships between modal order adopted in MSM and maximum displacement response under bump height of 0.25 m
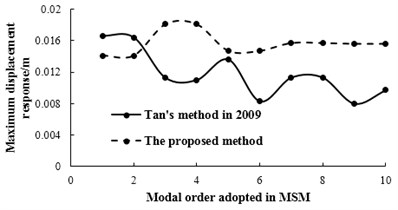
Fig. 8The displacement response of simply supported beam at mid-span with n= 5
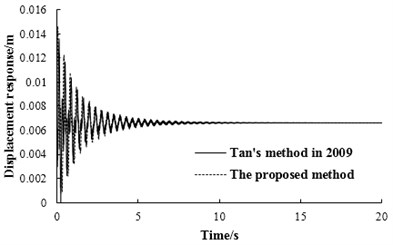
Fig. 9The displacement response of simply supported beam at mid-span with n= 6
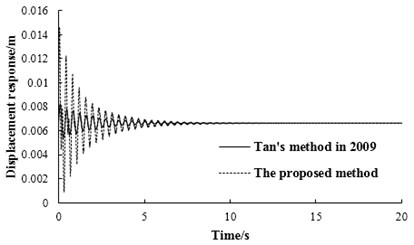
As can be seen from Figs. 6-7, when n is larger than 7, the maximum displacement response of simply supported beam by the proposed method trends to be a stable value, which is consistent with the basic principle of modal superposition method. However, there are obvious fluctuations on the maximum displacement response by Tan’s method in 2009, which illustrates that this method has some defects. It can be shown in Figs. 8-9, the displacement response calculated by these two methods are rather close with n=5. While there is significant difference between the two results with n=6. These can also be verified by Figs. 6-7, which further illustrate that the method proposed by Tan in 2009 is flawed.
Through comparing these two methods, it could be found that the methods on determining initial conditions for free-decay vibration of vehicle-bridge coupling system are different. Therefore, it can be deduced that there are some defects in determining the initial conditions using the proposed method by Tan in 2009. However, the initial condition is the key to solve the dynamic response in vehicle bump test.
5. Numerical examples
5.1. Parameters of vehicle and bridge
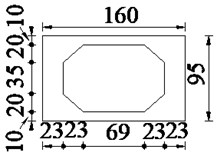
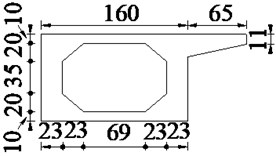
An actual uniform simply supported hollow slab bridge with 20 m span is used for the numerical simulations, which is composed of 5 slabs. The general layout and cross section of the hollow slab bridge are shown in Figs. 10-11. The numbers 1-5 above bridge deck in Fig. 10 represent the numberings of hollow slabs. The materials of hollow slab bridge are the same as those of simply supported beam in Section 4.1. As the vehicle model in literature [26] is commonly used for bridge detection, it is also adopted in this section and the lateral width of this vehicle is 1.8 m. In the Chinese code JTG/T J21-2011, a single truck approximate to standard load is recommended for the vehicle bump test. According to practical engineering experience, the mass of vehicle body is adjusted as 38000 kg to represent the standard load of vehicle. Other vehicle parameters are the same as those in Section 4.1.
Fig. 10The general layout of simply supported hollow slab bridge (unit: cm)

Fig. 11The cross section of simply supported hollow slab bridge (unit: cm)
5.2. Calculation results analysis
5.2.1. Case 1: transverse position of vehicle bump in 1# slab
The transverse position of vehicle bump at middle span of 1# slab is shown in Fig. 12. The displacement responses of mid-span in 1# slab under various vehicle bump heights are calculated and shown in Fig. 13. Then the maximum bending moments of mid-span in 1# slab under bump heights of 0, 5, 10, 15, 20 cm are derived and the calculation results are shown in Fig. 14. When the bump height is 20 cm, the maximum bending moment of mid-span in 1# slab has reached the designed value of bending moment 1580.8 kN∙m through analysis. Then it could be considered that the limit bump height of simply supported bridge is 20 cm for case 1. Under limit bump height of 20 cm, the displacements of each point in each slab at the moment of maximum displacement at mid-span is shown in Fig. 15. The bending moments of each point in each slab at the moment of maximum bending moment at mid-span is shown in Fig. 16.
Fig. 12Case 1: the transverse position of vehicle bump in 1# slab (unit: cm)

Fig. 13The displacement responses of mid-span in 1# slab under various vehicle bump heights
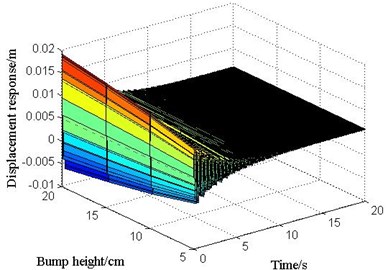
Fig. 14The relationship between bump height and bending moment of mid-span in 1# slab
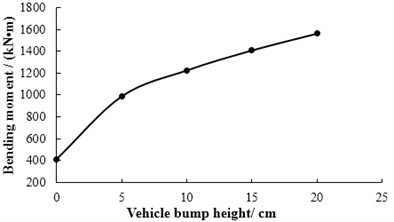
Fig. 15The displacements of each point in each slab at the moment of maximum displacement at mid-span under limit bump height
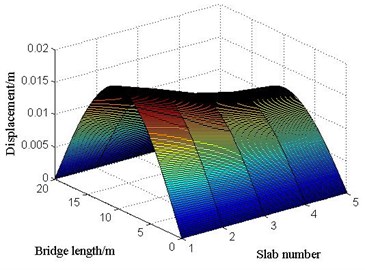
Fig. 16The bending moments of each point in each slab at the moment of maximum bending moment at mid-span under limit bump height
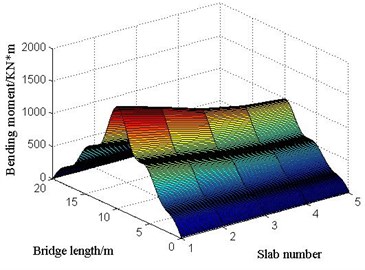
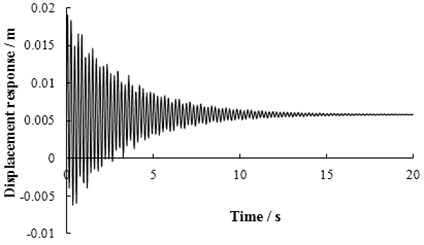
Fig. 17The displacement response of mid-span in 1# slab under limit bump height in case 1
Under limit bump height of 20 cm for case 1, the maximum displacement and bending moment of mid-span are located at 1# slab. This indicates that the excitation effect on 1# slab is the most obvious and the larger dynamic response was generated under the transverse position in case 1. However, the relationship between dynamic response of other slabs and distance from 1# slab is negative correlation. It is also consistent with the variation regulation of load transverse distribution coefficient of simply supported bridge.
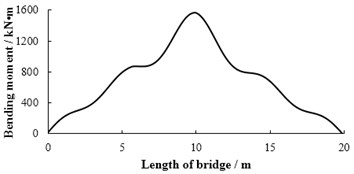
The displacement response of mid-span in 1# slab under limit bump height in case 1 is shown in Fig. 17. The displacement of each point in 1# slab at the moment of maximum displacement at mid-span is shown in Fig. 18. The bending moment of each point in 1# slab at the moment of maximum bending moment at mid-span is shown in Fig. 19.
Fig. 18The displacement of each point in 1# slab at the moment of maximum displacement at mid-span under limit bump height in case 1
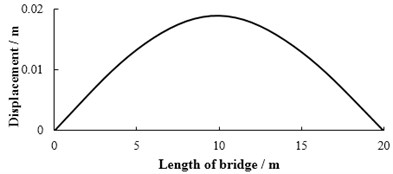
Fig. 19The bending moment of each point in 1# slab at the moment of maximum bending moment at mid-span under limit bump height in case 1
5.2.2. Case 2: transverse position of vehicle bump in 2# slab
The transverse position of vehicle bump at middle span of 2# slab is shown in Fig. 20. The displacement responses of mid-span in 2# slab under various vehicle bump heights are calculated and shown in Fig. 21. Then the maximum bending moments of mid-span in 2# slab under bump heights of 0, 5, 10, 15, 20, 25, 28 cm are derived and the calculation results are shown in Fig. 22. When the bump height is 28 cm, the maximum bending moment of mid-span in 2# slab has reached the designed value of bending moment through analysis. Then it could be considered that the limit bump height of simply supported bridge is 28 cm for case 2. Under limit bump height of 28 cm, the displacements of each point in each slab at the moment of maximum displacement at mid-span is shown in Fig. 23. The bending moments of each point in each slab at the moment of maximum bending moment at mid-span is shown in Fig. 24.
Fig. 20Case 2: the transverse position of vehicle bump in 2# slab (unit: cm)

Fig. 21The displacement response of mid-span in 2# slab under various vehicle bump heights
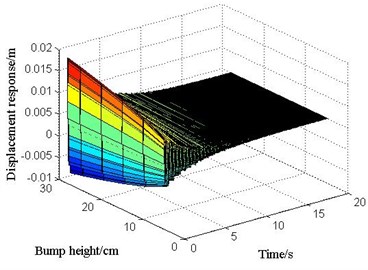
Fig. 22The relationship between bump height and bending moment of mid-span in 2# slab
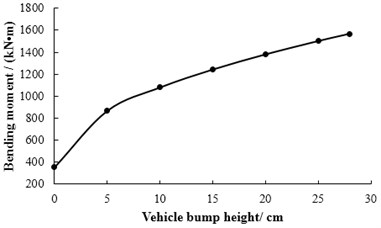
Fig. 23The displacements of each point in each slab at the moment of maximum displacement at mid-span under limit bump height
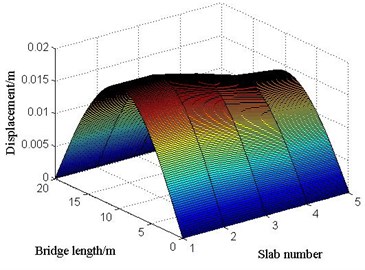
Fig. 24The bending moments of each point in each slab at the moment of maximum bending moment at mid-span under limit bump height
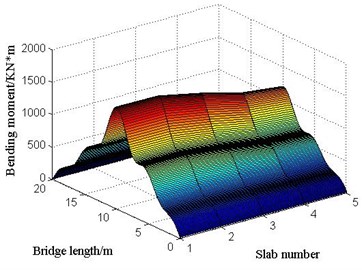
Under limit bump height of 28 cm for case 2, the maximum displacement and bending moment of mid-span are located at 2# slab which is also consistent with the variation regulation of transverse distribution coefficient. However, the limit bump height of case 2 is larger than that of case 1. It indicates that the position of vehicle bump test in case 1 is the more unfavorable load position than that in case 2.
5.2.3. Case 3: transverse position of vehicle bump in 3# slab
The transverse position of vehicle bump in the middle span of 3# slab is shown in Fig. 25. The displacement responses of mid-span in 3# slab under various vehicle bump heights are calculated and shown in Fig. 26. Then the maximum bending moments of mid-span in 3# slab under bump heights of 0, 5, 10, 15, 20, 25, 30, 32 cm are derived and the calculation results are shown in Fig. 27. When the bump height is 32 cm, the maximum bending moment of mid-span in 3# slab has reached the designed value of bending moment through analysis. Then it can be considered that the limit bump height of simply supported bridge is 32 cm for case 3. Under limit bump height of 32 cm, the displacements of each point in each slab at the moment of maximum displacement at mid-span is shown in Fig. 28. The bending moments of each point in each slab at the moment of maximum bending moment at mid-span is shown in Fig. 29.
Fig. 25Case 3: the transverse position of vehicle bump in 3# slab (unit: cm)

Under limit bump height of 32 cm for case 3, the maximum displacement and bending moment of mid-span are located at 3# slab which is also consistent with the variation regulation of transverse distribution coefficient. However, the limit bump height of case 3 is larger than that of case 1 and 2. It indicates that the positions of vehicle bump test in case 1 and 2 are the more unfavorable load positions than that in case 3.
Fig. 30 provides the relationships between the maximum bending moment and vehicle bump heights for three cases. It could be found that the maximum bending moments for any bump heights are: case3 < case2 < case1, then the limit bump heights can be known as: case3 > case2 > case1, which is caused by the load transverse distribution coefficients: case3 < case2 < case1. Therefore, it could be considered that the limit bump height of simply supported bridge is inversely proportional to the load transverse distribution coefficient.
Fig. 26The displacement response of mid-span in 3# slab under various vehicle bump heights
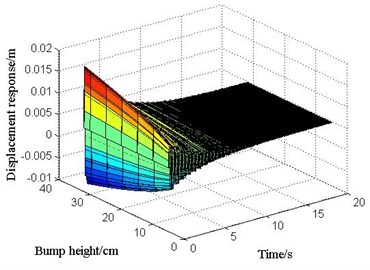
Fig. 27The relationship between bump height and bending moment of mid-span in 3# slab
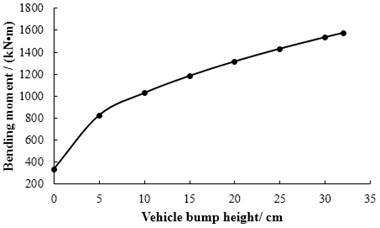
Fig. 28The displacements of each point in each slab at the moment of maximum displacement at mid-span under limit bump height
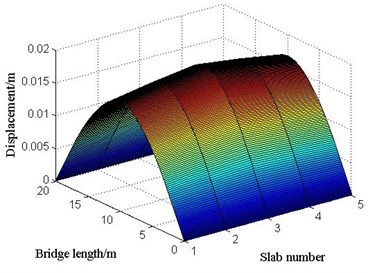
Fig. 29The bending moments of each point in each slab at the moment of maximum bending moment at mid-span under limit bump height
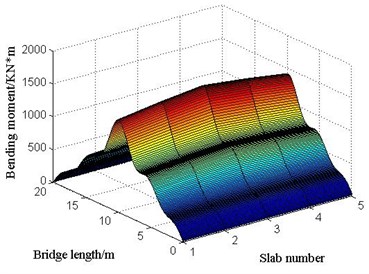
Fig. 30The relationship between vehicle bump heights and bending moment for three cases
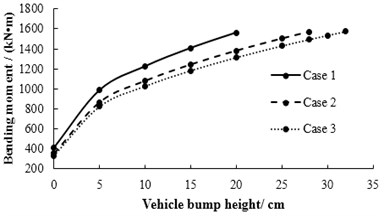
Fig. 31The relationship between limit bump heights and load transverse distribution coefficient
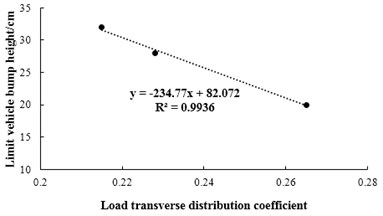
Fig. 31 shows the relationship between limit bump height and transverse distribution coefficient, which can be seen that there is an approximate linear relationship between them. As the transverse distribution coefficient is related to transverse connection of main girders, number of main girders and vehicle positions, and the load transverse distribution coefficient will further affect the limit bump height. In practical engineering, the following equation is suggested to estimate the limit bump height considering the reduction of 90 % in Section 4.1:
where, hp is the estimated limit bump height in practical engineering (unit: cm); ∅p is the load transverse distribution coefficient in practical engineering.
6. Conclusions
In this paper, the vehicle bump test is decomposed into three stages, the analysis model of displacement response of simply supported bridge in vehicle bump test is established through force analysis for three stages. Then the determination method on limit bump height of simply supported bridge is formed, which provides a theoretical upper limit value for the selection of bump height. Finally, the reliability and correctness of the proposed method are validated by FEM and numerical simulations on an actual simply supported hollow slab bridge with 20 m span are calculated to provide some reference for the selection of vehicle bump height in practical engineering. The following conclusions can be obtained:
1) The maximum dynamic displacement responses of simply supported beam at mid-span are relatively close for the proposed method and FEM. The maximum error between them is 9.12 %, which is acceptable for the estimation of limit bump height. It also verifies the correctness and reliability of the proposed method.
2) In the proposed method, the momentum is considered as evenly distributed along the beam length in determining initial conditions for vehicle-bridge coupling vibration. This is the reason that the maximum displacement of simply supported bridge at mid-span calculated by FEM is larger than that by the proposed method.
3) When the bump height is certain, the larger the load transverse distribution coefficient is, the larger the dynamic response of simply supported bridge is, and the smaller the limit bump height is.
4) In practical engineering, the estimated limit bump height hp=5.8/∅p can be used for simply supported bridge based on load transverse distribution coefficient.
In summary, the proposed method in this paper could be regarded as an improvement for the method by Tan in 2009. Furthermore, another vehicle bump test about vehicle crossing obstacles with velocity is the topic which the author further deliberated from now on.
References
-
Green M. F., Cebon D. Dynamic response of highway bridges to heavy vehicle loads: theory and experimental validation. Journal of Sound and Vibration, Vol. 170, Issue 1, 1994, p. 51-78.
-
Peng D. W., Hong J. X., Guo A. M., et al. Dynamic analysis and field-test of jointless bridge. Earthquake Engineering and Engineering Vibration, Vol. 25, Issue 2, 2005, p. 72-76.
-
Gentile C., Cabrera F. Dynamic investigation of a repaired cable-stayed bridge. Earthquake Engineering and Structural Dynamics, Vol. 26, Issue 1, 1997, p. 41-59.
-
Shelley S. J., Aksel T., Aktan A. E., et al. Active-control and forced-vibration studies on highway bridge. Journal of Structural Engineering, Vol. 121, Issue 9, 1995, p. 1306-1312.
-
Swannell P., Miller C. W. Theoretical and experimental studies of a bridge vehicle system. Proceeding of Institute of Civil Engineering (Part 2), Vol. 83, Issue 3, 1987, p. 613-615.
-
Wilson J. C., Tan B. C. Bridge abutments-assessing their influence on earthquake response of Meloland Road overpass. Journal of Engineering Mechanics, Vol. 116, Issue 8, 1990, p. 1838-1856.
-
Farrar C. R., Duffey T. A., Cornwell P. J., et al. Excitation Methods for Bridge Structures. Office of Scientific and Technical Information Technical Reports, 1999.
-
Zhang J. P. Bridge Detection and Maintenance and Reinforcement. Second Edition, China Communications Press, Beijing, 2011, (in Chinese).
-
Huang C. S., Yang Y. B., Lu L. Y., et al. Dynamic testing and system identification of a multi-span highway bridge. Earthquake Engineering and Structural Dynamics, Vol. 28, Issue 8, 1999, p. 857-878.
-
Kwasniewski L., Li H., Wekezer J., et al. Finite element analysis of vehicle-bridge interaction. Finite Elements in Analysis and Design, Vol. 42, Issue 11, 2006, p. 950-959.
-
Racanel I. R. Static and dynamic testing of a concrete bridge in Bucharest. International Multidisciplinary Scientific Geoconference, 2011.
-
Alaylioglu H., Alaylioglu A. Dynamic structural assessment of a highway bridge via hybrid FE modal and in Situ testing. Computers and Structures, Vol. 63, Issue 3, 1997, p. 439-453.
-
Cantieni R. Dynamic Load Testing of Highway Bridge. Transportation Research Record, 1984.
-
Highway Science Institution of the Ministry of Transportation. Specification for Inspection and Evaluation of Load-Bearing Capacity of Highway Bridges, 2011, JTG/T J21-2011, (in Chinese).
-
Industry Standards of Transport Ministry. Test Method for Long Span Concrete Bridges (version to be approved), 2013, (in Chinese).
-
Liu H., Ye J. S., Yu B., et al. Calculation method of transversal distribution factor for bridge load. Journal of Traffic and Transportation Engineering, Vol. 9, Issue 1, 2009, p. 62-66.
-
Xia H., Zhang N. Dynamic Interaction of Vehicles and Structures. China Science Press, Beijing, 2005.
-
Yang Y. B., Wu Y. S. A versatile element for analyzing vehicle-bridge interaction response. Engineering Structures, Vol. 23, Issue 5, 2001, p. 452-469.
-
Cao X. Dynamic Analysis of Bridge Structure. China Railway Publishing House, 1987.
-
Yang Y. B., Yau J. D., Wu Y. S. Vehicle-bridge interaction dynamics: with applications to high-speed railways. Tohoku Journal of Experimental Medicine, Vol. 106, Issues 1-2, 1972, p. 205-226.
-
Sheng X., Jones C. J. C, Thompson D. J. A theoretical model for ground vibration from trains generated by vertical track irregularities. Journal of Sound and Vibration, Vol. 272, Issues 3-5, 2004, p. 937-965.
-
Fryba L. Vibration of Solids and Structures under Moving Loads. Noordhoff International Publishing, Vol. 43, Issue 3, 1970, p. 39-99.
-
Biggs J. M. Introduction to Structural Dynamics. McGraw-Hill, New York, 1964.
-
Du X. T., Xia H., Zhang T., et al. Non-iterative solving algorithm for coupled vibration of a train-bridge system based on precise Runge-Kutta hybrid integration method. Journal of Vibration and Shock, Vol. 32, Issue 13, 2013, p. 39-42.
-
Shen H. M., Xiao X. B. Numerical method for vehicle-bridge coupled vibrations. Journal of Southwest Jiaotong University, Vol. 38, Issue 6, 2003, p. 658-662.
-
Mulcahy N. L. Bridge response with tractor-trailer vehicle loading. Earthquake Engineering and Structural Dynamics, Vol. 11, Issue 5, 1983, p. 649-665.
-
Sun Z., Nagayama T., Su D., et al. A damage detection algorithm utilizing dynamic displacement of bridge under moving vehicle. Shock and Vibration, Vol. 2016, Issue 6, 2016, p. 1-9.
-
Zhong H., Yang M., Gao Z. Dynamic responses of prestressed bridge and vehicle through bridge-vehicle interaction analysis. Engineering Structures, Vol. 87, 2015, p. 116-125.
-
Chang T. P. Structural identification of damages on a simplified bridge model in vehicle-bridge system from measured dynamic responses and sensitivity analysis. Journal of Vibroengineering, Vol. 17, Issue 5, 2015, p. 2314-2321.
-
Daniel L., Kortiš J. The comparison of different approaches to model vehicle-bridge interaction. Procedia Engineering, Vol. 190, 2017, p. 504-509.
-
Tan G. J., Wang W. S., Jiao Y. B., et al. Free vibration analysis of continuous bridge under the vehicles. Structural Engineering and Mechanics, Vol. 61, Issue, 3, 2017, p. 335-345.
-
Cheng Y. C., Tan G. J., Liu H. B., et al. Research of vehicle bump excitation in dynamic detection of simple supported bridge. Journal of Vibration Engineering, Vol. 22, Issue 5, 2009, p. 474-479.
About this article
This work was funded by the National Natural Science Foundation of China (Grant Nos. 51478203, 51408258), Training Program for Outstanding Young Teachers of Jilin University.

