Abstract
CA (Cellular Automaton) model was applied to the simulation of random traffic flow to develop a model considering the randomness of traffic flow and apply it to wind-vehicle-bridge coupling vibration. Finite element and neural network models were adopted respectively to numerically compute the vibration characteristics of bridges under wind and vehicle loads, verify the correctness of model. Subspace iteration method was used for the modal analysis of bridges. Natural frequencies of the top 8 orders were 0.21 Hz, 0.27 Hz, 0.36 Hz, 0.45 Hz, 0.56 Hz, 0.66 Hz, 0.87 Hz and 1.02 Hz respectively. The vibration frequency of the long-span bridge was consistent with the vibration characteristics of large-scale complex structures. Natural modes mainly reflected the torsion and bending of main beam and the swinging vibration of side and main towers. Fluctuation wind time-history presented periodic characteristics. The maximum and minimum values of fluctuation wind were about 20 m/s and –20 m/s respectively. The target and simulation values of power spectral density of wind speed were basically the same in change trend, which indicated that the fluctuation wind time-history computed in this paper was reliable. The model of dense traffic flow based on CA more truly described the running status like accelerating, decelerating and changing lanes of vehicles on the bridge, also contained the density information of vehicles and more truly reflected traffic characteristics. Vibration accelerations of the long-span bridge were symmetrically distributed. Vibration acceleration of central position in the left main span was the largest and near 50 cm/s2; vibration acceleration on the main tower was the smallest. The curve of vibration displacement with considering wind loads presented some fluctuations, while the vibration displacement of bridges without considering wind loads was very smooth. In addition, the amplitude of vibration displacement without considering wind loads moved laterally towards the left compared with that with considering wind loads. Therefore, wind loads must be considered when the vibration characteristics of the long-span bridge were computed. Otherwise, the accuracy of computational results would be reduced. It only took 0.5 hours to use neural network to predict the vibration acceleration of the long-span bridge. In the case of the same computer performance, it took 5 hours to use finite element model to predict the vibration acceleration of the long-span bridge. The advantage of neural network model in predicting the performance of large-scale complex structures like a long-span bridge could be obviously found. In the future, we will consider using neural network model to systematically study and optimize the long-span bridge.
1. Introduction
Bridges are structures of bearing loads. There are a lot of reasons for the vibration of bridges which can be generally divided into two types. The first type is vibration caused by external forces including earthquakes, wind loads and so on. The other type is the vibration of bridges caused by vehicles, and this kind of vibration is also inevitable. Wind is a kind of common natural force. The wind vibration of bridges is one of important vibration forms. Wind vibration will not only lead to the fatigue damage of bridge structures and reduce the safety of bridges, but also do damage to bridge structures. With the progress of science and technology, more and more long, thin and flexible bridges are applied by engineers to practice. These bridges become increasingly sensitive to wind, which makes researches on the wind resistance vibration of bridges increasingly important [1-3]. When a vehicle passes by a bridge, the bridge not only bears static loads caused by its weight, but also sustains the moving loads of the vehicle and the inertia force caused by vehicle vibration to the bridge. This kind of changing vibration force greatly increases the probability of fatigue failure of bridges and reduces the strength and reliability of various components. In addition, bridge vibration also causes the running vehicle to have a vertical acceleration and reduce the stability and safety of vehicles. When the vibration frequency of the vehicle is equal or similar to the natural frequency of the bridge, the resonance of bridges will be caused, which leads to the huge dynamic response of the bridge and damage of bridge structures [2-6]. In conclusion, bridge vibration caused by wind vibration and vehicle are two most important sources of vibration for the bridge. In addition, the two dynamic effects are usually coupled to cause bridge vibration. Bridge vibration makes the internal force of bridges much greater than the internal force of bridges computed by static force and causes the fatigue damage of bridge components. In the meanwhile, bridge vibration will cause the running vehicle to have a vibration acceleration, which thus reduces the stability and comfort of vehicles. With the application of more and more long, thin and flexible bridges, people have paid increasingly attention to the dynamic characteristics of bridges. Therefore, it is very important to study the coupling effect of vehicle-wind-bridge.
Based on the proposed force model and the established wind-vehicle-bridge coupling vibration model, Han [7] developed an analytical method of wind-vehicle-bridge coupling vibration considering the spatial correlation of force and compiled the computational programs. However, the computed bridge model was too simplified. Li [8] took a high-speed train as the studied object, adopted the numerical simulation with computational fluid mechanics, moving grid technique and local dynamic layer method to study the aerodynamic characteristics of two trains passing by the bridge under the crosswind. However, the correctness of complex computational model was not verified experimentally. Zhang [9] used the simplified Kalker creepage theory to define the acting force of lateral wheel rail, applied static wind force to simulate wind loads acting on vehicle and bridge and established a simplified wind-vehicle-bridge coupling model for a long-span bridge. However, the boundary conditions of the computational model were not completely consistent with the actual situation. To take into account the impact of vehicle motion on the aerodynamic characteristics of vehicle-bridge system under the crosswind, Li [10] tested the aerodynamic coefficients of vehicles and bridges under different working conditions based on the developed wind tunnel test system, and discussed the impact of vehicle speed, wind direction angle, position of vehicles on the bridge, and other factors on the aerodynamic characteristics of vehicles and bridges. However, the whole process totally depended on experimental test, which had very high cost and low efficiency. In addition, the studied object was excessively downsized and some detail features were neglected. Han [11] combined Lagrange method with virtual work principle and introduced mode superposition method to establish an analytical model for wind-vehicle-bridge coupling vibration, fitted a set of computational formulas considering the aerodynamic coefficients affecting bridges, perfected the analytical method of wind-vehicle-bridge coupling vibration and compiled corresponding computational programs. However, his research mainly focused on the vehicle and failed to involve the dynamic characteristics of bridges. In addition, theoretical computation simplified the model to some degree.
In the previous analysis of wind-vehicle-bridge coupling vibration, most of scholars chose a single three-dimensional vehicle model or only considered a certain vehicle load. In recent years, a small number of researchers have started to transfer studied focus to the analysis on the vibration response of bridges under the random traffic flow. In the vehicle-wind-bridge coupling vibration, researchers may simplify random traffic flow into a multi-vehicle distribution hypothetical mode or simplify statistical process. For a long-span bridge, such simplification cannot accurately predict the dynamic performance of actual vehicles. In this paper, CA model considering the randomness of the actual traffic flow was applied to the wind-vehicle-bridge coupling vibration. The vibration characteristics of bridges under wind and vehicle loads were numerically computed and the correctness was experimentally verified. To save computational time, finally, BP neural network model was adopted to predict the vibration characteristics of bridges, which greatly reduced the computational time and complexity of the model.
2. Finite element model of a long-span bridge
As shown in Fig. 1, the long-span bridge was a cable-stayed bridge with three towers and four spans. Two main spans were 450 m long. The whole bridge had an overall length of 1200m. The main tower of cable bent tower was 211 m high and 175 m high above bridge deck. The structural form of the main tower adopted portal frame. According to base scheme, separated cushion caps were finally selected. Bored cast-in-place piles were used under cushion caps. Under every cushion cap, there were 21 cast-in-place piles of Φ2 m. At the cable end, gravity-type anchor was adopted. Closed steel box beam was used as the main beam. With a width of 35 m, the box beam was in flat streamline, which was good for wind resistance. The main cable was made of the most commonly-used parallel steel wires. There was one main cable respectively on both sides.
Fig. 1Two-dimensional model and size of a long-span bridge

a) The whole model

b) Box beam model
According to the related size and model of the long-span bridge in Fig. 1, its three-dimensional geometric model was established, as shown in Fig. 2. As shown in Fig. 2, the main and side towers had different structural forms. If local structures adopted simplified geometrical shape and neglected model details, the reliability of the finite element computational model would be reduced, which affected the computational results. As a result, the three-dimensional geometric model in this paper focused on taking into account detail features.
For structural analysis, its mechanics modeling is the key to the whole analysis. The correctness of modeling determines the rationality of computational results. For large-scale complex structures, a reasonable finite element model can accurately reflect the essence and characteristics of structures. The establishment of the finite element model should lay emphasis on the simulation of structural rigidity, quality and boundary conditions. The three factors are directly related to the characteristics of structures and try to be consistent with the actual structure. A long-span suspension bridge is equipped with large flexibility. The change of any external condition may lead to great changes in its shape and rigidity. Therefore, it is required to reasonably simplify the structure and ensure the rationality of structural stress and the simplicity of model in the case of mechanics modeling. As a kind of large finite element software, ANSYS software is widely applied in the modeling and analysis of long-span bridges. The finite element model of bridges was established based on ANSYS software. Bridge deck structure and bridge tower were simulated by hexahedral solid elements. Main cables were simulated by tension-only elements. The whole bridge contained 61,802 nodes and 56,087 solid elements in total. The preloads of main cables were applied in the form of internal force of initial elements. Bridges were fixed in the position of anchor and pile bottom. For the convenience of choosing different component types in the future, different components should select different material numbers. As the structure was symmetrical, a half of model was established for the convenience of modeling. Then, symmetry was used along the symmetry plane to obtain the whole model, as shown in Fig. 3.
Fig. 2Three-dimensional model of local structures
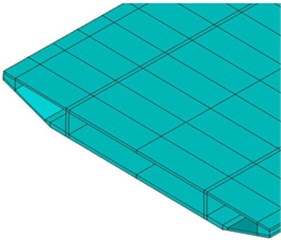
a) Box beam
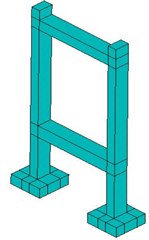
b) Side tower
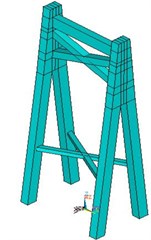
c) Main tower
Fig. 3Finite element model of the long-span bridge
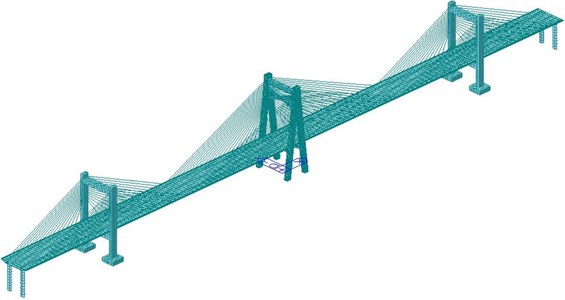
Due to large longitudinal size, the long-span bridge could not observe local features from the whole finite element model. Therefore, the zoomed grid model of bridges was extracted, as shown in Fig. 4. It could be seen from Fig. 4(a) that the suspension cable between side tower and main beam was connected by element nodes. The side tower used regular solid hexahedral elements for division. It could be seen from Fig. 4(b) that the main box beam structure also adopted hexahedral elements with a length of about 2 m. As displayed from Fig. 4(c), different beams in the main tower were connected by common nodes rather than constrained boundary conditions.
Main beam, main and side towers were made of concrete. Elasticity modulus was E= 3.5e10 Pa; Poisson’s ratio was μ= 0.17; density was ρ= 2055 kg/m3. Suspension cables adopted galvanized high-strength steel wires. Elasticity modulus was E= 1.9e10 Pa; Poisson’s ratio was μ= 0.25; density was ρ= 1200 kg/m3. The geometric characteristic and mass of all cross-sections were at the main beam of bridges. The cross beam was relatively a rigid component which only had transferability. The main beam was fully bleached and released longitudinal restraint at cable bent tower and two bridge ends. The bottom of cable bent tower was completely constrained, as shown in Fig. 5.
Fig. 4Finite element model of local structures of the long-span bridge
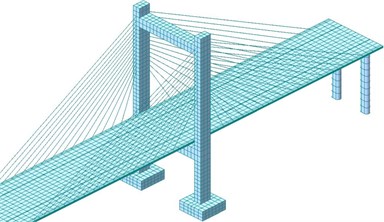
a) Finite element model of side tower
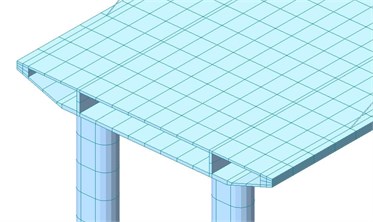
b) Finite element model of box beam
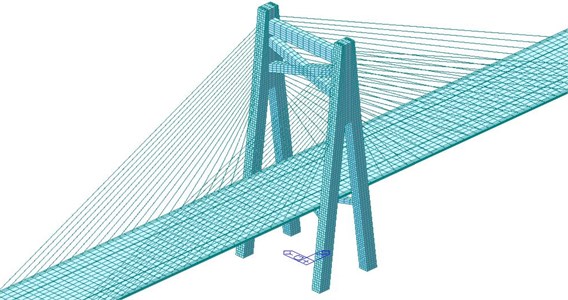
c) Finite element model of main tower
Fig. 5Boundary conditions of the long-span bridge
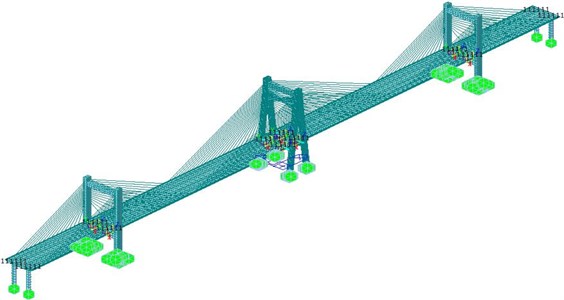
3. Natural modal of the long-span bridge
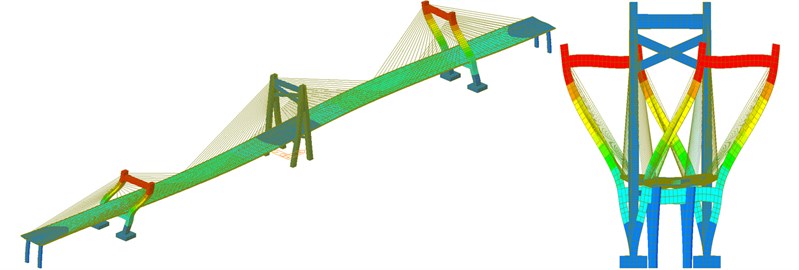
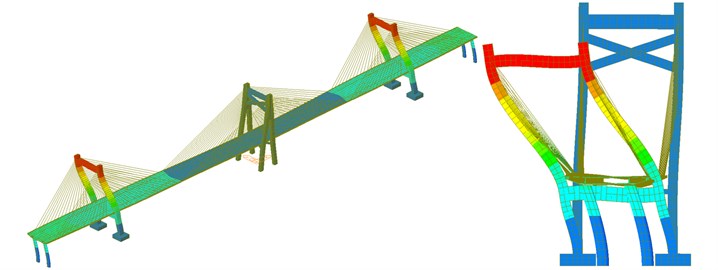
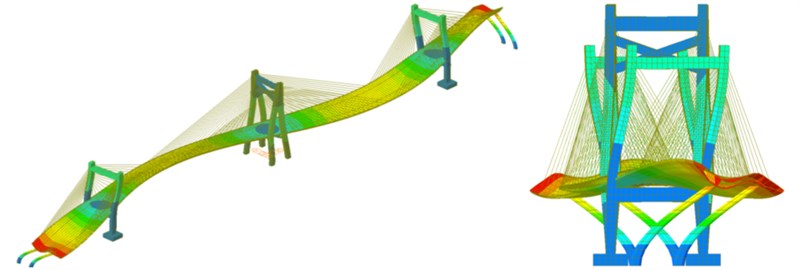
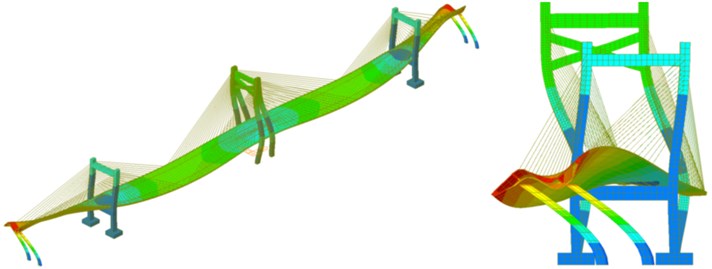
Modal analysis is the starting point of dynamics analysis including harmonic response analysis, transient analysis and response spectrum analysis. Modal analysis is usually used to determine the vibration characteristics of structures and compute the natural frequency and mode of structures. These parameters are important parameters of structures bearing dynamic loads and also the foundation for other various kinds of dynamics analysis of structures. In modal analysis, low-order modes play a role in controlling structures. This paper adopted a large finite element software ANSYS, used the subspace iteration method for the modal analysis of bridges and extracted modes on top 8 orders, as shown in Fig. 6. Corresponding natural frequencies were 0.21 Hz, 0.27 Hz, 0.36 Hz, 0.45 Hz, 0.56 Hz, 0.66 Hz, 0.87 Hz and 1.02 Hz respectively.
Fig. 6Natural modes of the long-span bridge
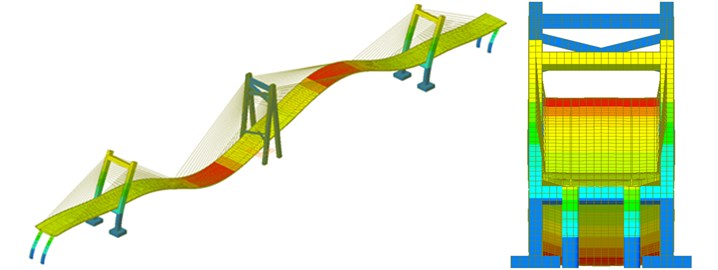
a) The first-order mode
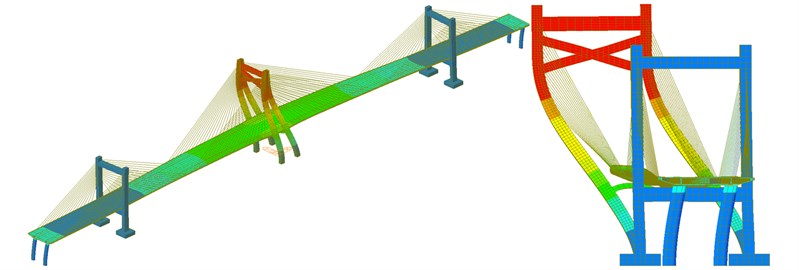
b) The second-order mode
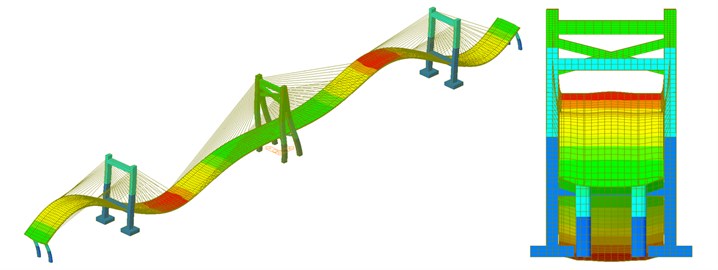
c) The third-order mode
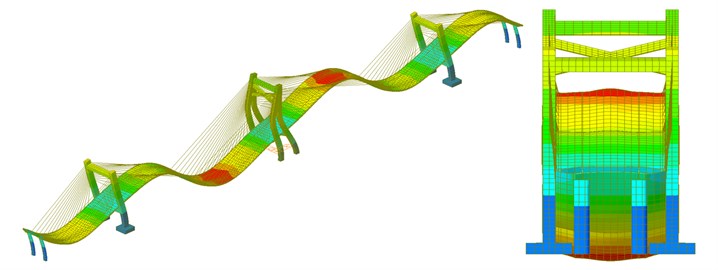
d) The fourth-order mode
e) The fifth-order mode
f) The sixth-order mode
g) The seventh-order mode
h) The eighth-order mode
As shown in Fig. 6, the natural mode of the long-span bridge mainly reflected the torsion and bending of main beam and the swinging vibration of side and main towers. The vibration frequency of the long-span bridge was consistent with the vibration characteristics of large-scale complex structures. Namely, there were small differences between frequencies of all orders and concentration phenomenon appeared in frequencies. Main and side towers had a hollow structure with a certain height and weak flexural rigidity. The bending vibration of main tower appeared in the second order while the bending vibration of side tower appeared in the fifth and sixth orders and the frequency of side tower were higher than that of main tower, which indicated that the higher the tower column of the long-span bridge was, the smaller its rigidity would be. The torsional vibration of main beam appeared in the seventh and eighth orders while the bending vibration of main beam appeared in the top several orders. Similar to other long-span bridges, the natural vibration characteristics of bridges in this paper were relatively complex. Due to the effect of stay cable, bending and torsion were coupled in high-order modes. As a result, there were not modes of pure torsion. The first-order mode reflected the first-order bending vibration. The third-order mode started to present weak second-order bending vibration. In the fourth-order mode, two-order bending vibration of bridges was more obvious.
4. Numerically computational model of vehicle-bridge-wind coupling vibration
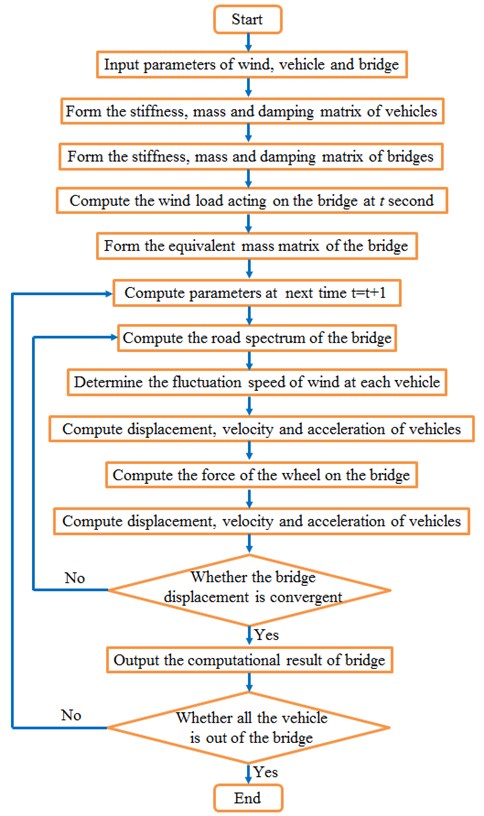
The coupling vibration of vehicle-bridge-wind could not be directly solved through single finite element software. Therefore, this paper co-developed the program of vehicle-bridge-wind coupling vibration based on MATLAB and ANSYS. The development of vehicle-bridge-wind program was realized by combining the analytical program of wind with vehicle-bridge coupling vibration. The solving method was still a system coupling. Namely, vehicle-bridge was taken as a whole. Wind loads acted on the bridge as external loads. Internal excitation was road surface irregularity. The process flow of vehicle-bridge-wind coupling vibration was shown in Fig. 7.
4.1. Numerical simulation of wind speed time-history
The wind loads of bridges were related to wind speed. The solving flow of wind speed time-history was as follows. When a vehicle was on the bridge, its position changed with time. In this case, the vibration characteristics of vehicle-bridge coupling vibration system changed with time. Therefore, time-domain analysis was usually conducted to study this system. Many methods could be adopted to numerically simulate random wind speed field. Its basic assumptions included: Bridge deck had equal height in the horizontal direction; average wind speed and wind speed spectrum along the bridge deck were constant; the distance between any two wind speed simulation points was the same. The lateral time-history wind speed at the jth node of main beam of bridges was μ(t) [12-14]:
wherein, Δω is the frequency interval between spectrum lines; N is the sum of frequency components; j= 1, 2,..., n, n is the total number of wind speed simulation points of bridges; Su(ω) is the self-power spectrum of lateral wind speed; φmk is random variables uniformly distributed between 0-2π; G(ω) is the correlation coefficient matrix between different wind speed simulation points. Suppose there were n wind speed simulation points uniformly distributed along the horizontal direction of bridges, then:
λ is a dimensionless attenuation factor, whose value changed from 7 to 10; ˉU(z) is the average wind speed at the height of main beam; d is the horizontal spacing between wind speed simulation points. Therefore, the horizontal distance between any two points like j and m is Δjm=d|j-m|. Average wind speed ˉU(z) is an important index used to describe the change rule of wind field along the height of structures. It was widely believed that ˉU(z) conformed to logarithmic rule:
wherein: k= 0.4 is called as Kaman constant; z0 is ground roughness; u is friction speed.
Fig. 7Solving flow of vehicle-bridge-wind coupling vibration
Aimed at the long-span bridge studied in this paper, MATLAB with harmonic superposition method was adopted to realize the simulation process of random wind field. Fig. 8 displayed the schematic diagram for the long-span bridge. There were 24 wind speed simulation points with an interval of 50 m in total. Wind speed spectrum adopted Kaimal spectrum; ground roughness wasz0= 0.03; average wind speed was ˉU(z)= 40 m/s. Harmonic superposition method was adopted to generate the following computation process of MATLAB of wind speed time-history curve of natural wind: The first step was to set the parameters of wind speed time-history; the second step was to generate target power spectrum and simulate the time-history of fluctuation wind speed at the first point; finally, the random phase of various points from 2 to 24 was computed accordingly and the fluctuation wind speed time-history of points from 2 to 24 was simulated.
Fig. 8Action points of fluctuation wind of the long-span bridge

The above formula was combined with MATLAB to compute the fluctuation wind time-history of 24 simulation points. The fluctuation wind time-history of simulation points at the left and right side spans and main span was extracted, as shown in Fig. 9. As shown in Fig. 9, different simulation points showed great differences in fluctuation wind time-history, fluctuated around 0 and presented certain periodic characteristics. The maximum value of fluctuation wind was about 20 m/s and the minimum value of fluctuation wind was near –20 m/s.
Fig. 9Fluctuation wind time-history of different simulation points
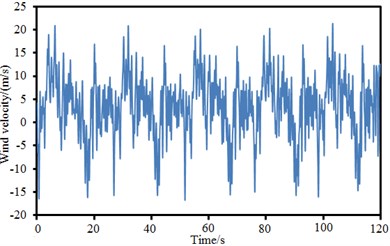
a) Left side span point
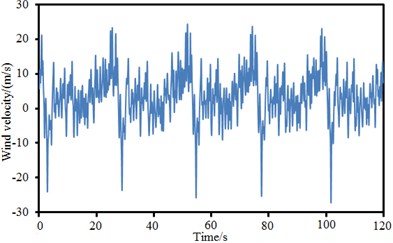
b) Left main span point
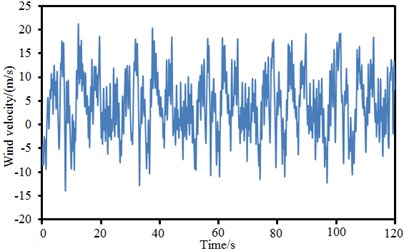
c) Right side span point
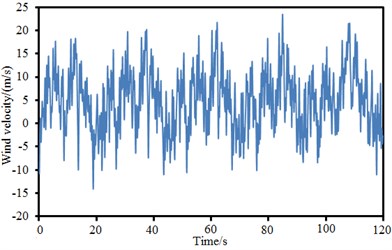
d) Right main span point
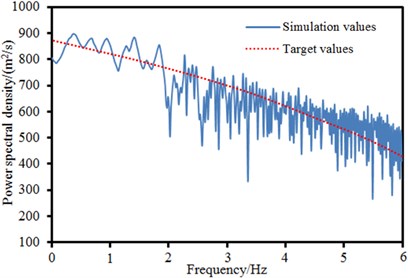
The power spectral density function of wind speed was an important parameter describing fluctuation wind speed, a random process. It represented the contribution of various frequency components in the natural wind of turbulent flow. Inspection results of power spectral density function of several discrete points of the long-span bridge in Fig. 9 were given, as shown in Fig. 10. The target value of power spectral density function of wind speed could be obtained by the computation of related formulas. The simulation value was solved by fluctuation wind speed time-history obtained by computation through Fourier transform. It could be seen from the figure that the change trends of target and simulation values were basically the same, which indicated that the fluctuation wind time-history computed in this paper was reliable.
Fig. 10Wind power spectral density of different simulation points
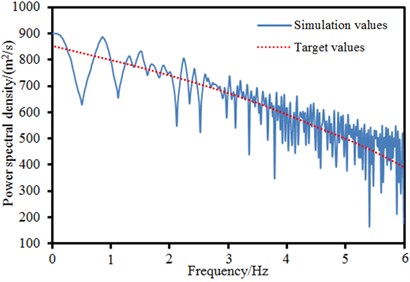
a) Left side span point
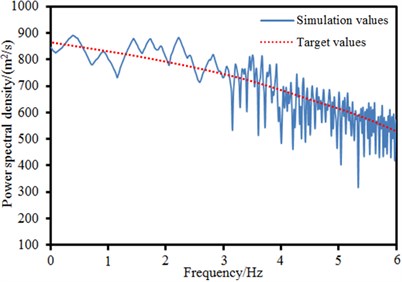
b) Left main span point
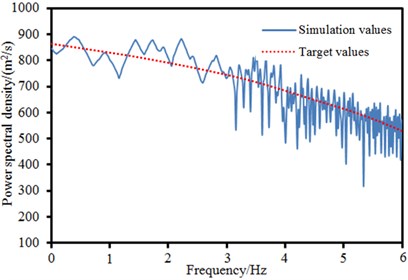
c) Right side span point
d) Right main span point
4.2. Random road spectrum
Road surface conditions are important factors which affect the dynamic response of bridges and vehicles. Road surface roughness usually conforms to the steady Gaussian function of zero mean value. The function could be obtained by power spectral density function through Fourier transform and expressed as [15-18]:
wherein, θk is the uniform distribution of random phase in 0-2π; φ(nk) is the power spectral density function of road surface elevation. The power spectral density used in this paper was as follows:
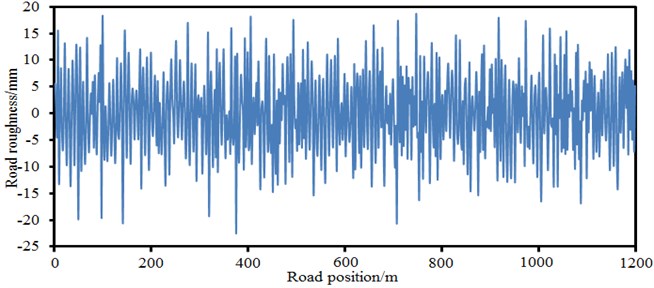
wherein: nk is spatial frequency; n0 is spatial frequency with a period of 1/2π; φ(n0) is the coefficient of road surface roughness, whose value was selected according to road surface condition; n1 and n2 are upper and lower cutoff frequencies. The International Organization for Standardization proposed the classification indexes of road surface roughness. The road surface spectrum of the long-span bridge could be obtained according to the above formula, as shown in Fig. 11.
Fig. 11Road surface roughness of the long-span bridge
4.3. Vehicle loads
There were many vehicles on the long-span bridge in general. In addition, the type, lane, longitudinal position and so on of vehicles were not completely the same. Vehicles usually ran in two directions and gradually got to the bridge. It would obviously occupy memory and increase computational time if the position of a vehicle and corresponding road surface roughness were judged at each load step. After probability density function was established, an appropriate sampling method could be adopted to generate a model of random traffic flow and conduct batch processing. Monte-carlo sampling method was random sampling according to probability density function. Parameters of vehicle samples did not change with time. However, actual vehicles would accelerate, decelerate, and change lanes in the process of running. Monte-carlo method could not simulate these behaviors. CA method [19-22] had a good practicability here. The simulation principle of random traffic flow based on CA method was shown in Fig. 12. In the figure, lanes on the bridge were divided into many cells of equal size. Every cell accommodated a vehicle at the moment of t. Vehicle speed could be expressed by cells running at every time interval. The third vehicle passed by 2 cells in unit time, which showed that the vehicle ran at a normal speed. The first vehicle passed by 3 cells in unit time, which indicated that the vehicle accelerated. The second vehicle passed by 1 cell in unit time, which indicated that the vehicle decelerated. In this paper, related parameters of CA model were as follows: Cells had a length of 5 m; time step was 1 s; the number of cells was 200; vehicle density was 2.7 %; the probability of changing lanes was 10 %. The model of dense traffic flow based on CA more truly described the running status like accelerating, decelerating and changing lanes of vehicles on the bridge, also contained the density information of vehicles and more truly reflected traffic characteristics. The load effect of traffic flow and the dynamic response characteristics of bridge simulated by CA traffic model could refer to reference [22].
According to the studied results of Chen [23], the mutual acting force between vehicles and bridges was less affected by front and rear vehicles when traffic flow passed by the bridge. Therefore, the mutual acting force between every vehicle and the bridge could be extracted alone. Chen proposed the heavy load method of equivalent dynamic axle accordingly. The expression formula was as follows:
wherein, j is the jth vehicle on the bridge; Kiv1 and Civ1 are the spring rigidity and damping matrix of the vehicle at the ith axle respectively; n is the number of axles of the vehicle; Yiv1 and ˙Yiv1 are the displacement and sped of vehicles; t is the time step used for the analysis of vehicle-bridge coupling vibration; Gj is the weight of the jth vehicle; Rj(t) is dynamic force between vehicles and bridges. EDWL method could be applied to transform every axle load into concentrated force and input into the finite element model of coupling vibration.
Fig. 12Schematic diagram for the random traffic flow based on CA

a)t second

b)t+1 second
5. Computational results and analysis of vehicle-bridge-wind coupling vibration
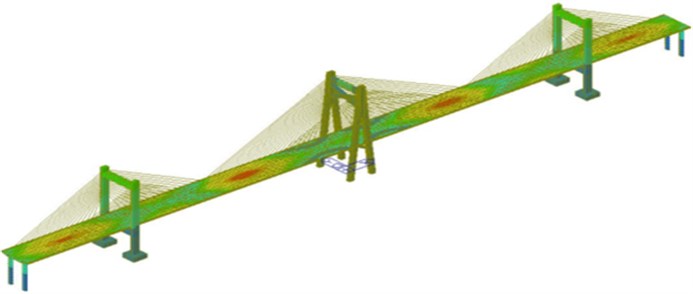
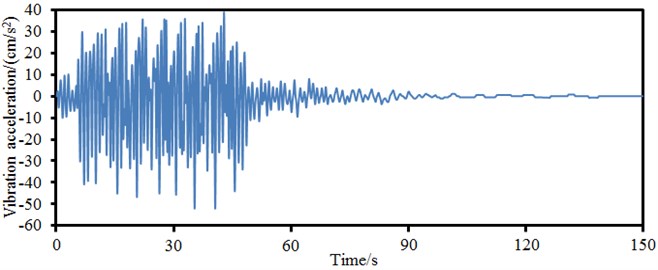
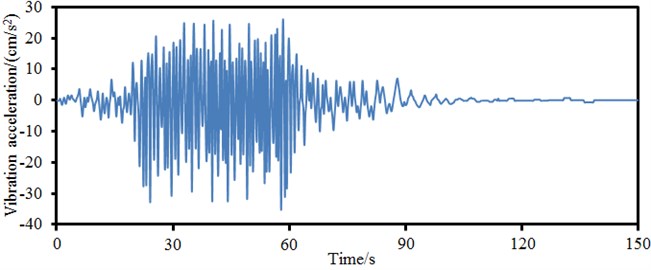
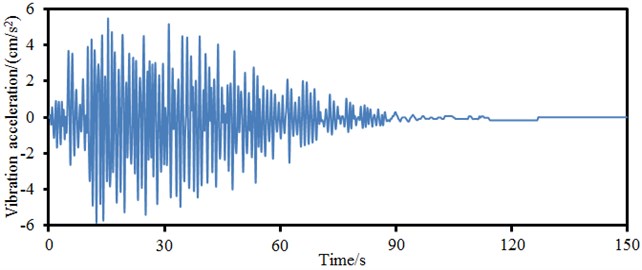
The program of vehicle-bridge-wind coupling vibration was co-developed based on MATLAB and ANSYS, which could obtain the dynamic response of the long-span bridge. Fig. 13 displayed the contour for the vibration acceleration of the long-span bridge. It could be seen from the figure that the contour for the vibration acceleration of the long-span bridge was symmetrical. Vibration acceleration of central position in the left span was larger than that in other positions. Therefore, curves of vibration accelerations at the left side span and main span of bridges, at the center of bridge deck and on the main tower were extracted, as shown in Fig. 14.
Fig. 13Contour for the vibration displacement of the long-span bridge
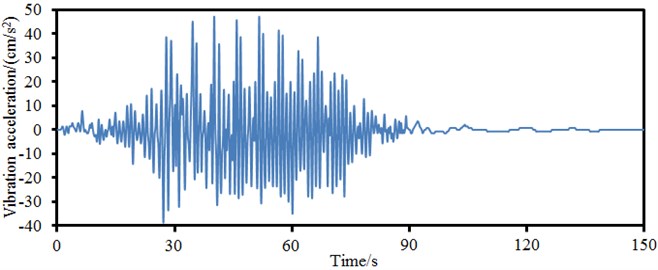
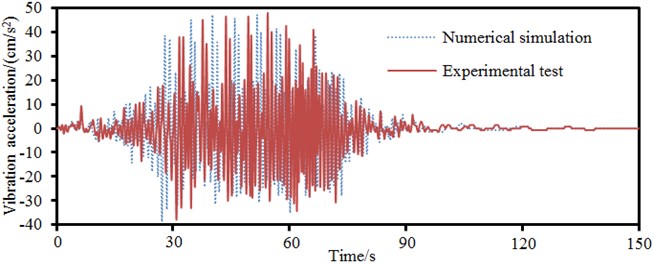
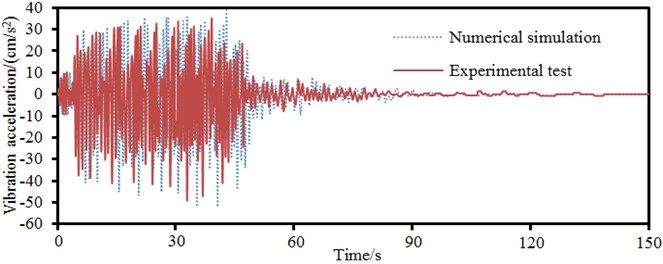
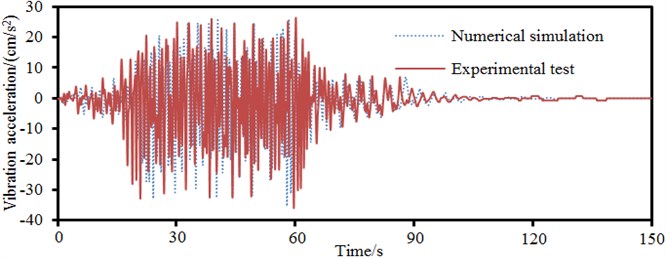
As shown in Fig. 14, vibration acceleration of central position in the left main span was the largest and near 50 cm/s2. However, vibration acceleration on the main tower was the smallest. On the one hand, the rigidity of the main tower was larger than that of the main beam of bridge. On the other hand, vehicle and wind loads firstly acted on main beam and transmitted to the main tower through stay cable later, whose vibration energy attenuated in the process of transmission.
Fig. 14Accelerations of key cross-sections of the long-span bridge
a) Central position in the left main span
b) Central position in the left side span
c) Central position in the main beam
d) Main tower
As shown in Fig. 14(a), large vibration accelerations mainly appeared from 30 s to 60 s. Vehicles ran at the speed of 50 km/h; the bridge was 1200 m long; the running time of vehicles on the bridge was near 90 s; it took the vehicle about 45 s to reach the mid-span of bridges. Therefore, excitation at this time would be the largest, which led to large vibration acceleration of the bridge. Similarly, other points had large vibration accelerations also because the vehicle was around the position.
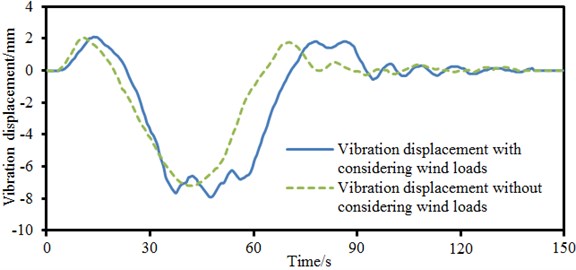
The vibration displacement of key cross-sections of the long-span bridge was obtained based on computed vibration accelerations, as shown in Fig. 15. As shown in Fig. 15, vibration displacement in the left main span was relatively the largest; the vibration displacement of the main tower was near 0. The maximum and minimum values of vibration displacement were 2.0 mm and –8.0 mm respectively. To take into account the impact of wind loads on the vibration characteristics of the long-span bridge, vibration displacements with and without considering wind loads in the left main span were computed respectively, as shown in Fig. 16. It could be seen from Fig. 16 that the curve of vibration displacement with considering wind loads presented some fluctuations; the vibration displacement of bridges without considering wind loads was rather smooth; in addition, the amplitude of vibration displacement without considering wind loads moved laterally towards the left compared with that with considering wind loads. As a result, wind loads must be considered in the case of computing the vibration characteristics of the long-span bridge. Otherwise, the accuracy of computational results would be reduced.
Fig. 15Displacements of key cross-sections of the long-span bridge
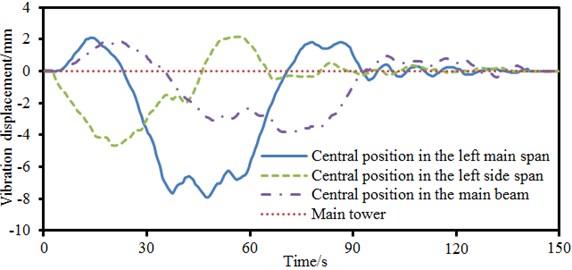
Fig. 16Impact of wind loads on the displacement of bridges
Such a complex long-span bridge was affected by many parameters. Therefore, the correctness of model needed to be verified. Through referring to numerical simulation, 4 servo acceleration sensors with the sampling frequency of 100 Hz were arranged in the left side and main spans of the long-span bridge, at the center of main beam and on the main tower, as shown in Fig. 17. When the vehicle ran on the bridge at a normal speed, the data of acceleration sensor was recorded and processed after being imported into Pulse software to obtain vibration acceleration in the time domain and compare with numerically computational results, as shown in Fig. 18. Experiment and numerical simulation showed a good agreement. In most cases, numerical simulation results were slightly larger than experimental test results. It was mainly because numerical simulation considered a rather ideal boundary condition and the boundary conditions of experiment were relatively complex. It was impossible to realize the complete consistency of experimental and numerical computation. However, the numerically computational model in this paper was reliable on the whole.
Fig. 17Experimental test on the vibration acceleration of the long-span bridge

6. Prediction for the vibration characteristics of the long-span bridge based on neural network
Finite element method can reflect the dynamic characteristics of bridges in detail, and especially in the vibration of local structures. It is widely applied in the non-linear computation of structures. However, small integration steps have to be adopted due to the large quantity of freedom degree and in order to satisfy convergence. Computational speed is very low. Especially large-scale bridges with tens of thousands of nodes need to occupy a lot of computer memory and time, which leads to lower computational efficiency. BP neural network is the most commonly-used and mature neural network at present. The nonparametric modeling method of BP neural network has advantages including less modeling time, strong generalization ability and fault-tolerant capability, simple model structure and so on. This paper took wind loads, road surface roughness and vehicle loads as input. In this case, the input layer had 3 nodes. The corresponding vibration of bridges was taken as output. A prediction model for the system neural network of the long-span bridge was established, as shown in Fig. 19. The accuracy of network could not be ensured if the node number of hidden layer of neural network was too small; generalization ability would reduce if the node number of hidden layer of neural network was too large. Empirical traversal method was the best method of determining the node number of hidden layer, namely training network through selecting different nodes of hidden layer and choosing the node number in the case of the best performance. This paper applied the traversal method to determine the node number of hidden layer of network as 20. The model completely reflected the interactive relationship between various loads and the vibration of bridges. Long-span bridge system was a large nonlinear continuous system. The transformation function of BP neural network was nonlinear continuous differentiable function. The nonlinear problem could be simplified by means of high-dimensional transformation in order to achieve the goal of accurate modeling. In Section 5, the acquisition time of vibration acceleration of the long-span bridge was 150 s. The data of the top 50 s could be taken as training data and the data of latter 100 s was taken as test data. After the parameters of model including nodes of input and hidden layers were determined, training data of 50 s was adopted to train neural network model. After model training, training data was taken as model input to predict the corresponding vibration acceleration of bridges and verify the training status of model. Later, test data was taken as model input to predict the corresponding vibration acceleration input of bridge and verify the prediction performance of model.
Fig. 18Accelerations of key cross-sections between experiment and simulation
a) Central position in the left main span
b) Central position in the left side span
c) Central position in the main beam
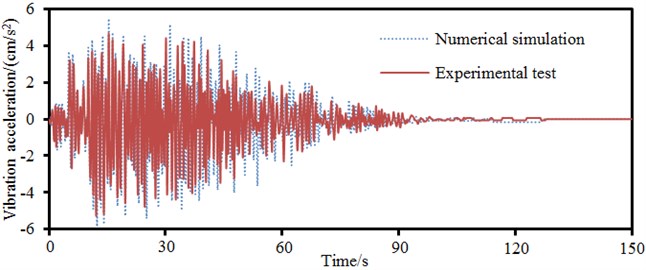
d) Main tower
Fig. 20 displayed a comparison of neural network model input of vibration acceleration of bridges and true value under the input of training and test data. It could be seen that the constructed neural network model could accurately predict the vibration acceleration of bridge and had good generalization performance and the best network structure. In addition, this paper only spent 0.5 hours in using neural network model to predict the vibration acceleration of the long-span bridge. In the case of the same computer performance, it took 5 hours to use finite element to predict the vibration acceleration of the long-span bridge. The advantage of neural network model in predicting the performance of large-scale complex structures like a long-span bridge could be obviously found.
Fig. 19Topological network of BP neural network
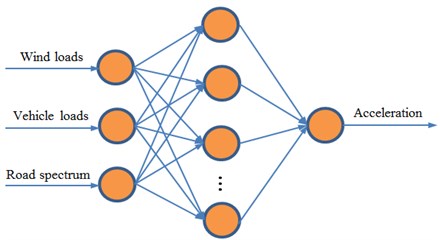
Fig. 20Training and prediction results of BP neural network model
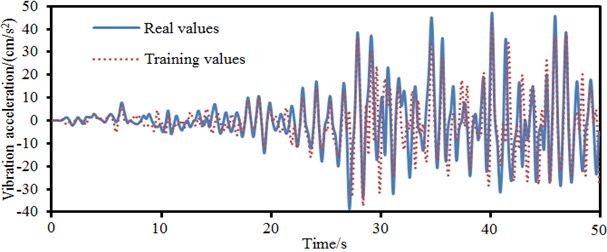
a) BP neural network training
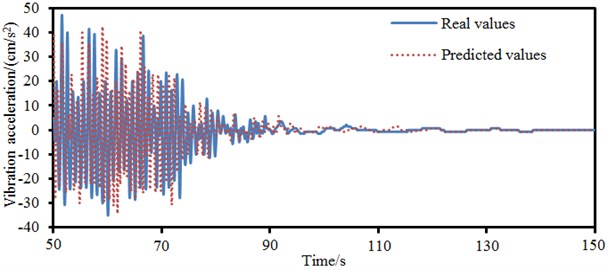
b) Prediction results of BP neural network
7. Conclusions
CA (Cellular Automaton) model was applied to the simulation of random traffic flow to develop a model considering the randomness of traffic flow and apply it to wind-vehicle-bridge coupling vibration. Finite element and neural network models were adopted respectively to numerically compute the vibration characteristics of bridges under wind and vehicle loads, and verify the correctness of model and achieved the following conclusions.
1) Subspace iteration method was used for the modal analysis of bridges. Natural frequencies of the top 8 orders were 0.21 Hz, 0.27 Hz, 0.36 Hz, 0.45 Hz, 0.56 Hz, 0.66 Hz, 0.87 Hz and 1.02 Hz respectively. The vibration frequency of the long-span bridge was consistent with the vibration characteristics of large-scale complex structures. Namely, there were small differences between frequencies of all orders and concentration phenomenon appeared in frequencies. Natural modes mainly reflected the torsion and bending of main beam and the swinging vibration of side and main towers.
2) Fluctuation wind time-history presented periodic characteristics. The maximum and minimum values of fluctuation wind were about 20 m/s and –20 m/s respectively. The target and simulation values of power spectral density of wind speed were basically the same in change trend, which indicated that the fluctuation wind time-history computed in this paper was reliable.
3) The model of dense traffic flow based on CA more truly described the running status like accelerating, decelerating and changing lanes of vehicles on the bridge, also contained the density information of vehicles and more truly reflected traffic characteristics.
4) Vibration accelerations of the long-span bridge were symmetrically distributed. Vibration acceleration of central position in the left main span was the largest and near 50 cm/s2; vibration acceleration on the main tower was the smallest. The curve of vibration displacement with considering wind loads presented some fluctuations, while the vibration displacement of bridges without considering wind loads was very smooth. In addition, the amplitude of vibration displacement without considering wind loads moved laterally towards the left compared with that with considering wind loads. Therefore, wind loads must be considered when the vibration characteristics of the long-span bridge were computed. Otherwise, the accuracy of computational results would be reduced.
5) It only took 0.5 hours to use neural network to predict the vibration acceleration of the long-span bridge. In the case of the same computer performance, it took 5 hours to use finite element model to predict the vibration acceleration of the long-span bridge. The advantage of neural network model in predicting the performance of large-scale complex structures like a long-span bridge could be obviously found. In the future, we will consider using neural network model to systematically study and optimize the long-span bridge.
References
-
Diana G., Yamasaki Y., Larsen A., et al. Construction stages of the long span suspension Izmit Bay Bridge: Wind tunnel test assessment. Journal of Wind Engineering and Industrial Aerodynamics, Vol. 123, 2013, p. 300-310.
-
Firouzi M., Gharehpetian G. B. Improving fault ride-through capability of fixed-speed wind turbine by using bridge-type fault current limiter. IEEE Transactions on Energy Conversion, Vol. 28, Issue 2, 2013, p. 361-369.
-
Hong A. L., Ubertini F., Betti R. Wind analysis of a suspension bridge: identification and finite-element model simulation. Journal of Structural Engineering, Vol. 137, Issue 1, 2010, p. 133-142.
-
Bu J. Q., Law S. S., Zhu X. Q. Innovative bridge condition assessment from dynamic response of a passing vehicle. Journal of Engineering Mechanics, Vol. 132, Issue 12, 2006, p. 1372-1379.
-
Ni Y. Q., Ye X. W., Ko J. M. Monitoring-based fatigue reliability assessment of steel bridges: analytical model and application. Journal of Structural Engineering, Vol. 136, Issue 12, 2010, p. 1563-1573.
-
Ye X. W., Ni Y. Q., Wong K. Y., et al. Statistical analysis of stress spectra for fatigue life assessment of steel bridges with structural health monitoring data. Engineering Structures, Vol. 45, 2012, p. 166-176.
-
Han Y., Chen H., Liu Y. F., Cai C. S., Zhang J. R. Effect of the coherence of buffeting forces bridges on the coupled dynamic response of wind-vehicle-bridge system. Journal of Hunan University, Vol. 42, Issue 9, 2015, p. 82-88.
-
Li Y. L., Yang Y., Wu M. X., Qiang S. Z. Aerodynamic characteristics in the process of two trains passing each other on bridge under cross wind action. China Railway Science, Vol. 36, Issue 2, 2015, p. 37-44.
-
Zhang M., Zhang N., Xia H. Analysis on wind-vehicle-bridge dynamic interaction for long-span railway suspension bridge. China Railway Science, Vol. 34, Issue 4, 2013, p. 14-21.
-
Li Y. L., Hu P., Zhang M. J., Xu Y. L. Aerodynamic characteristics of vehicle-bridge system under cross wind parameter studies based on wind tunnel test. Journal of Southwest Jiaotong Universtiy, Vol. 47, Issue 2, 2012, p. 210-217.
-
Han Y., Chen H., Shen L., Cai C. S. Effects of aerodynamic parameters on coupled dynamic responses of wind-vehicle-bridge system. China Journal of Highway and Transport, Vol. 28, Issue 9, 2015, p. 57-66.
-
Sahraoui F., Belmont G., Goldstein M. L. New insight into short-wavelength solar wind fluctuations from Vlasov theory. The Astrophysical Journal, Vol. 748, Issue 2, 2012, p. 100.
-
Bruno R., Trenchi L. Radial dependence of the frequency break between fluid and kinetic scales in the solar wind fluctuations. The Astrophysical Journal Letters, Vol. 787, Issue 2, 2014, p. L24.
-
Baile R., Muzy J. F. Spatial intermittency of surface layer wind fluctuations at mesoscale range. Physical Review Letters, Vol. 105, Issue 25, 2010, p. 254501.
-
Yin X., Fang Z., Cai C. S. Lateral vibration of high-pier bridges under moving vehicular loads. Journal of Bridge Engineering, Vol. 16, Issue 3, 2010, p. 400-412.
-
Deng L., Cai C. S. Bridge model updating using response surface method and genetic algorithm. Journal of Bridge Engineering, Vol. 15, Issue 5, 2009, p. 553-564.
-
Shankar T. J., Sokhansanj S., Bandyopadhyay S., et al. A case study on optimization of biomass flow during single-screw extrusion cooking using genetic algorithm (GA) and response surface method (RSM). Food and Bioprocess Technology, Vol. 3, Issue 4, 2010, p. 498-510.
-
Trinh T. K., Kang L. S. Application of response surface method as an experimental design to optimize coagulation tests. Environmental Engineering Research, Vol. 15, Issue 2, 2010, p. 63-70.
-
Wang Y., Long D., Shi F. Cellular automation model for analyzing capacity of branch road section. Journal of Central South University of Technology, Vol. 18, Issue 5, 2011, p. 1744-1749.
-
Rao P., Zhou X. D., Zhu K. J., et al. Cellular automation simulation of pedestrian evacuation under complex building structure. Zhongguo Anquan Kexue Xuebao, Vol. 21, Issue 12, 2011, p. 34-39.
-
Larraga M. E., Alvarez-Icaza L. Cellular automaton model for traffic flow based on safe driving policies and human reactions. Physica A: Statistical Mechanics and its Applications, Vol. 389, Issue 23, 2010, p. 5425-5438.
-
Chen S. R., Wu J. Modeling stochastic live load for long-span bridge based on microscopic traffic flow simulation. Computers and Structures, Vol. 89, Issue 9, 2011, p. 813-824.
-
Chen S. R., Cai C. S. Equivalent wheel load approach for slender cable-stayed bridge fatigue assessment under traffic and wind: feasibility study. Journal of Bridge Engineering, Vol. 12, Issue 6, 2007, p. 755-764.

