Abstract
The paper established a computational model of aerodynamic noises for 3-train formation including 3 trains, 6 bogies and 2 windshields. Based on Lighthill acoustic theories, a wideband noise source model was used to recognize the aerodynamic noise source of the high-speed train. Aerodynamic pressures of the high-speed train were extracted and compared with experimental results. The change trends and values presented a good consistency, which indicated that the computational model in this paper was effective. Large Eddy Simulation (LES) and FW-H acoustic model was then used to conduct numerical simulation of aerodynamic noises of the high-speed train. Aerodynamic noise characteristics in the far field of the high-speed train were analyzed. Analyzed results showed that when the high-speed train was running at the speed of 250 km/h, main energy was concentrated within 1250-3150 Hz, and the noise was a wideband noise in the analyzed frequency. The longitudinal observation point was 25 m away from the track center line and 25 m away from the nose tip, and its sound pressure level reached the maximum value of 89.7 dBA, while the sound pressure level around six bogies reached local maximum. With the larger distance from the track center line, the sound pressure level at horizontal observation points presented a smaller attenuation. Incoming flow had a larger impact on aerodynamic noises around the train than the tail flow. The main noise sources of a high-speed train were located at nose tip and pilot of head train, the second noise source was bogies, and the third noise source was located at train connections.
1. Introduction
With the development of railway industry especially the rapid construction of high-speed trains, the running speed of high-speed trains is faster, while the aerodynamic noise has become more and more serious. Researches show that when the running speed of a high-speed train reaches 300 km/h, its aerodynamic noise would exceed the wheel-rail noise, becoming the major noise source. Aerodynamic noises are in a direct proportion to 6th power of its speed [1]. When the running speed of high-speed trains reaches 350 km/h, the aerodynamic noise will not only cause noise pollution in the train, but will also reduce passengers’ comfort and bring serious influences on normal life of residents living along the railway [2]. Therefore, it is necessary to study aerodynamic noises of high-speed trains as well as the contribution of main sound sources to the total noise in order to reduce the noise.
At present, researches on the aerodynamic noises of high-speed trains have achieved a lot of results through experiments. Nagakura adopted wind tunnel test, acoustic array technique and Lighthill acoustic analogy theory to point out that the main aerodynamic noise sources of a high-speed train were pantographs, bogies, nose tip, pilot, train head, train tail, windows, doors, connections and skirt plate [2-6]. Due to the complexity of the studied problem, these reported researches focused on paying attention to aerodynamic noises of appendages in the high-speed train and failed to involve the far-field aerodynamic noises of the whole train. In addition, studying aerodynamic noises of appendages in the high-speed train completely through wind tunnel test will increase the cost and reduce the efficiency. To solve the deficiencies of experimental research, numerical simulation for the high-speed train is particularly important. Sun [7] adopted nonlinear acoustic solution method to study near-field aerodynamic noises, established noise planes around noise sources and applied FW-H equation to evaluate far-field noises. However, the correctness of computational results was not verified by experiments. Zhu [8] numerically computed the aerodynamic noises of simplified bogies of high-speed trains and provided a foundation for the theoretical research of bogies. However, bogies were oversimplified, and they were not installed in the high-speed train for research. Therefore, boundary conditions were different from the actual situation. Thompson [9] has built a component based model to predict the aerodynamic noise from high-speed trains. However, this model could not observe noises at bogies, pantographs and connections in the high-speed train. Yuan [10] established a computational model including head train and tail train, and computed the intensity of aerodynamic noise sources and far-field aerodynamic noises on the surface of the high-speed train, which improved computational accuracy compared with only establishing a train head. Yang [11] established a computational model including head train, mid-train and tail train, and computed the intensity of noise sources and far-field noises on the surface of the high-speed train. However, the model did not consider bogies and analyze and summarize far-field noises in detail.
Currently, a lot of work has been done for aerodynamic noises of the high-speed train. However, computation for aerodynamic noises of the high-speed train only considers the surface of the train in general, namely only taking the structural surface of the train as aerodynamic noise source and neglecting bogies and connections which are main aerodynamic noise sources [12-14]. This paper took into account the aerodynamics model of structures like bogies and connections when numerical computation was conducted, established a computational model for aerodynamic noises of a high-speed train with 3-train formation including head train, mid-train, tail train, 6 bogies and 2 windshields, analyzed the aerodynamic noise sources of the whole train and the characteristics of far-field aerodynamic noises of the high-speed train, and conducted research on noise reduction. The appendages of the high-speed train in the computational model were rather comprehensive, which was more consistent with the actual situation. In the meanwhile, computational results were also verified by wind tunnel test. Compared with the published papers, studied process and considered factors in the analyzed process were more comprehensive and rigorous.
2. Acoustic analogy method for aerodynamic noises of high-speed trains in the far field
2.1. CFD computation method
Among turbulence models, a sub-grid model with large eddy simulation was more universal than Reynolds average model, while it also required a smaller computation time than direct numerical simulation [15]. Therefore, this paper adopted Large Eddy Simulation to predict relevant sound source information. In Large Eddy Simulation, LES low-pass filtering was used to filter small-scale eddies including pulsation motion in a flow field, and N-S equation was directly used to actually solve the motion of all the large-scale turbulence eddies; motion of the filtered small-scale eddies was computed by a sub-grid model [16].
The LES control equation was still the N-S equation of incompressible viscous fluids. In LES, the large-scale speed was the filtering speed which was defined as follows:
where: ¯ui is a filtering speed component; G(y,y',Δ) is a filtering function which is used to filter the grid size. It is assumed that the filtering process and the derivation process can be exchanged, and then the function can be applied to the N-S equation of incompressible viscous fluid. No matter which form it is, we can always obtain the following formulas:
where: ¯τij=-(¯uiuj-¯ui¯uj) is defined as sub-grid scale Reynolds stress which is a new unknown quantity. In order to close the equation, set and according to the basic SGS model of Smagorinsky, we assume that SGS Reynolds stress has the following form:
where: δij is the unit tensor; μi is the sub-grid turbulence viscosity coefficient; ¯Sij is a component of strain tensor under the solution scale:
2.2. Computational method of aerodynamic noises
In general, the analogy method was used in computational acoustics analysis (CAA). Acoustic analogy theory was firstly proposed by Lighthill. After generalization by Curle, Ffowcs-Williams and Hawkings, the Ffowcs Williams-Hawking equation (called as FW-H equation) [17] was obtained. Its differential form was as follows:
where: p' is gas pressure intensity; ni is the normal direction; a0 is sound speed; vn is normal speed; p is static pressure intensity; Tij=ρuiuj+Pij-a20ρδij is the Lighthill pressure tensor; δ(f) is a δ function; H(f) is a Heaviside function.
The FW-H model expression indicated that sound pressure was caused by particle force and acceleration. Right parts of Eq. (6) represented monopole sound source, dipole sound source and quadripole sound source, respectively. When a high-speed train was running at a certain speed, the train surface was regarded as rigidity, and the volume pulsation was nearly zero, so that the monopole sound source item needed not to be considered [5]. Reference [18] pointed out: intensity ratio of quadripole sound source to dipole sound source in the flow field is in a direct proportion to the square of Mach number; motion of the high-speed train still belongs to low-speed motion; noise intensity of the quadripole sound source is much smaller than that of dipole sound source, so that the quadripole sound source item can be neglected as well. As a result, the paper only considered the aerodynamic noise problem of a high-speed train caused by dipole sound sources in the far field. Therefore, unsteady-state wave of each structure could be simplified into point force [19]. Eq. (6) can be simplified into the following form:
where: Fi is point force with cyclic fluctuations in each structure; r is the distance between a sound source point and an observation point; xi and yi are positions of the observation point and sound source. Mr is a convection Mach number in the observation point r direction.
Eq. (7) indicated that aerodynamic noises caused by point force were the function of first order partial derivative. Eq. (7) was applied to each structure. Sound pressures in a free field can be computed after superposition.
2.3. Computational method for aerodynamic noise sources
Proudman Equation [20] gave a computational formula of aerodynamic noise acoustic power PA (unit of W/m3):
where: u is a turbulence speed; l is a turbulence scale; a0 is a sound speed; a is a model constant. Turbulence kinetic energy k and turbulence dissipation rateεare adopted. Eq. (8) can be expressed as follows:
During numerical computation: αε=0.1. In a specific turbulence area, the Proudman equation can be used to solve noise power at a position of the volume element. Acoustic power level is defined as follows:
where: Pr is a reference acoustic power, Pr=10-12 W/m3.
During numerical computation, the k-ε turbulence model was firstly used to compute steady-state flow field and transient-state flow field of a high-speed train. Turbulence kinetic energy and turbulence dissipation rates at each node of the transient-state flow field are extracted. Then, the Proudman equation is used to compute noise power at one node of the volume element. Therefore, distribution contours of acoustic powers on each surface of the high-speed train can be obtained.
3. Computational models of aerodynamic noises of high-speed trains in the far field
3.1. Geometric model
A complete train is composed of many appendages and its size is very long. During numerical computation, Large Eddy Simulation method and acoustic analogy method are used to conduct dynamic computation of aerodynamic noises in the far field. Due to complexity of numerical methods and limitations by computer hardware, it is impossible to conduct numerical computation of aerodynamic noises of a high-speed train with multi-train formation. Researched results show that a shorter train model (namely 3-train formation) only had small impact on computational results of aerodynamic noises in the far field [6, 13]. Therefore, the paper adopted 3-train formation including head train, mid-train and tail train. Each train had a front bogie and a rear bogie, while windshield structures were used at train connections. Pantographs and small structures of high-speed trains were neglected because researches showed that pantographs had little impact on the far-field radiation noises near the ground of the high-speed train. Considering pantographs and small structures in the model would increase the complexity and computational time, and make trouble to the model machining of the subsequent wind tunnel test. In addition, the model of the high-speed train proposed in this papers which were reported was more simplified compared with that in this paper. For example, Yang [21] established a two-dimensional head train model based on Lighthill acoustic analogy technique, and studied results were not verified by experiments. Li [22] established a high-speed train model including head train, mid-train and tail train. However, he only considered an over-simplified bogie. Luo [23] numerically computed aerodynamic noises of the high-speed train at the running speed of 350 km/h and respectively built a model for pantographs and the wind tunnel of trains. The model proposed by him only contained a mid-train, which was not consistent with the actual situation. Additionally, the model neglected bogies and connection windshields. The studied process completely depended on numerical simulation. The high-speed train in this paper is shown in Fig. 1. Dimension parameters of the train: length is 10 m, width is 0.4 m, and height is 0.4m.
Fig. 1Geometric model of the high-speed train

3.2. Computational domain and boundary conditions
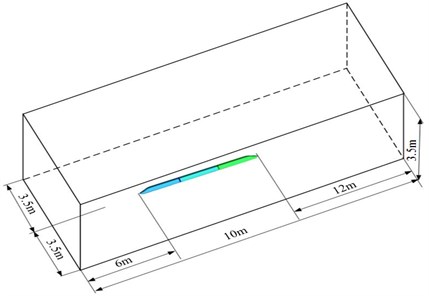
To improve computational efficiency and ensure computational accuracy, many kinds of computational domains were established to make a comparison. Finally, an appropriate computational domain was selected, as shown in Fig. 2. The computational domain of flow field was 28 m long, 7 m wide and 3.5 m high. The train was 0.1 m away from the track ground. The train head was 6 m away from the inlet and the train tail was 12 m away from the outlet. The cross section in front of the high-speed train was an entry boundary and set as the velocity boundary condition, while its corresponding velocity was 250 km/h (69.4444 m/s) during computation; the cross section behind the tail train was an exist boundary and set as the pressure boundary condition, where the pressure was 1 standard atmospheric pressure; cross sections above the high-speed train as well cross sections of left and right sides were set as symmetric boundary conditions; the high-speed train surface was set as the wall boundary, and the train surface was also set as a non-slippage wall face boundary condition; in order to simulate ground effects, a slippage ground was set as the ground, while its slippage speed was equal to the train running speed.
Fig. 2Computation domain of aerodynamic noises of the high-speed train
3.3. Grid division
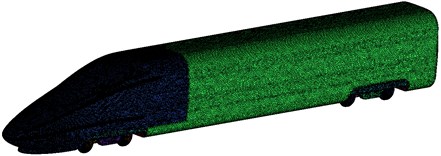
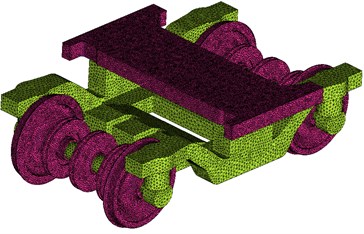
The geometric model included some complicated structures such as bogies, skirt plates and windshields, so that structuralized grids can hardly be drawn. Therefore, the paper adopted non-structuralized tetrahedron grids. Triangular grids were adopted for surfaces of bodies, bogies and windshields. Dimensions of three-dimensional grids were magnified according to a certain scale factor. Hexahedron grids were adopted for parts far away from the train bodies. Pentahedron pyramid grids were adopted for transition parts between the tetrahedron grids and the hexahedron grids. The minimum grid size was 0.5 mm. The maximum grid size was 1500 mm. The model had 48.79 million grids. Grid models of head train, bogies and computational domain were shown in Fig. 3.
Fig. 3Gird models of the high-speed train
a) Head train
b) Bogies

c) Partial grids of the computational domain
3.4. Computational strategy for aerodynamic noises of high-speed trains in the far field
In order to accelerate the convergence, the incompressible steady computation was conducted at first. Then, the result of the steady computation was taken as the initial value of the unsteady computation to conduct the unsteady flow field computation till the physical field became steady. Then, sound source information could be extracted. The extracted sound source information was stored in documents. Finally, sound source information in the documents was read. The FW-H equation was used to solve noises at observation points in the sound field.
The RNG k-ε turbulence model was used in the steady computation. SIMPLE algorithm was used for coupling between pressure and speed. A standard wall function was adopted for near-wall faces. Standard format dispersion was adopted in the continuous equations. A second-order upwind scheme was adopted for momentum equation, turbulence kinetic energy equation and turbulence dissipation rate equation.
The LES turbulence model was adopted in the unsteady computation. In small-scale eddy simulation, the Smagorinsky-Lilly sub-grid model based on mixed length theory was adopted. The second-order implicit expression was adopted as the time difference format. PISO algorithm was used for coupling between pressure and speed. PRESTO format dispersion was adopted for continuous equations. Bounded Central Differencing dispersion was adopted for the momentum equation.
Both the steady computation and the unsteady computation should satisfy stabilization conditions of residual errors and physical fields, namely the residual error should be smaller than 1×10⁻³. Computation at the stage could be ended when pressure monitoring points at the nose tip present periodic changes.
In addition, the computation should also consider the time step ∆, the unsteady computation time and sound field computation time. Selection of the sound field computation time mainly depended on the concerned frequency components as well as convergence. In this paper, the analyzed maximum frequency of aerodynamic noises was set to be 5000 Hz. According to sampling principles, we could obtain the corresponding time step of 1.0×10⁻⁴ s. If the frequency resolution ratio satisfied 2 Hz in the research, the time step should satisfy 5000. At first, sufficient development of the turbulence flow field was ensured through computation of 2500 time steps; then, 5000 time steps were computed; sound source data at each time step was stored and taken as the input of sound field computation, so that aerodynamic loads could be analyzed.
4. Aerodynamic noise sources of the high-speed train
Noise reduction was the final goal of noise tests. A wideband noise source model can be used to obtain useful noise source information, which can help us to determine the main reasons for noise generation, but cannot predict noise radiation. Broadband Noise Source Model in noise module of FLUENT can be used to compute noise source distribution on the surface of the high-speed train. Data obtained in the computation was represented by 2 parameters, so that aerodynamic noises of the high-speed train can be reflected. The two parameters include: (1) acoustic power: it represented the aerodynamic noise power of unit volume in a flow field space; (2) surface acoustic power: it represented the aerodynamic noise power per unit area on the train surface, which was generated from boundary layer turbulence.
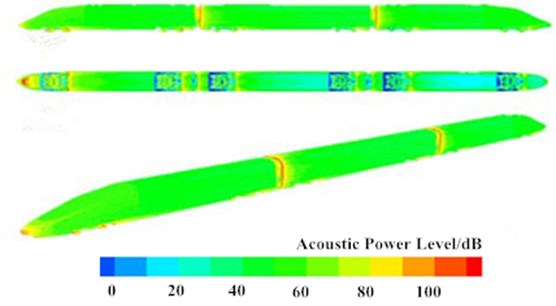
Fig. 4 showed contours of acoustic power distribution at whole train, connections and bogies when the high-speed train was running on a flat ground at the speed of 250 km/h. It was shown in Fig. 4 that peaks at nose tip, pilot, bogies and windshield were over 90 dB, while acoustic power levels were low at non-streamline parts of head train, mid train and tail train. On the train surface with large acoustic power, the pressure was high and obvious aerodynamic noises were generated. The maximum surface sound power was in the wheel and brake disc of the first bogie. From the first bogie to the fifth bogie, surface acoustic powers gradually deceased, but the surface acoustic power level of the final bogie suddenly increased. As shown in Fig. 4(c), the distributions of aerodynamic noises in front and rear windshields were basically symmetrical and completely consistent. Aerodynamic noises presented an attenuation trend from the top to the bottom of windshields because the bottom of the high-speed train was disturbed by bogies and the flow velocity of airflow was slow. The top of the high-speed train was gentle and the flow velocity of airflow was fast. Airflow on the top would firstly act on the top of windshields and flow to the bottom of windshields along both sides. Due to the viscosity resistance of surface of the high-speed train, the flow velocity of airflow decreased, which thus reduced surface noises.
5. Aerodynamic noise characteristics of the high-speed train in the far field
5.1. Analysis and experimental verification of pressures of the high-speed train
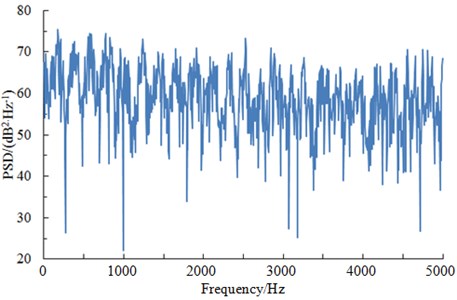
Studied results show that aerodynamic noises of a high-speed train mainly depended on pressures of the surface [13]. Therefore, it was necessary to analyze change rule of pressures of the train surface. When a train was running at a certain speed, pressures at different observation points were compared and analyzed. Results showed that pressures changed obviously at the streamline position of the head train [13]. The maximum pressure was at the nose tip because airflow was separated while flowing through the nose tip, where one part of airflow flowed upwards along the train surface, and the other part of airflow flowed downwards along the train bottom, so that airflow disturbance and separation at the nose tip were most violent. Therefore, the paper took the observation point at the nose tip as the case to analyze characteristics of pressures in time-domain and frequency-domain. Fig. 5 showed pressure curve of the observation point at the nose tip in the time-domain when the train was running at speed of 250 km/h. Fig. 6 showed corresponding power spectral density.
Fig. 4Contours of acoustic power distributions of the high-speed train
a) High-speed train
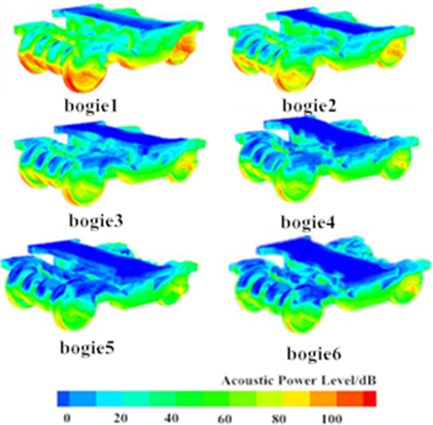
b) Bogies
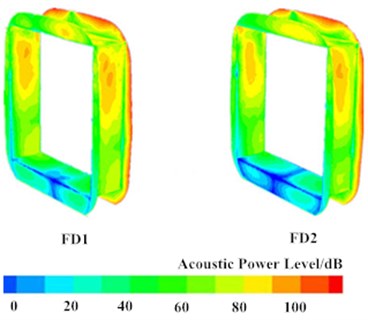
c) Train joints
It was shown in Fig. 5 and Fig. 6 that the pressure of the high-speed train presented random fluctuations in the time domain; pressures on the train surface were wideband signals in the frequency domain. Main energy was concentrated at low frequencies within the scope of 600 Hz. Power spectral density decreased rapidly with the analyzed frequency. When the analyzed frequency was more than 600 Hz, the power spectral density tended to be steady and did not change obviously.
The numerical computation model of the high-speed train has a large size and many appendages. Therefore, its correctness must be verified by experiments. This experiment was conducted in a wind tunnel. The experimental section is 18 m. The nozzle area is 27 m2. The maximum wind speed is 300 km/h. The experimental section is a semi-anechoic room. Through the strong sound absorption treatment in flow channel and experimental section, background noises are only 65 dB when wind speed is 250 km/h. The background noise is relatively low. It is reliable to conduct an experiment under such a low background noise and semi-anechoic chamber. The experimental section of wind tunnel and high-speed train model are installed, as shown in Fig. 7(a). The experiment selects a CRH3 high-speed train model with 3-train formation. With an overall length of 9.5 m, the model is made of timber. Each train model has 2 bogies and train connections adopt the inner windshield. There are no other appendages like pantographs and air deflector. Head train and tail train have the same shape, structure and size. The model is connected by supporting bar through bolts and fixed at baseplate. Bolt holes connecting the model are sealed by rubberized fabric to try to eliminate the impact of model machining on experimental results. An air pressure sensor shown in Fig. 7(b) is installed at the nose tip of head train. The sensor has a wide range of working temperature and high test precision. The sensor is connected to B&K data acquisition equipment shown in Fig. 7(c). Each experiment was conducted three times. The average value of three experiments was taken as the final result to eliminate accidental error.
Fig. 5Pressure curve of the nose tip in time-domain
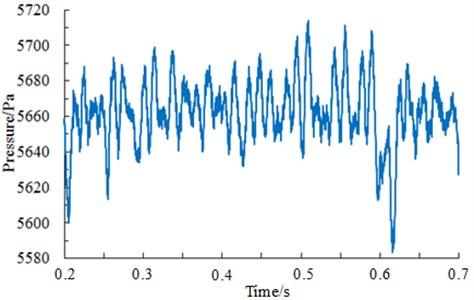
Fig. 6Power spectral density of the nose tip in frequency-domain
The experimental result was compared with the computational, as shown in Fig. 8. It is shown in Fig. 8 that experimental and computational results were kept basically consistent in values and trends. In the whole analyzed frequency band, the experimental values were slightly higher than computational results. The installing support and machining process of experimental model could not keep consistent with numerical simulation model, which would change the flow process of air and inevitably have a certain impact on experimental results. However, experiment and numerical simulation were kept consistent in change trends which could be used to observe the change rule of far-field radiation noises of the high-speed train. Through comprehensive analysis, we can find that it is feasible to use the computational model in this paper when aerodynamic noises of the high-speed train were predicted.
Fig. 7Experiment on the power spectral density of the high-speed train

a) Model and installation of wind tunnel test
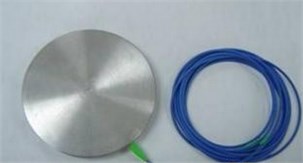
b) Air pressure sensor
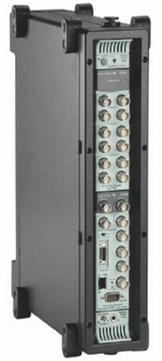
c) Data acquisition equipment
Fig. 8Comparisons of pressures between experiments and simulation
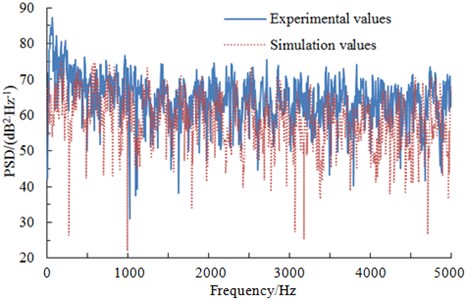
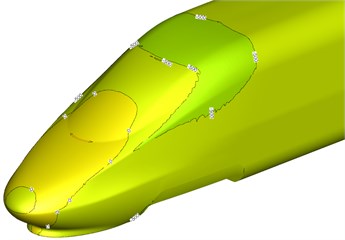
Fig. 9Surface pressure distribution on head train and trail train
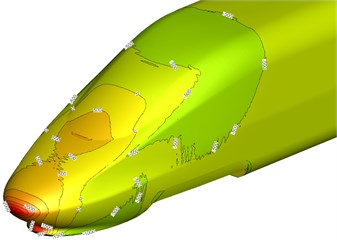
a) Head train
b) Tail train
Fig. 9 showed a pressure distribution contour when the high-speed train was running on the flat ground at the speed of 250 km/h. It was shown in Fig. 9 that pressure distribution was uniform at the head train and tail train. The maximum positive pressure of head train was located at the nose tip; the maximum negative pressure was located at bottom of windward side of the head train pilot; only a few of areas at the head train streamline part had negative pressures, so that the head train born large aerodynamic resistance forces. According to tail train pressure distribution shown in Fig. 9(b), we can find that the aerodynamic resistance force borne by the tail train was smaller than that borne by head train (head train aerodynamic resistance force was mainly caused by pressure drag).
5.2. Analysis of aerodynamic noises of the high-speed train in the far field
5.2.1. Arrangement of noise observation points
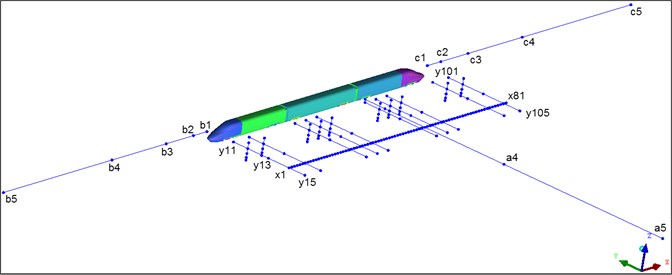
Noises of high-speed trains were one of emphases concerned by people. Lateral side noises in the far field will cause serious noise pollution. In order to research aerodynamic noise characteristics of the high-speed train and according to requirements of standards for testing aerodynamic noises of the high-speed train [24], 81 noise observation points were arranged uniformly along the train longitudinal direction ( direction) at the position 3.5 m higher than the track face and 25 m away from the track center line, where the distance between adjacent longitudinal observation points was 1m; at the positions 3.5 m higher than the track and 7.5 m, 12 m, 18.5 m and 30 m away from the track center line, 50 noise observation points were arranged along the train horizontal direction ( direction), where 5 observation points were arranged respectively at the nose tip of head train, the first bogie of head train, the second bogie of head train, first windshield, the first bogie of mid train, the second bogie of mid train, second windshield, the first bogie of tail train, the second bogie of tail train and nose tip of tail train; 40 observation points were arranged at positions which were 0.5 m, 1.2 m, 2.2 m and 5.0 m higher than the track face and 12 m away from the track center line along the train vertical direction ( direction). 10 observation points were arranged respectively along the train longitudinal direction ( axis) at positions which were 3.5 m higher than the track and 1 m, 6 m, 16 m, 36 m and 76 m away from the head train and the nose tip (distance between two adjacent observation points satisfied the 2-multiple relation). Therein, 5 observation points (observation point No. of b1, b2, b3, b4 and b5) were arranged in front of the nose tip of the head train; 5 observation points (observation point No. of c1, c2, c3, c4 and c5) were arranged right behind the nose tip of the tail nose. Arrangement and No. of observation points used in the aerodynamic noise computation of the high-speed train are shown in Fig. 10.
Fig. 10Distribution diagram of observation points of aerodynamic noises
5.2.2. Distribution characteristics of longitudinal aerodynamic noises
Fig. 11 showed an equivalent A-weighting sound pressure level curve of the longitudinal observation point when the high-speed train was running at speed of 250 km/h, where the observation point was 25 m away from the track center line and 3.5 m higher than the track face. Fig. 12 showed a comparison of sound pressure levels of longitudinal observation points under different speeds.
It was shown in Fig. 11 that the sound pressure level distribution of longitudinal aerodynamic noises of the high-speed train tended to decrease. The maximum sound pressure levels were at observation points of six bogies. The sound pressure levels of observation points were the maximum around the second bogie of head train and the first bogie of mid-train. When transition of the nose tip of the head train reached 6 m, the sound pressure level in the far field increased rapidly, and the maximum increase range reached 9.4 dBA. In the case of the transition of airflow from nose tip to this position, curvature on the surface of high-speed train changed. The flow of attached airflow was disordered, producing large pressure difference. When the transition of the nose tip of head train reached 25 m, the noise sound pressure level reached the maximum value of 89.7 dBA. It was because the transition of high-speed train top was placid and curvature did not see any changes. When the transition of the nose tip of head train reached 25 m, the noise sound pressure level reached the maximum value of 89.7 dBA. Large radiation noise was produced due to the existence of bogies at the bottom of high-speed train, airflow disorder, fast flow velocity of top airflow and large air difference. When 25 m-29 m, the radiation noise of high-speed train presented an obvious valley value because this position was the connection windshield of high-speed train and had obvious square cavity vortexes. When 29 m, the sound pressure level reached 89.4 dBA among whole-train noise measurement points; at the streamline part of tail train, the noise sound pressure level attenuated rapidly, with the maximum attenuation value of 10.1 dBA; meanwhile, the total noise sound pressure level reached local large values near the first bogie of the head train, the second bogie of the mid train, the second bogie of the tail train and the first bogie of the tail train.
Fig. 11Sound pressure levels of longitudinal observation points
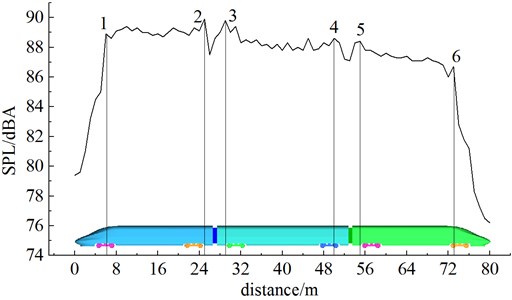
Fig. 12Sound pressure levels of longitudinal observation points under different running speeds
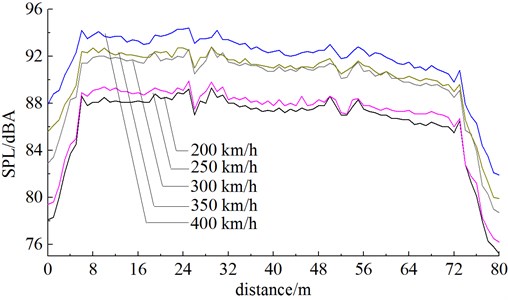
It was shown in Fig. 12 that sound pressure levels of longitudinal observation points increased obviously with the increased running speed. When running speeds were 200 km/h, 250 km/h, 300 km/h, 350 km/h and 400 km/h, the maximum sound pressure levels of the longitudinal observation points were 89.1, 89.7, 92.6, 92.8 and 94.4 dBA respectively with the increase range of 0.6 dBA→2.9 dBA→0.4 dBA→1.6 dBA. This result indicated: with the increased speed, the increase range of aerodynamic noises at the same observation point was smaller. At a low speed, the mechanical noise of the high-speed train occupied a dominant position. With the increase of speed, aerodynamic noise became the main noise source. Therefore, the further increase of running speed would not greatly change aerodynamic radiation noises. When the running speed of the high-speed train increased from 200 km/h to 400 km/h, the maximum sound pressure level increased by 5.3 dBA.
5.2.3. Distribution characteristics of horizontal aerodynamic noises
Table 1 is a comparison of A-weighting sound pressure level of horizontal observation points which had different distances from the head train at the speed of 250 km/h.
Table 1Comparison of sound pressure levels of horizontal observation points (Unit: dBA)
Distance from the nose tip of the head train | 7.5 m | 12 m | 18.5 m | 25 m | 30 m | Horizontal maximum attenuation value |
Nose tip of head train | 84.2 | 82.1 | 79.9 | 79.4 | 78.3 | 5.9 |
First bogie of head train | 90.8 | 90.4 | 90.7 | 88.5 | 86.6 | 4.2 |
Second bogie of head train | 91.4 | 91.1 | 90.2 | 89.4 | 89.8 | 2.0 |
First windshield | 94.3 | 90.3 | 90.3 | 88.7 | 88.9 | 5.6 |
First bogie of mid train | 91.3 | 90.9 | 89.9 | 89.5 | 89.3 | 2.0 |
Second bogie of mid train | 90.2 | 89.7 | 89.0 | 88.6 | 88.7 | 1.6 |
Second windshield | 92.8 | 88.9 | 88.9 | 87.7 | 87.8 | 5.1 |
Second bogie of tail train | 89.9 | 89.7 | 88.9 | 88.3 | 88.6 | 1.6 |
First bogie of tail train | 88.0 | 87.7 | 87.9 | 85.8 | 84.0 | 4.0 |
Nose tip of tail train | 80.9 | 78.5 | 77.0 | 76.4 | 75.4 | 5.5 |
Longitudinal maximum attenuation value | 13.4 | 12.6 | 13.7 | 13.1 | 14.4 |
(1) Sound pressure levels at all observation points decreased with the increased distance between them and the track center line. The maximum attenuation range of aerodynamic noises in the horizontal direction was 1.6 dBA-5.9 dBA. The sound pressure level amplitude attenuated most obviously at the nose tip of the head train, first windshield, nose tip of the tail train and second windshield. In order to reduce noise radiation of these parts, we must improve and optimize noise sources of these parts and successively reduce sound pressure levels on the train surface in order to reduce aerodynamic noises in the far field. The attenuation amplitudes of sound pressure levels were the minimum at the second bogie of mid-train and the second bogie of the tail train, while the values at the second bogie of the head train and the first bogie of mid-train ranked the second place. Therefore, we had better reduce noise radiation at these parts with small attenuation amplitudes in order to reduce noise radiation. It was feasible to reduce aerodynamic noises through sound absorption and noise reduction.
(2) Horizontal attenuation values were large at observation points of first windshield and second windshield, where the longitudinal maximum value was at the position 7.5 m away from the track center line. It was thus clear that, in order to improve noise radiation at windshields, these observation points should be arranged within the scope of 7.5 m away from the track center line.
5.2.4. Distribution characteristics of vertical aerodynamic noises
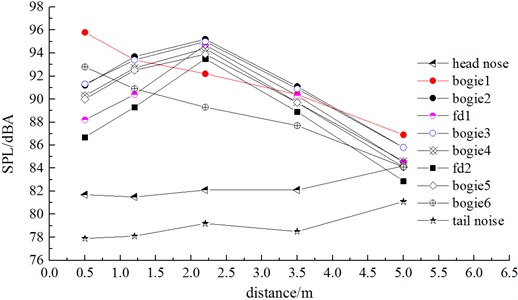
Fig. 13 showed the A-weighting sound pressure level curve of vertical observation points when the high-speed train was running at speed of 250 km/h.
(1) Computational results of sound pressure levels at longitudinal observation points of the first bogie of the head train and first bogie of the tail train showed: sound pressure levels were larger when the observation point was nearer to the ground. At the observation point which was 0.5 m higher than the ground, the sound pressure level reached the maximum value. The sound pressure level reached the maximum value of 95.8 dBA at the noise observation point of the first bogie of the head train.
(2) Computational results of sound pressure levels at vertical observation points of nose tip of the head train and nose tip of the tail train showed: with the increase of above-ground height, the sound pressure level increased gradually and reached the maximum value when the above-ground height reached 5m. Sound pressure levels at nose tip of the head train exceeded those at nose tip of the tail train.
(3) Computational results of sound pressure levels at the second bogie of the head train, first windshield, first bogie of the mid train, second bogie of the mid train, second windshield, and second bogie of the tail train showed: sound pressure levels increased at first and reached the maximum value when the above-ground height reached 2.2 m, while the sound pressure levels decreased gradually after that. When the above-ground height was 2.2 m, the sound pressure level at the second bogie of the head train reached the maximum value of 95.2 dBA.
Fig. 13Sound pressure level comparison of vertical observation points
5.2.5. Distribution characteristics of aerodynamic noises on symmetric faces
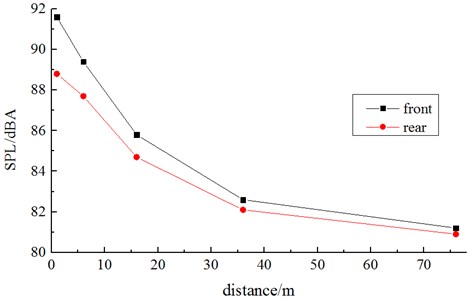
At the positions which were 3.5 m higher than the track face and 1 m, 6 m, 16 m, 36 m and 76 m away from the nose tip of the head train and nose tip of the tail train (distance between two adjacent observation points satisfied the 2-multiple relation), 10 noise observation points were arranged respectively along the train longitudinal direction axis). Fig. 13 displays the A-weighting sound pressure level of high-speed train noise observation points at the longitudinal symmetric line. As shown in Fig. 14, according to sound pressure levels at the longitudinal symmetric line observation points which had different distances from the nose tip, we can find:
(1) Incoming flows had larger effects on aerodynamic noise around the train body than the tail flow aerodynamic noise.
(2) In the incoming flow direction, sound pressure levels at the noise observation points which had different distances from the train nose tip showed attenuation property. At the longitudinal measurement points of the longitudinal symmetric line, which were 1 m, 6 m, 16 m, 36 m and 76 m away from the head train nose tip, the sound pressure level reduction amplitudes of high-speed train were 2.2 dBA→3.6 dBA→3.2 dBA→1.4 dBA. In the tail flow direction, the sound pressure level reduction amplitudes were 1.1 dBA→3.0 dBA→2.6 dBA→0.7 dBA.
Fig. 14Comparison of SPL at observation points of the longitudinal symmetric line
5.3. Spectral characteristics of aerodynamic noises in the far field
Fig. 15 showed sound pressure levels of the observation points x7 and x26 in the 1/3 octave band when the high-speed train was running at speed of 250 km/h. x7 represented the far-field radiation noises of nose tip of head train, while x26 represented the far-field radiation noises of the first bogie of head train. According to Fig. 15, the change trend and value of radiation noises are not very different at different positions in the far field, which indicated that the energy distribution of far-field radiation noises of the high-speed train was not greatly affected by appendages. In 25 Hz-160 Hz, aerodynamic noises quickly increased with the analyzed frequency. In 160 Hz-1250 Hz, aerodynamic noises presented linear changes with the analyzed frequency. The far-field aerodynamic noise of the high-speed train was a broadband noise, whose main energy was in 1250 Hz-3150 Hz. In 3150 Hz-5000 Hz, aerodynamic noises gradually decreased with the analyzed frequency.
Fig. 15Aerodynamic noise in the 1/3 octave band
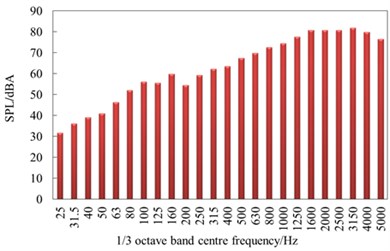
a) Observation x7
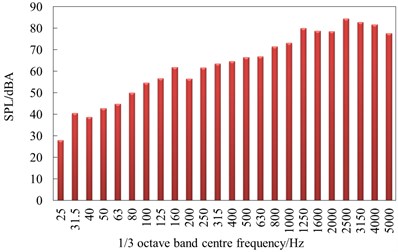
b) Observation point x26
6. Conclusions
This paper established a model of 3-train formation including head train, mid-train and tail train, considered bogies and connection windshields, studied far-field radiation noises, verified the correctness of computational model through wind tunnel test and obtained the following conclusions:
1) Nose tip of head train, pilot, bogies and windshields were main noise sources of the high-speed train. In addition, sound sources of the high-speed train are where airflow was easily separable and turbulent motion was very serious. The maximum surface sound power is in the wheel and brake disc of the first bogie. From the first bogie to the fifth bogie, surface sound powers gradually deceased, but the surface sound power level of the final bogie suddenly increased. The distributions of aerodynamic noises in front and rear windshields were basically symmetrical and completely consistent. Aerodynamic noises presented an attenuation trend from the top to the bottom of windshields.
2) Through comparative analysis for total sound pressure levels at observation points of the high-speed train (25 m away from the track center line, 3.5 m higher than the track face), we can find: the total noise sound pressure level reached the maximum value of 89.7 dBA at the noise observation point which was 25 m away from the nose tip of the head train (observation point x26). Therefore, in subsequent experiments and researches, noise observation points shall be arranged at this position. When 25 m-29 m, the radiation noises of the high-speed train presented an obvious valley value because this position was the connection windshield of the high-speed train and had obvious square cavity vortexes.
3) Under different running speeds, the longitudinal aerodynamic noise of the high-speed train was featured with that: when transition of the nose tip of the head train reached 25 m, the sound pressure level reached the maximum value of 89.7 dBA among whole-train noise observation points; the total noise sound pressure levels reached local large values around the first bogie of the head train, second bogie of head train, first bogie of mid train, second bogie of mid train, second bogie of tail train and first bogie of tail train. Aerodynamic noises at horizontal observation points were featured with that: sound pressure levels at observation points decreased with the increase of distance between them and the track center line; horizontal maximum attenuation amplitudes of sound pressure levels were 1.6 dBA-5.9 dBA; sound pressure level amplitudes attenuated most obviously at the nose tip of the head train, first windshield, nose tip of the tail train and second windshield. Aerodynamic noises at vertical observation points were featured with that: sound pressure levels were larger when vertical observation points at first bogie of the head train and first bogie of the tail train were nearer to the ground; sound pressure level reached the maximum value when the above-ground height reached 0.5 m; sound pressure level of the noise observation point at first bogie of the head train reached the maximum value of 95.8 dBA. Aerodynamic noises at the longitudinal symmetric line were featured with that: incoming flows had larger effects on aerodynamic noises around the train body than the tail flow aerodynamic noises.
4) The change trend and value of radiation noises are not very different at different positions in the far field, which indicated that the energy distribution of far-field radiation noises of the high-speed train was not greatly affected by appendages. In 25 Hz-160 Hz, aerodynamic noises quickly increased with the analyzed frequency. In 160 Hz-1250 Hz, aerodynamic noises presented linear changes with the analyzed frequency. The far-field aerodynamic noise of the high-speed train was a broadband noise, whose main energy was in 1250 Hz-3150 Hz. In 3150 Hz-5000 Hz, aerodynamic noises gradually decreased with the analyzed frequency.
References
-
Mellet C., Létourneaux F., Poisson F., et al. High speed train noise emission: latest investigation of the aerodynamic/rolling noise contribution. Journal of Sound and Vibration, Vol. 293, Issue 3, 2006, p. 535-546.
-
Zhang W. H. Study on top-level design specifications of high-speed train. Journal of the China Railway Society, Vol. 34, Issue 9, 2012, p. 15-19.
-
Nagakura K. Localization of aerodynamic noise sources of Shinkansen train. Journal of Sound and Vibration, Vol. 293, Issue 3, 2006, p. 547-556.
-
Kitagawa T., Nagakura K. Aerodynamic noise generated by shinkansen cars. Journal of Sound and Vibration, Vol. 231, Issue 5, 2000, p. 913-924.
-
Zheng Z. Y., Li R. X. Numerical analysis of aerodynamic dipole source on high-speed train surface. Journal of Southwest Jiaotong University, Vol. 46, Issue 6, 2011, p. 996-1002.
-
Gao Y., Wang Y. G., Wang J. T., et al. Testing study of aerodynamic noise for high-speed train model in aero-acoustic wind tunnel. Technical Acoustic, Vol. 32, Issue 6, 2013, p. 506-510.
-
Sun Z. X., Song J. J., An Y. R. Numerical simulation of aerodynamic noise generated by CRH3 high speed trains. Acta Scientiarum Naturalium Universitatis Pekinensis, Vol. 48, Issue 5, 2012, p. 701-710.
-
Zhu J. Y., Hu Z. W., Thompson D. J. Analysis of aerodynamic and aeroacoustic behaviour of a simplified high-speed train bogie. Noise and Vibration Mitigation for Rail Transportation Systems. Springer Berlin Heidelberg, 2015, p. 489-496.
-
Thompson D. J., Smith M. G., Coudret F. Application of a component-based approach to modelling the aerodynamic noise from high-speed trains. Noise and Vibration Mitigation for Rail Transportation Systems. Springer Japan, 2012, p. 427-435.
-
Yuan L., Li R. X. Aerodynamic noise of high-speed train and its impact. Mechanical Engineering and Automation, Vol. 180, Issue 5, 2013, p. 31-35.
-
Yang Y., Yang G. W. A numerical study on aerodynamic noise sources of high-speed train. Proceedings of the 1st IWHIR, Vol. 2, 2012, p. 107-116.
-
Sun Y. J., Mei Y. G. Introduction of aerodynamic noise generated by foreign EMUs pantograph. Railway Locomotive and Car, Vol. 28, Issue 5, 2008, p. 32-35.
-
Ikeda M., Mitsumoji T., Sueki T., et al. Aerodynamic noise reduction of a pantograph by shape-smoothing of panhead and its support and by the surface covering with porous material. Noise and Vibration Mitigation for Rail Transportation Systems. Springer Japan, 2012, p. 419-426.
-
Zhu J. Y., Jing J. H. Research and control of aerodynamic noise in high speed trains. Foreign Rolling Stock, Vol. 48, Issue 5, 2011, p. 1-8.
-
Cui Gui-xiang, Xu Chun-xiao, Zhang Zhao-shun The progress of turbulent eddy simulation. Aerodynamics Journal, Vol. 22, Issue 2, 2004, p. 121-129.
-
Garnier E., Sagaut P., Adams N. Large Eddy Simulation for Compressible Flows. Springer, 2009.
-
Ffowcs-Williams J. E., Hawkings D. L. Sound generation by turbulence and surfaces in arbitrary motion. Philosophical Transactions for the Royal Society of London, Series A, Mathematical and Physical Sciences, Vol. 264, Issue 1151, 1969, p. 321-342.
-
Lighthill M. J. On sound generated aerodynamically. Part 1: General theory. Proceedings of the Royal Society of London, Series A, Mathematical and Physical Sciences, Vol. 211, Issue 1107, 1952, p. 564-587.
-
Lowson M. V. The sound field for singularities in motion. Proceedings of the Royal Society of London. Series A. Mathematical and Physical Sciences, Vol. 286, Issue 1407, 1965, p. 559-572.
-
Proudman I. The generation of noise by isotropic turbulence. Proceedings of the Royal Society of London. Series A. Mathematical and Physical Sciences, Vol. 214, Issue 1116, 1952, p. 119-132.
-
Yang X. Y., Gao Y., Cheng Y. J., Liu F. H. Finite elements analysis of high-speed train wind noise in lighthill’s acoustic analogy. Noise and Vibration Control, Vol. 8, Issue 4, 2011, p. 80-84.
-
Li H., Xiao X. B., Jin X. S. Investigation into aerodynamic noise characteristics of train head car bogie based on simplified models. Journal of Mechanical Engineering, Vol. 52, Issue 8, 2016, p. 152-161.
-
Luo L., Zheng X., Lv Y., Hao Z. Y. Aerodynamic noise analysis of high-speed train with pantograph system. Journal of Zhejiang University (Engineering Science), Vol. 49, Issue 11, 2015, p. 2179-2185.
-
Railway Application-Acoustics Measurement of Noise Emitted by Railbound Vehicle. EN ISO 3095, 2005.

