Abstract
Cable towers are an important aerodynamic noise source of long-span bridges. The flow effect of various parts of the cable tower on airflow will cause large aerodynamic noises and thus influence environments. This paper conducted on research on the cross-sectional structure of the cable tower of long-span bridges, built a computational model of aerodynamic noises for cable towers of long-span bridges with original rectangular cross section and improved cross section. The computational fluid dynamics was adopted to analyze the non-steady flow of cable towers, and the numerical value of aerodynamic noises was predicted based on Lighthill’s acoustic analogy. Then, acoustic BEM was also adopted to study radiation noises of cable towers in the far-field. Results showed that improved cable tower could reduce the dispersion degree of airflow and weaken Karman Vortex Street. Aerodynamic noises induced by cable towers with improved cross section mainly radiated in a direction perpendicular to airflow, and the directivity of noises was obvious. Sound pressure level (SPL) of aerodynamic noises of cable towers with improved cross section was 4.2 dBA less than that of initial rectangular cross section in the far-field, which showed obvious effect on noise reduction. In the meanwhile, this paper studied the mechanism of main frequency at various parts of cable towers with improved cross section and discussed the reason of noise reduction, whose research achievements could provide design basis for generation mechanism and reduction of aerodynamic noises of cable towers of long-span bridges.
1. Introduction
As a main component of highways and a key hub in traffic engineering, bridges play a very important role in traffic development. Bridges are also important equipment of national economy and social development, and represent the comprehensive national strength including economic strength, science and technology, production force development and so on. Long-span bridges occupy a very important position in sea-crossing engineering construction. Due to the wind-induced vibration of slender slings, long-span bridges face a lot of tests in the aspect of service life and traffic safety. A large number of scholars have conducted a lot of studies on the wind-induced vibration, static modal analysis, anti-seismic research and seismic isolation technology, dynamic analysis of bridge pile foundations, service bridge reliability assessment, development of new bridge materials and other aspects [1-5]. References [6] adopted the method of experimental research to study different cross section (round, square, rectangle, elliptic and so on) and distribution angles, whose research achievements could provide experimental basis for the numerical verification and prediction method of aerodynamic noises. References [7, 8] did experimental research on the fluctuating lift and Strouhal number (St) of cross section of cylindrical bar. References [9] adopted the experimental method to study the correlation between the wind angle and surface fluctuating pressure of cross section of cylindrical bar. Similarly, references [10-14] adopted the experimental method to conduct a detailed study on the relationship between the surface fluctuating pressure, life and wind angle of cylindrical bar, rectangular bar and elliptical bars. However, there are few studies on wind-induced aerodynamic noises of long-span bridges and few studies are conducted on the impact of wind-induced radiation noises on pedestrians and vehicles on the bridge. Therefore, this paper studied the aerodynamic noise characteristics of cross-sectional structure of main tower of long-span bridges based on the computational fluid dynamics (CFD) and computational acoustics (CAA), studied the flow behavior of airflow around the main tower and the generation mechanism of aerodynamic noises through comparing the aerodynamic noise of main tower with improved cross section and initial rectangular cross section and provided references for the optimization design of aerodynamic noises of cable towers of long-span bridges.
2. Computational model for the aerodynamic noise of cable towers
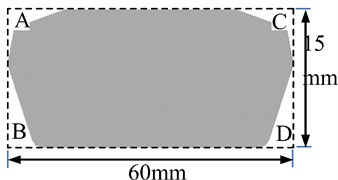
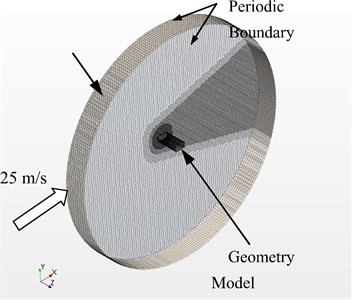
A cable tower of long-span bridges adopted by the construction section of a highway was shown in Fig. 1. Fig. 2 was the cross section of cable towers. The rectangular cross section was taken as the initial model, and it was represented by dotted lines in the figure. Improved cross-sectional structure improved four positions including A, B, C and D based on the rectangular cross section shown in Fig. 2, and it was represented by solid lines in the figure. This paper established the cable tower structure and the corresponding computational domain of fluids, as shown in Fig. 3. Cable towers with initial rectangular cross section and improved cross section were simulated to study whether the improve cable tower played a role in reducing aerodynamic noises.
Fig. 1Geometry model for the cable tower of long-span bridges
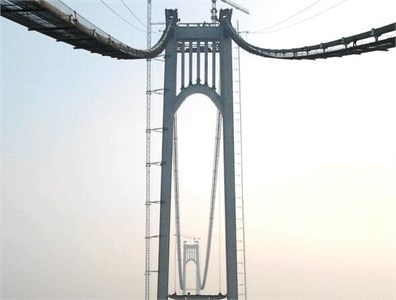
Fig. 2Schematic diagram for the cross section of the cable tower
Both sides of the computational domain were set as periodic boundary conditions. The airflow velocity of the computational domain was given in the positive direction of X-axle. Inflow velocity was 25 m/s. The cable tower was set as non-slip wall boundary condition. Hexahedral elements were divided in the whole computational domain. Meshes were fine in the region of the cable tower and wake flow. Element size was 0.5 mm around the cable tower and 1 mm around the wake flow. The maximum element size in the whole computational domain was 6 mm. To more accurately consider the impact of cable tower surface on fluid flow, boundary layer meshes were divided on its surface. The growth rate of the boundary layer was 1.1. 12-layer tri-prism elements with the thickness of 10 mm ensured that the maximum value of y+ was less than 1. The total number of corresponding elements was about 6,350,000.
Fig. 3Computational domain of cable towers
3. Analytical method of aerodynamic noises of cable towers
In 1952, Lighthill [15] started from fluid N-S equation and derived the famous Lighthill equation, as shown in Eq. (1) and (2). The left end of the equation had the same form with the classic acoustic wave equation. The right end of the equation was fluctuation item, namely sound source item, caused by fluid dynamics. Lighthill equation showed that the quadrupole sound source item of fluid dynamics sound source was stress in fluid turbulent:
where in, Tijrepresented Lighthill tensor. as shown in Eq. (2), ρ0 and p0 stood for density and pressure of undisturbed fluid; ρ and p referred to density and pressure of disturbed fluid; ui was the component of fluid velocity in the direction of xi; ∇ meant Hamiltonian operator; c0 was the propaganda velocity of sound in homogeneous medium.
Lighthill equation was from research on jet noises and neglected the impact of movement boundary on noises. Ffowcs-Williams and Hawkings expanded Lighthill equation to the boundary of moving objects according to Lighthill acoustic analogy and obtained FW-H equation [16, 17], as shown in Eq. (3):
+∂∂t{[p0un+ρ(un-vn)]δ(f)},
wherein, p' was sound pressure in sound field, p'=p-p0. un referred to the velocity component of fluid in the normal direction; vn represented the normal velocity component of the moving object perpendicular to the surface; f=0 stood for control equation described by implicit function. When the control surface selected solid surface, un=vn. f>0 represented the exterior region of the control surface while f<0 stood for the interior region of the control surface. The first item at the right end of the equation was the right-end item of Lighthill equation, represented space quadrupole sound source and existed in space region outside the solid surface. H(f) was Heaviside generalized function, whose function lied in restricting the noise caused by Lighthill stress tensor in the region outside the control plane. The second item at the right end of the equation was dipole sound source item; the third item at the right end of the equation was monopole sound source item. Dipole sound source and monopole sound source had the object surface. δ(f)=dH(f)/df was adopted to constrain its dipole and monopole sound source to solid surface. If quadrupole sound source and monopole sound source were ignored [18-20], and Green function was used to solve Eq. (3), the solution to the integral form of sound density of aerodynamic nose on the external surface of cable towers could be obtained, as shown in Eq. (4):
where in, y was the source point vector of sound source; x represented the vector of point receiving sound; Marreferred to Mach number of gas; S(y) meant the infinitesimal of surface area of sound source.
Based on small disturbance assumptions and gas adiabatic assumptions [21, 22], gas satisfied the equation of physical status Eq. (5). Then, Eq. (4) could be changed into Eq. (6):
where in, p(y,t) was fluctuating pressure on the surface of sound source, which indicated that fluctuating pressure on the solid surface was an important factor inducing aerodynamic noises. If fluctuating pressure on the surface of cable bent tower was got, the aerodynamic noise of cable towers could be obtained.
4. Flow characteristics of aerodynamic noises of cable towers
Fig. 4 presented the flow status of initial cable tower cross section in the region of wake flow after steady computation. Fig. 5 showed the flow status of improved cable tower cross section in the region of wake flow after steady computation. The flow status was concerned, and the flow of initial cable tower cross section and improved cable tower cross section was highly unstable in the region of wake flow, and flow velocity fluctuated in a regular way. Similar to cylindrical turbulent flow, initial and improved cable tower cross sections formed the phenomenon of Karman Vortex Street behind wake flow. Improved cable tower cross section could weaken the effect of Karman Vortex Street of its airflow in the region of wake flow.
Fig. 4Results for the velocity of steady computation of initial cable towers
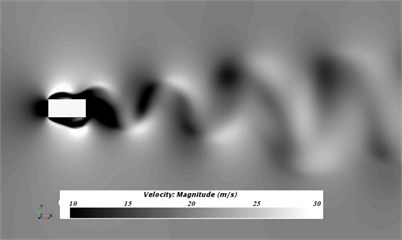
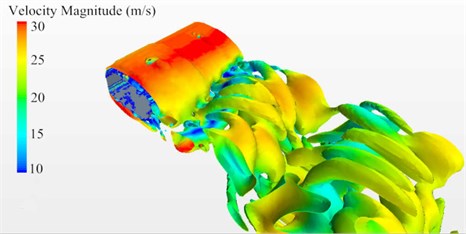
Fig. 6 and Fig. 7 showed the contour surface of velocity gradient of cable towers based on Q-criterion (Dimension was 0.00242) before and after improvement and colored it with velocity amplitude. In a transient status, vortex was generated at the edge of the windward side for initial cable tower cross section. Both sides of the cable tower were a large number of adherent vortexes. Numerous vortexes gathered at the edge and back of the leeside. Vortex motion was periodic at a distance from the leeside. For improved cable towers of long-span bridges, airflow separated after meeting the windward side, whose dispersion degree was smaller than that of initial cable towers. There was not an obvious phenomenon of vortex generation at the edge of the windward side. A number of vortexes shed and showed obvious periodicity in the region of wake flow behind the leeside.
Fig. 5Results for the velocity of steady computation of improved cable towers
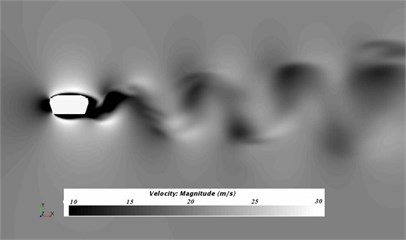
Fig. 6Contour surface of velocity gradient of initial cable towers
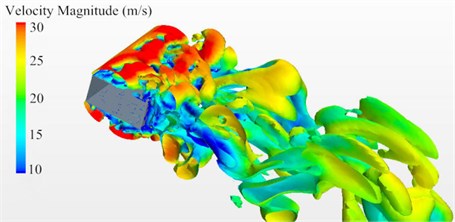
Fig. 7Contour surface of velocity gradient of improved cable towers
5. Aerodynamic noises of the cross section of cable towers
5.1. Computation and experimental verification of aerodynamic noises in the far-field
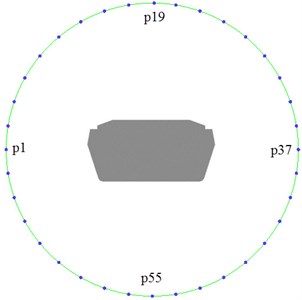
The sound source item of FW-H equation contained three different types of sound sources of aerodynamic noises. Flow field data obtained by CFD simulation could compute monopole aerodynamic noises, dipole aerodynamic noises and quandrupole aerodynamic noises [7]. In the simulation process of fluids, 72 observation points were distributed with an interval of 5° in an anti-clockwise direction, and a radius was 0.3 m from the center of cable towers in the flow field. Noise observation point 1 was located in the horizontal symmetric plane of upstream cable tower. Noise observation point 37 was located in the horizontal symmetric plane of downstream cable tower and had an interval of 180° with noise observation point 1. Noise observation point 19 was right above the center of cable towers; noise observation point 55 was right below the center of cable towers. The two observation points had an interview of 90° with noise observation point 1 and 37. The specific distribution of noise observation points was shown in Fig. 8.
Fig. 8Distribution of noise observation points
The surface of cable towers was selected as the sound source of aerodynamic noises. On-The-Fly aerodynamic noise model was used in software STAR-CCM+ [23]. While the flow field was simulated, aerodynamic noises induced by sound source in noise observation points were also computed. Fourier transform (Data was divided into three segments. Overlapping ratio was set as 50 %. Hanning Window function was adopted) was conducted for signals. Finally, frequency resolution was 2 Hz and the upper limit of frequency spectrum was 5 kHz. After setting computational parameters, the distribution of aerodynamic noises of cable towers could be obtained. The computational results of noises at observation point 1 were extracted to make a comparison with the experimental results of wind tunnel, as shown in Fig. 9.
Fig. 9Experiment and simulation comparison of aerodynamic noises of initial cable towers
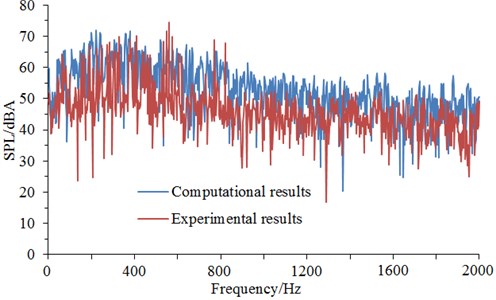
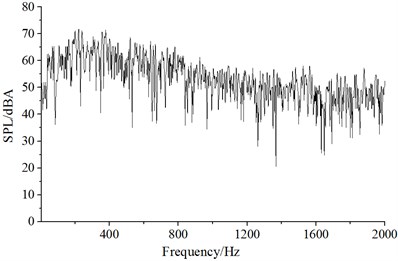
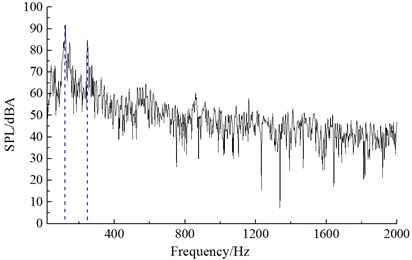
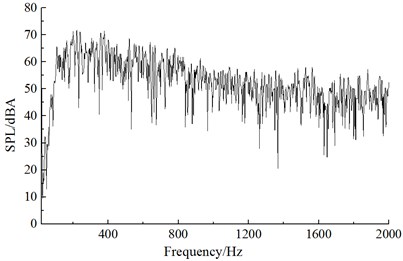
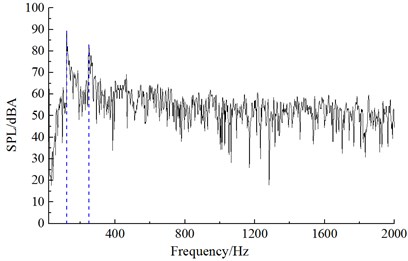
It could be seen from Fig. 9 that numerical computational results and experimental results kept good consistency and basically the same change trend, which showed that the use of the numerical computational model was reliable and it could be used for the subsequent simulation analysis. Additionally, the real boundary condition cannot be simulated completely, so there were some differences between experiments and simulation. The maximum of the computational result was 72.3 dB, while the minimum was only 19.5 dB. With the increase of the analyzed frequency, the sound pressure level was decreased in the overall trend. Fig. 10 presented the frequency spectrum of aerodynamic noises of initial bent towers at noise observation point 1, 19, 37 and 55. The aerodynamic noise of initial cable tower at observation point 1 did not show an obvious peak value. At noise observation point 19 on both sides of initial cable towers, main frequencies were 121 Hz and 245 Hz respectively. Regarding the distribution characteristics of noise spectrum of noise observation point 37 and 1, there were not obviously main frequencies in the whole frequency domain. However, the main frequencies were around 121 Hz and 245 Hz for the distribution characteristics of frequency spectrum of noise observation point 55 and 19. The amplitude of noise observation point 55 was less than that of noise observation point 19.
Fig. 10Frequency spectrum of aerodynamic noises of initial cable towers
a) Noise observation point 1
b) Noise observation point 19
c) Noise observation point 37
d) Noise observation point 55
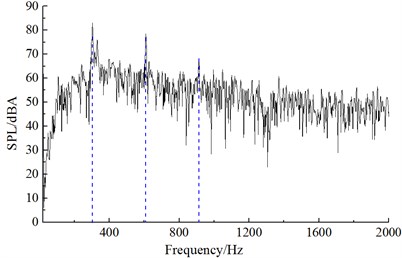
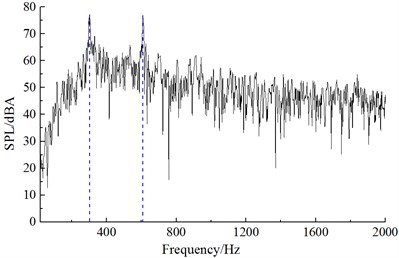
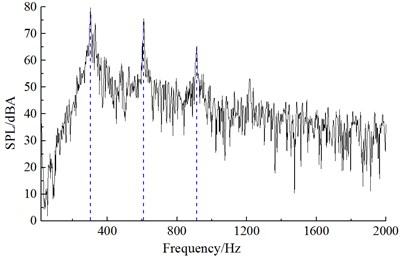
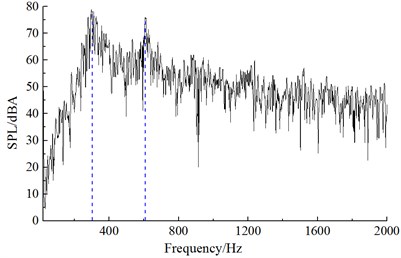
Similar to the computational process of initial cable towers, the aerodynamic noise distribution of improved cable towers could be obtained after setting the computational parameters. Noise spectrums at observation points were extracted to compare with the experimental results of wind tunnel, as shown in Fig. 11. It could be found that Fig. 11 that computational results and experiments kept good consistency and basically the same change trend, which indicated that the computational model was reliable and it could be used for the subsequent simulation analysis. Additionally, the real boundary condition cannot be simulated completely, so there were some differences between experiments and simulation. The maximum of the computational result was 83.1 dB, while the minimum was only 7.2 dB. With the increase of the analyzed frequency, the sound pressure level was decreased in the overall trend. Fig. 12 presented the frequency spectrums of aerodynamic noises caused by improved cable towers at noise observation point 1, 19, 37 and 55. Frequency spectrums of aerodynamic noises at noise observation point 1, 37 in the front and back of cable towers showed similar regulations. Peak frequencies appeared at 302 Hz, 608 Hz and 912 Hz. In a similar way, the frequency spectrums of aerodynamic noises at noise observation point 19 and 55 on both sides of cable towers showed similar regulations. Peak frequencies appeared at 302 Hz and 608 Hz. The peak value of noise observation point 55 at 302 Hz was less than the amplitude of noise observation point 19.
Fig. 11Experiment and simulation comparison of aerodynamic noises of improved cable towers
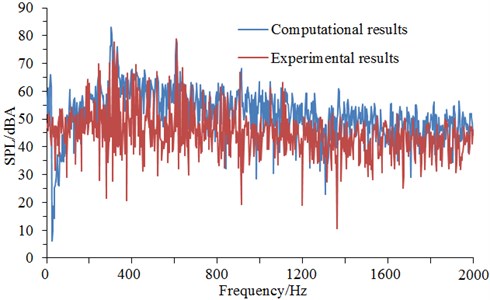
Fig. 12Frequency spectrum of aerodynamic noises of improved cable towers
a) Noise observation point 1
b) Noise observation point 19
c) Noise observation point 37
d) Noise observation point 55
5.2. Research on the generation mechanism of main frequencies
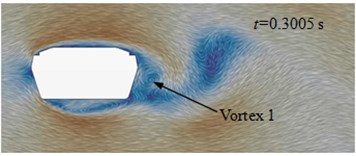
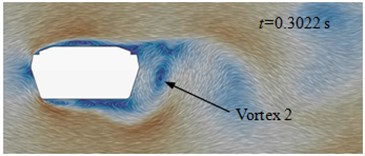
Fig. 13(a) to Fig. 13(d) presented the flow status of improved cable towers in the region of wake flow. Vortexes shed periodically at the end of cable towers. When t= 0.3005 s, vortex 1 shed from the edge of cable towers and vortex 2 was at the lower edge of cable towers. At the next moment (t= 3022 s), vortex 2 shed from the lower edge of cable towers. When t= 0.3039 s, vortex 3 shed from the upper edge of cable towers. When t= 0.3056 s, vortex 4 shed from the upper edge of cable towers. Behind the wake flow of cable towers, the average time of shedding interval (shedding cycle) of adjacent vortexes was 0.00165 s, and shedding frequency was 608 Hz. On each side, the shedding cycle (vortex 1 to 3, vortex 2 to 4) of vortexes was 0.0033 s. The corresponding shedding frequency of each side was 302 Hz. In the region on both sides of cable towers, aerodynamic noises were affected by vortex motion of each side. The main peak value was at 302 Hz. In the front and back of cable towers, aerodynamic noises were affected by the disturbance caused by vortex shedding of each side and alternative shedding of both sides. At the frequency of 302 Hz and 608 Hz, the peak values of aerodynamic noises were very obvious.
Initial cable towers of long-span bridges were rectangular cross section. Fig. 13(e) to Fig. 13(f) displayed the flow status of initial cable towers in the region of wake flow. Airflow separated and flew to both sides after meeting the windward side of cable towers. A vortex was immediately generated at the edge of windward side of cable towers of long-span bridges. After generation, the vortex moved downstream along two sides of cable towers and constantly developed. On both sides, two, three and even more vortexes could be seen. As the size of vortexes was smaller than the geometric size of cable towers of long-span bridges, the motion status of airflow flowing to both sides of cable towers was affected by the shape of each side of cable towers. For the flow status on the section of the figure, vortex shedding was not periodic apparently in the region of wake flow and vortexes at both sides of cable towers did not strictly and alternatively shed. When t= 0.4008 s, two mature vortexes were generated at the upper and lower sides. At the next moment (t= 0.4048 s), vortex of the lower side shed at the edge of the lower side and vortex of the upper side flied out in a horizontal direction. In addition, there was not vortex (t= 0.4088 s) or two vortexes shed simultaneously (t= 0.4128 s) in the region of wake flow. However, the shedding interval of adjacent vortexes was periodic for vortex motion of each side and the mean interval was 0.004 s. The corresponding frequency was 245 Hz. On both sides of cable towers, aerodynamic noises had a local peak value at the low frequency 121 Hz. Its generation mechanism remained to be further studied.
Fig. 13Flow status in the region of wake flow
a)t= 0.3005 s
b)t= 0.3022 s
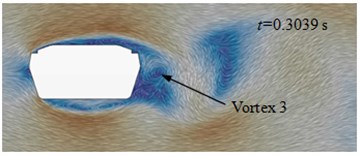
c)t= 0.3039 s
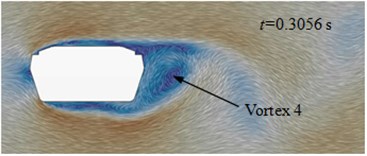
d)t= 0.3056 s
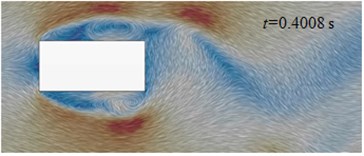
e)t= 0.4008 s
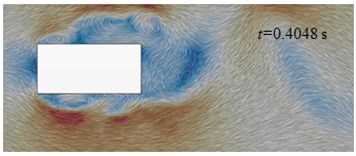
f)t= 0.4048 s
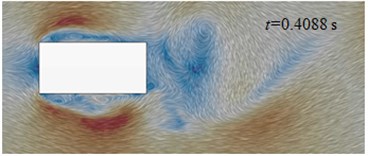
g)t= 0.4088 s
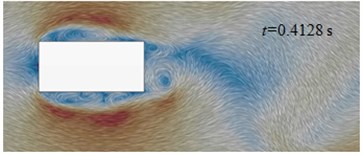
h)t= 0.4128 s
5.3. Radiation characteristics of aerodynamic noises
Improved cable towers of long-span bridges differed from the flow status of initial cable bent tower and were further reflected in the difference of aerodynamic noises. The difference of frequency spectrum of aerodynamic noises between the two was mainly shown in the following: The frequency spectrum of aerodynamic noises of initial cable towers showed no obvious peak values in the front and back of airflow and aerodynamic noises had a peak value under the frequency of its vortex shedding on both sides of airflow. Aerodynamic noises caused by improved cable towers of long-span bridges in various directions had peak frequencies corresponding to its vortex shedding. In the whole analyzed frequency range, noise value increased under the frequency (302 Hz and 608 Hz) of aerodynamic noises caused by improved cable towers of long-span bridges corresponding to the shedding cycle of vortexes. Under other frequencies, noise value decreased. Fig. 14 presented the overall SPL of improved and initial cable towers at noise observation points. Aerodynamic noises were stronger on both sides of cable towers. There were little differences in aerodynamic noise values at noise observation points (noise observation point 19 and 55) at the top and bottom. Aerodynamic noise values at noise observation points (noise observation point 13 and 1) in the front and back of cable towers differed much. Improved cable towers could weak aerodynamic noises. Cable towers of long-span bridges of improved cross section had 4.2 dBA less than that of rectangular cross section in SPL in the far-field and showed obvious effect of noise reduction.
The symmetric center of improved cable towers was taken as the center of sphere to build a spherical sound field point with a radius of 2.5 m. The sound pressure on the node of the spherical sound field was solved through extracting the time-domain signal of surface fluctuating pressure in the flow field and adopting BEM. The acoustic software VIRTUAL.LAB was adopted to compute the sound propaganda of cable towers. Sound pressure boundary conditions were applied to map the surface fluctuating pressure of cable towers obtained by CFD to the acoustic meshes of cable towers. Discrete Fourier transform was adopted to transfer the data of surface fluctuating pressure and compute acoustic responses. The radiation characteristics of aerodynamic noises of cable towers in the far-field were obtained through analyzing acoustic responses. The maximum acoustic mesh size and the highest computational frequency had to satisfy the following requirements:
where in, fmaxwas the highest computational frequency, fmax= 5000 Hz; c0= 340 m/s, the required maximum mesh size was L≤ 11.3 mm.
Fig. 14A comparison of aerodynamic noises between improved and initial cable towers
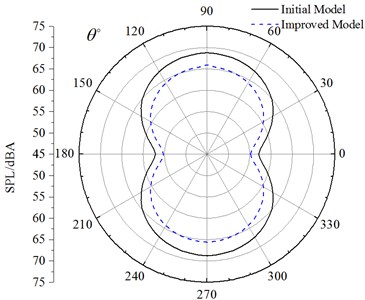
Fig. 15Noise radiation of improved cable towers in the far-field
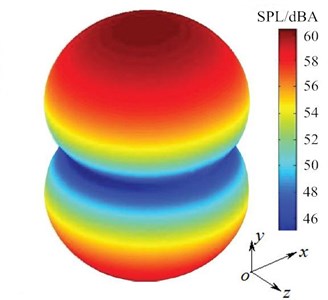
This paper selected L= 11 mm which met the requirement of sound propaganda for the minimum wavelength. Sound field radiation caused by improved structure was shown in Fig. 15. Aerodynamic noises induced by improved cross-sectional structure radiated mainly in the direction perpendicular to airflow. The radiation direction was mutually perpendicular to the symmetric plane of improved cross-sectional structure vertical to the direction of airflow. Aerodynamic sound field was symmetrical to XY plane, YZ plane and ZX plane.
5.4. Research on the noise reduction of geometric parameters of cable towers
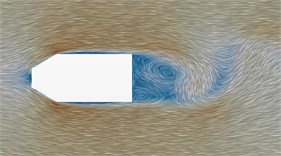
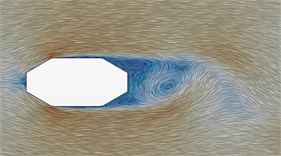
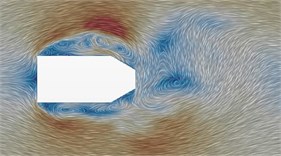
Compared with cable towers with rectangular cross section, the cycle of vortex shedding caused by improved cable towers was more obvious. Aerodynamic noise values decreased under other frequencies except that aerodynamic noise values increased under the frequency of vortex shedding. In the region outside cable towers, the overall SPL of aerodynamic noises of microphones decreased. This paper adopted chamfers in four parts including A, B, C and D of cable towers with initial cross section and obtained case 1 to case 6, as shown in Fig. 16. In addition, this paper studied the flow behavior of airflow and aerodynamic noises caused by 6 different types of cross sections.
Fig. 16Cross-section shape of case 1 to case 6 (mm)
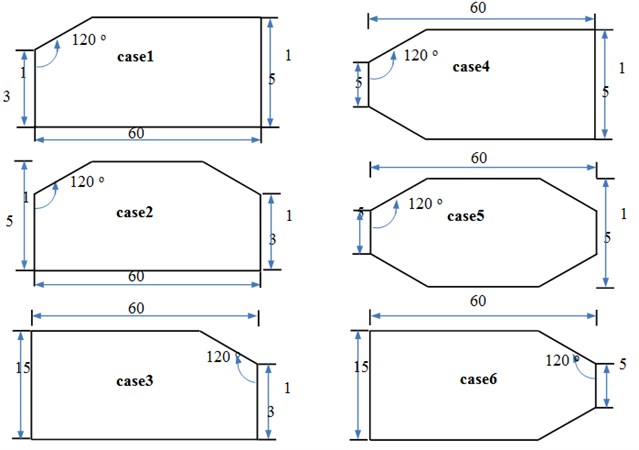
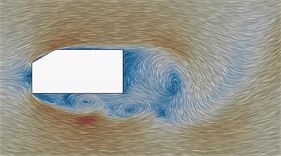
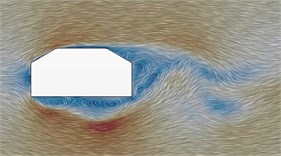
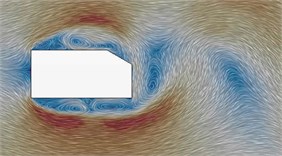
Fig. 17 showed the difference of case 1 to case 6 in flow status. After the upper side of windward side was chamfered, (case 1 and case 2), air flow which separated at the windward side and flew to the upper side did not generate an obvious vortex on the side of cable towers. However, there were vortexes shedding from the rear edge of the upper side. After the upper and lower sides of the windward side were chamfered, (case 4 and case 5), obvious vortexes could only be found in the region of wake flow. In the case of no chamfers on the windward side, (case 3 and case 6), airflow immediately generated vortexes at the edge of the windward side after flowing to both sides. As the size of vortexes was smaller than the geometric size of case 3 and case 6, a lot of vortexes could be seen on both sides of cable towers.
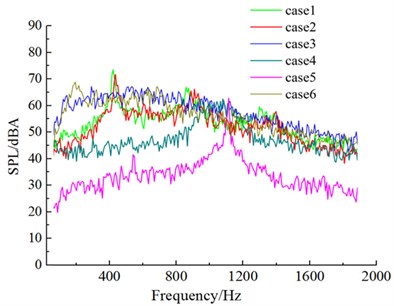
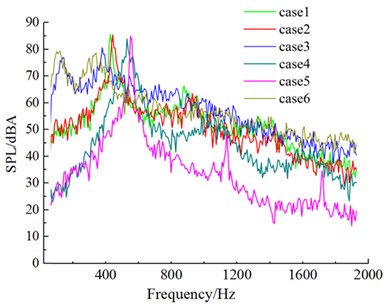
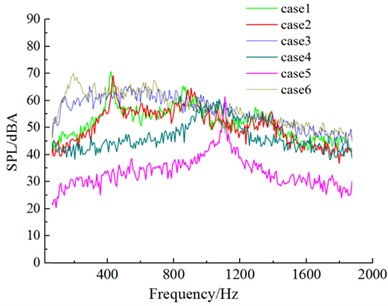
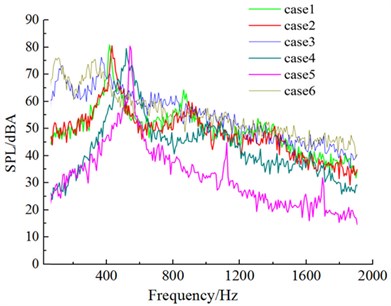
Fig. 18 drew the sound pressure spectrum of 6 kinds of cross sections in four microphones. After the upper side of the windward side was chamfered (case 1 and case 2), obvious peak values appeared on the spectrum curve of aerodynamic noises. These peak values were corresponding to respective shedding cycles of vortexes. After the lower side of the windward side was chamfered (case 4 and case 5), the frequency corresponding to peak values moved to high frequencies, (case 1 and case 4; case 2 and case 5). After the leeside was chamfered, similarly, the frequency corresponding to peak values would also show a trend of moving to high frequencies (case 1 and case 4; case 2 and case 5). It was because chamfering on the leeside enhanced the diversion effect of airflow, speeded up vortex shedding behind the leeside and increased shedding frequency. However, the frequency corresponding to the peak value of aerodynamic noise presented a trend of moving to low frequencies (case 3 and case 6) in the case of only chamfering the leeside. There was a peak value in the low frequency domain (corresponding 254 Hz in case 3; corresponding 222 Hz in case 6). Its mechanism needed to be further studied.
Fig. 17Flow status of case 1 to case 6 in the region of wake flow
a) Case 1
b) Case 2
c) Case 3
d) Case 4
e) Case 5
f) Case 6
Regarding aerodynamic noises, the decrease degree of aerodynamic noises was limited in the case of chamfering one side of the windward side (case 1). The noise value at microphone 1 decreased by 2.8 dBA; the aerodynamic noise at microphone 13 decreased by 3.7 dBA; the noise value at microphone 7 and 19 on both sides decreased by about 1 dBA. In the case of chamfering at the edge of the same side on the windward side and leeside of cable towers (case 2), the decrease amplitude of noises at microphone 7 and 19 on both sides of cable towers was less than 2 dBA. Noises at microphone 1 and 13 in the front and back of cable towers reduced by about 4 dBA. In the case of chamfering only at the same side of cable towers, the decrease amplitude of aerodynamic noises was small.
However, aerodynamic noises in the front and back of cable towers decreased by a large margin (Decrease amplitude was greater than 10 dBA) in the case of symmetric chamfers on both sides of the windward side of cable towers (case 4). Noises of microphones on both sides of cable towers decreased by about 2 dBA. Except that the noise of four microphones in case 2 and case 4 was very large under peak frequencies, their noises decreased by a large margin under other frequencies. Therefore, the shape of the windward side had a significant impact on aerodynamic noises in the front and back of cable towers. The shape of the windward side with good diversion effect could effectively reduce aerodynamic noise in the front and back of cable towers. On the other hand, vortex shedding behind the leeside in case 4 showed obvious periodicity. At the frequency of vortex shedding, aerodynamic noises stayed at a high level, which was the primary cause of small decrease amplitude of noise value on both sides of cable towers. Symmetric chamfers on the windward side and leeside (case 5) further enhanced the diversion effect of airflow flowing through cable towers. Similarly, except that the noises of four microphones in case 5 were large under the frequency of vortex shedding, noises in case 4 further decreased under other frequencies; aerodynamic noises in the front and back of cable towers decreased by more than 5 dBA in case 5 compared with the decrease amplitude in case 4; aerodynamic noises on both sides of cable towers further reduced by 1.5 dBA. Periodic vortex motion hindered aerodynamic noises on both sides of cable towers from decreasing. Chamfering on the leeside, including chamfer on one side (case 3) and symmetric chamfers on both sides (case 6), could not well reduce aerodynamic noises.
Fig. 18Aerodynamic noises of case 1 to case 6
a) Noise observation point 1
b) Noise observation point 19
c) Noise observation point 37
d) Noise observation point 55
6. Conclusions
This paper studied the aerodynamic noise of improved cable towers and initial rectangular cable tower of long-span bridges, analyzed the reason of improved cable tower for weakening aerodynamic noises and obtained the following conclusions:
1) Rectangular cable towers optimized its four corners and obtained improved cable tower, and the improved cable tower can reduce the dispersion degree of airflow, strengthened the diversion effect of airflow, weakened Karman Vortex Street and showed good effective of noise reduction in its front and back. Improved cable towers of long-span bridges had 4.2 dBA less than that of initial cable towers in SPL in the far-field and showed obvious effect of noise reduction.
2) As improved cable tower caused periodic vortex motion, aerodynamic noises were large under the frequency corresponding to the shedding cycle of vortexes, which led to difficulties in the decrease of aerodynamic noises on both sides of cable towers. Improved cable towers could weaken aerodynamic noises. Aerodynamic noises induced by improved cable towers radiated mainly in the direction perpendicular to airflow. The radiation direction was perpendicular to the flow direction of airflow.
3) Four parts of improved cable towers were optimized to reach the following conclusion: The optimization of the windward side was the key to weakening aerodynamic noises in the front and back of improved cable towers and good shape of the windward side played an important role in reducing aerodynamic noises in the front and back of improved cable towers. The optimization of the leeside played a supporting role in weakening aerodynamic noises in the front and back of improved cable towers. The incomplete optimization of the windward side like chamfering on one side of the windward side or the optimization of the leeside rather than the windward side could not play an obvious role in reducing aerodynamic noises. Weakening the periodic motion of vortexes on the premise of possessing good diversion effect and reducing aerodynamic noises at the frequency of vortex shedding could significantly reduce the aerodynamic noises on both sides of improved cable towers.
References
-
Editorial Department of China Journal of Highway and Transport. Review on China Bridge Engineering Research 2014. China Journal of Highway and Transport, Vol. 27, Issue 5, 2014, p. 1-96.
-
Li Y. L., Tang K., Cai X. T., Liao H. L. Integrated wind speed standard for long-span bridges over deep-cutting gorge. Journal of Southwest Jiaotong University, Vol. 45, Issue 2, 2010, p. 167-173.
-
Yamaguchi A., Ishihara T., Fujino Y. Experimental study of the wind flow in a coastal region of Japan. Journal of Wind and Industrial Aerodynamic, Vol. 91, Issues 1-2, 2003, p. 247-264.
-
Xiang H. F., Ge Y. J. Modern theory for wind resistant bridge and its application. Mechanics in Engineering, Vol. 29, Issue 1, 2007, p. 1-13.
-
Li Z. J., Xing S. L., Li X. H., Li Y. C. Solid finite element model and pre-stress effects of curved concrete bridge. Journal of Nanjing University of Technology (Natural Science Edition), Vol. 36, Issue 5, 2014, p. 95-101.
-
Iglesias E. L, Thompson D. J., Smith M. G. Experimental study of the aerodynamic noise radiated by cylinders with different cross-sections and yaw angles. Journal of Sound and Vibration, Vol. 361, Issue 8, 2016, p. 108-129.
-
Schlinker R. H., Fink M. R., Amiet R. K. Vortex noise from non-rotating cylinders and airfoils. Proceedings of the Fourteen Aerospace Science Meeting, Washington D.C., U.S.A., 1976, p. 76-81.
-
Schewe G. On the force fluctuations acting on a circular cylinder in crossflow from subcritical up to transcritical Reynolds numbers. Journal of Fluid Mechanics, Vol. 133, Issue 1, 1983, p. 265-285.
-
Vickery B. J. Fluctuating lift and drag on a long cylinder of square cross-section in a smooth and in a turbulent stream. Journal of Fluid Mechanics, Vol. 25, Issue 3, 1966, p. 481-494.
-
Modi V. J., Wiland E., Dikshitt A. K., Yokomizo T. On the fluid dynamics of elliptic cylinders. International Journal of Offshore and Polar Engineering, Vol. 2, Issue 4, 1992, p. 267-280.
-
Hogan J. D., Hall J. W. Experimental study of pressure fluctuations from yawed circular cylinders. AIAA Journal, Vol. 49, Issue 11, 2011, p. 2349-2356.
-
Okajima A. Strouhal numbers of rectangular cylinders. Journal of Fluid Mechanics, Vol. 123, 1982, p. 379-398.
-
Modi V. J., Wiland E. Unsteady aerodynamics of stationary elliptic cylinders in subcritical flow. AIAA Journal, Vol. 10, Issue 8, 1969, p. 1814-1821.
-
Knisely C. W. Strouhal numbers of rectangular cylinders at incidence: a review and new data. Journal of Fluids and Structures, Vol. 4, Issue 4, 1990, p. 371-393.
-
Lighthill M. J. On sound generated aerodynamically: Par1: General theory. Proceedings of the Royal Society of London, Series A, Mathematical and Physical Sciences, Vol. 211, Issue 1107, 1952, p. 564-587.
-
Curle N. The influence of solid boundaries upon aerodynamic sound. Proceedings of the Royal Society of London, Series A, Mathematical and Physical Sciences, Vol. 231, Issue 1187, 1955, p. 505-514.
-
Williams J. E. F., Hawkings D. L. Sound generation by turbulence and surfaces in arbitrary motion. Philosophical Transactions for the Royal Society of London, Series A, Mathematical and Physical Sciences, Vol. 264, Issue 1151, 1969, p. 321-342.
-
Jacob M. C., Boudet J., Casalino D., et al. A rod-airfoil experiment as a benchmark for broadband noise modeling. Theoretical and Computational Fluid Dynamics, Vol. 19, Issue 3, 2005, p. 171-196.
-
Batham J. P. Pressure distributions on circular cylinders at critical Reynolds numbers. Journal of Fluid Mechanics, Vol. 57, Issue 02, 1973, p. 209-228.
-
Szepessy S. On the span-wise correlation of vortex shedding from a circular cylinder at high subcritical Reynolds number. Physics of Fluids, Vol. 6, Issue 7, 1994, p. 2406-2416.
-
Cui G. G., Xu C. X., Zhang Z. S. The progress of turbulent eddy simulation. Aerodynamics Journal, Vol. 22, Issue 2, 2004, p. 121-129.
-
Garnier E., Sagaut P., Adams N. Large Eddy Simulation for Compressible Flows. Springer, 2009.
-
Farassat F. Derivation of Formulations 1 and 1A of Farassat. NASA/TM-214853, 2007.

