Abstract
To study unsteady aerodynamic noise characteristics in the connection position of high-speed trains, this paper established a computational model for aerodynamic noises in the connection position of high-speed trains based on computational fluid dynamics theories. This model included 2 middle trains and 1 connection structure. The detached eddy simulation (DES) was adopted to conduct a numerical simulation for the flow field around high-speed trains which were running in the open air without crosswind. The acoustic model of Ffowcs Williams-Hawkings (FW-H) was used to conduct an unsteady computation for far field aerodynamic noises in the connection position of high-speed trains. In the meanwhile, the boundary element method (BEM) was also applied to conduct an unsteady computation for the radiation of near field aerodynamic noises in the connection position. When the running speed was 250 km/h, time-domain characteristics, frequency-domain characteristics and sound propagation characteristics of aerodynamic noises in the connection position and the unsteady flow field around the connection position were obtained. Studied results showed that: vortex shedding and fluid separations in the connection position were main reasons for aerodynamic noises. In addition, main aerodynamic noise sources were at the recess and rear (the second train) in the connection position, and the first train was not an aerodynamic noise source. Peak frequencies of aerodynamic noises in the far field were 34 Hz, 79 Hz, 124 Hz and 170 Hz. When observation points were 7.5 m away from the center line of track, the maximum sound pressure level was 83.6 dB. When observation points were 25 m away from the center line of track, the maximum sound pressure level was 75.9 dB.
1. Introduction
Speed is the eternal pursuit of transportation. In recent decades, high-speed trains have achieved rapid development in the world due to comfort, efficiency, safety and reliability. In 2007, TGV trains developed by France created the surprising speed of 574.8 km/h. With the increased speed of trains, the aerodynamic problem has become increasingly obvious. Many problems have gradually presented, which has been neglected when a train runs at a low speed. For example, problems like aerodynamic drag and noise restrict the further improvement of train speed [1-5]. In the case of a low speed, aerodynamic drag took up a small proportion. When the train ran at the speed of 200 km/h to 300 km/h, aerodynamic drag was about 75 % of total resistance [6-7]. Aerodynamic drag caused by the increased speed will be obvious, and meanwhile aerodynamic noise became increasingly obvious. When the train ran at the speed of 300 km/h, aerodynamic noises caused by trains would be more than wheel-rail noises and became the main noise of high-speed trains [8]. Researches showed that the aerodynamic noise energy of high-speed trains was in direct proportion to the 6th to 8th power of the running speed [3, 4, 8-10]. With the constant improvement of train speed, dramatically aerodynamic drag had a direct influence on the energy consumption of trains. The increased aerodynamic noises not only seriously affected the comfort of passengers, but also caused noise pollution along the railway. Therefore, it was very important to study the generation mechanism of aerodynamic noises of high-speed trains, the distribution position of main noise sources, aerodynamic noise characteristics.
At present, studies on the aerodynamic noise of high-speed trains are mainly conducted through numerical computation. Due to the complexity of the studied problem, most of numerical computation only emphasizes the aerodynamic noise of some parts. References [11-13] adopted CFD method to predict the aerodynamic noise of bogies and analyze the unsteady flow behavior around the bogie. Results showed that the aerodynamic noise of bogies was a broadband noise. In addition, there were main single frequency noises. Its first order frequency was mainly caused by the vortex shedding of axles. The second main frequency was caused by the interaction between axles and wheels. Reference [14] established an analysis model for the aerodynamic noise of bogies, focused on studying the aerodynamic noise when the bogie was noise sources, and analyzed the noise reduction effect of bogies on both sides using a skirt plate. References [15, 16] reached a conclusion that the aerodynamic noise of bogies in the far field was a broadband noise and had an obvious directivity, attenuating characteristics and amplitude characteristics using numerical studies on the aerodynamic noise of bogies. Reference [17] computed different cross-section of pantograph insulator through simulation and found that the cross-section shape of optimized insulator was oval and the long axle of the oval should have the consistent direction with the flow direction of airflow. The published papers above only studied aerodynamic noises of bogies and pantographs of high-speed trains. However, aerodynamic noises in the connection position of high-speed trains were seldom reported. Through conducting wind tunnel test on high-speed trains, Wu [18] pointed out that the connection position was an obvious aerodynamic noise source and numerically studied the impact of structural form of windshield on aerodynamic noises. However, the paper only studied the impact of the connection position on near field aerodynamic noises of high-speed trains and did not involve far field radiation noises. Li and Kang [19, 20] established a simplified model for the aerodynamic noise in the connection position of high-speed trains, analyzed the impact of the shape of the connection position and windshield on aerodynamic noises based on acoustic analogy theory and Fluent software, and presented the distribution rule of exterior aerodynamic noises. However, only a two-dimensional model for the connection position was established in order to shorten the computational time. The impact of train body on the fluid around the connection position was not considered. Choi [21] conducted a wind tunnel test to study the aerodynamic noise of the connection position. However, wind tunnel test needed a higher cost. In addition, the flow status of airflow and the reason for the noise in the connection position could not be observed. Yang [22] took the simplified model of train with three compartments as the basis and studied the impact of 7 kinds of windshields on the aerodynamic performance of various compartments and connection position at the speed of 360 km/h, 420 km/h and 500 km/h respectively. However, the computational model including three compartments had great complexity and long computational time. In addition, aerodynamic noises were not computed and analyzed. Wang [23] tested the noise in the connection position of high-speed trains alone in a semi-anechoic chamber and presented the spectrum characteristics and spatial distribution rule of noises in the connection position. However, the excitation source in the test was a point sound source model and was not consistent with sound source in the actual situation.
With the advantages of Reynolds Average Navier-Stokes (RANS) and Large Eddy Simulation (LES), DES method has been used to simulate the transient flow field around the train. Computational results were consistent with experimental results [24-26]. Therefore, this paper combined DES with BEM to conduct a numerical computation for the near field and far field aerodynamic radiation noise in the connection position of a three-dimensional high-speed train. To save computational time and ensure computational accuracy, the model maintained train body structures in the front and rear of the connection position.
2. Theories of computing the aerodynamic noise of high-speed trains
2.1. Analytical method of CFD
When the running speed of trains was 250 km/h, corresponding Mach number was 0.204. Therefore, three-dimensional and incompressible unsteady N-S equation was adopted to compute the flow field around the train. DES method based on - SST turbulence model was used to solve N-S governing equation. Spatial dispersion used Roe format. Time dispersion applied LU-SGS format. The basic thought of DES was: Reynolds-average method was used at the boundary layer close to the wall. Turbulence model was applied to simulate small-scale fluctuation. In the area, far away from the surface, LES was adopted to simulate the motion of detached vortexes. DES equation based on - SST was:
wherein, is time; is density; is turbulence energy; is direction coordinates ( 1, 2, 3) representing length, width and height in turn; is the velocity component of airflow; is the generation item of turbulence; , , , and are empirical constants; is turbulence dissipation rate; is turbulence scale parameter, ; is a switch function and represents the minimum distance from vortexes to wall. In the area near the wall, is 1 and - model is taken as the model; near the edge of the boundary layer, is 0 and the model is transformed into - model; is viscous coefficient, mixed function was:
wherein, represented the minimum distance from the first layer of grids to the object plane.
In DES method, is replaced by . is the longest length of meshes. Constant is . Constant term is 0.61, 0.78. In this case, value is very large on the boundary layer close to the surface. In addition, the value of turbulence energyis limited. is far less than the size of meshes, and SST turbulence model worked. Reynolds-average method is adopted. In the area, far away from the surface, value is small. When increases to , the changed model will be considered as the sub-grid Reynolds stress model of LES.
2.2. Analytical method of CAA
Aerodynamic noises were caused by the interaction between fluid and structure when fluid flew through the solid surface. As common software, Fluent integrated the strong computational ability for aerodynamic noises. Aerodynamic noise and its numerically computational method were an also important component of CFD. Fluent could directly obtain the generation and transmission of sound wave through solving fluid mechanics equations. The method of direct numerical simulation was called as Computational Aero-Acoustics (CAA). Viscous and turbulence effects were accurately simulated through directly solving unsteady N-S equation and RANS equation [27]. CAA method called for a high-precision numerical simulation method, very fine meshes and non-reflective boundary conditions of sound wave. As a result, computational costs were high. At present, this method cannot be used to solve the aerodynamic noise of high-speed trains. Another computational method of noises in Fluent is widely-used Lighthill acoustic analogy method and also known as Aero-Acoustic Analogy (AAA). Different from CAA method, “noise analogy” method decouples wave equation and flow equation, firstly solves unsteady flow equation, then takes the solved result as noise source and obtains the solution of acoustic wave solving wave equation, which separates the solution of sound wave from the solution process of flow, improves computational efficiency and makes the solution of large and complex aerodynamic problems possible. Based on the mass and momentum conservation equation of fluid mechanics, Lighthill [28] derived the wave equation of aerodynamic noises caused by turbulence within a small-scale range surrounded by static fluid. The wave equation was expressed as:
wherein, is the disturbance quantity of fluid density. , and are density in a disturbed and undisturbed state. is Lighthill stress, . is viscous stress. is sound velocity. The left end of Eq. (4) is the same with that of general acoustic equations. The right end of Eq. (4) is equal to sound source item, known as Lighthill sound source item. If the right end item is 0, the equation is transformed into a general acoustic wave equation with the sound velocity of in static fluid. In fact, the right end of Eq. (4) includes variable . Therefore, Eq. (4) is not an acoustic wave equation. In essence, it is the flow equation of fluid. However, Lighthill pointed out that Eq. (4) was a typical acoustic wave equation. Therefore, the method was called as “noise analogy” method.
Based on Lighthill equation, FW-H applied generalized Green function to spread Lighthill acoustic analogy theory to the flow and sound production problems of fluid with any solid boundaries. Namely, the sound production problem of object moving in fluid could obtain widely used FW-H equation [27]. It was expressed as:
The right end of FW-H equation can also be considered as sound source items. The first item represents Lighthill sound source item and is a quadrupole source; the second item is sound source (force distribution) caused by surface fluctuation pressure and is a dipole source; the third item stands for sound source (displacement distribution of fluid) caused by surface acceleration and is a monopole source. Lighthill sound source item is only outside the surface of moving solid and is 0 in the surface; the second and third sound source items are produced only on the surface of solid.
3. Numerical model of aerodynamic noises in the connection position
3.1. Geometric model
This paper took the connection position of high-speed trains as the studied object, and the internal windshield was adopted in the connection position between 2 trains, as shown in Fig. 1. As the train body was not smooth, the model was simplified and some small-size parts were neglected. The connection position was also smoothed. The simplified model for the connection position of high-speed trains was shown in Fig. 2. The dimension parameters of trains were: 24.18 m long, 3.36 m wide and 3.86 m high. The structure of the internal windshield was 0.82 m long, 2.8 m wide and 3.04 m high.
Fig. 1The connection position of high-speed trains
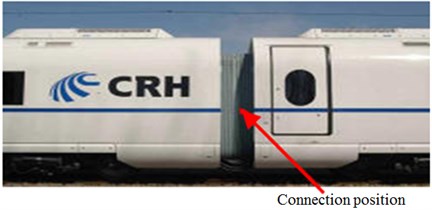
Fig. 2Model in the connection position of high-speed trains (unit: mm)

a) Longitudinal cross-section
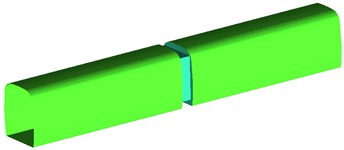
b) Geometric model
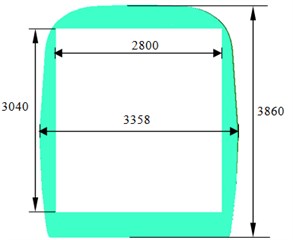
c) Horizontal cross-section
Fig. 3Computational domain of flow field
3.2. Computational domain
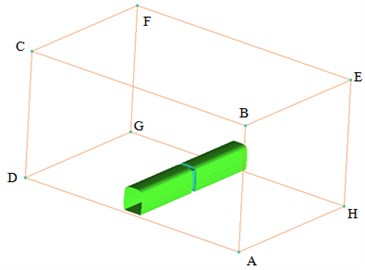
Computational domain for the aerodynamic noise in the connection position of high-speed trains was shown in Fig. 3. The length of the computational domain was 24.18 m, width was 40 m and height was 20 m. The bottom of high-speed trains was 0.376 m away from the ground where track was. The cross-section ABCD right in front of high-speed trains was inlet boundary which was set as velocity inlet condition. Velocity was 250 km/h (69.4444 m/s) when the computation was conducted. The cross-section EFGH right behind the tail train was outlet boundary which was set as pressure outlet condition with the size of 1 standard atmospheric pressure. Cross-section BCFE right above high-speed trains, ABEH at the left side of high-speed trains and DCFG at the right side of high-speed trains were set as symmetric boundary conditions. The surface of high-speed trains was set as fixed boundary which was no-slip wall boundary condition. To simulate ground effect, the ground AHGD was set as slip ground and its slip velocity was the running speed of high-speed trains.
3.3. Mesh model of computational flow field
Mesh generation tool ICEM CFD was adopted to divide meshes. The maximum size of external field was 50 mm, the maximum mesh on the surface of high-speed trains was 30 mm, and the maximum mesh in the connection position was 10 mm. Train body and surface in the connection position adopted triangular meshes. The size of three-dimensional meshes was amplified according to scale factor. Hexahedral meshes were used in the area far away from train body. Pentahedral meshes were adopted in the position of transition from tetrahedral meshes to hexahedral meshes. The total number of meshes was about 27.150.000. The schematic diagram of meshes was shown in Fig. 4.
Fig. 4Meshes of in the connection position of high-speed trains
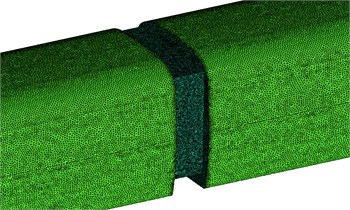
a) Meshes of train body

b) Windshield
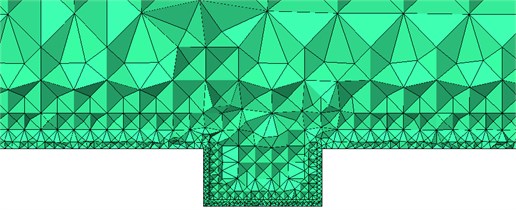
c) Meshes of longitudinal cross-section
4. Flow field of aerodynamic noises in the connection position
Fig. 5 showed the contour of pressure on the surface of trains when the high-speed train ran at the speed of 250 km/h. As displayed from Fig. 5(a), the maximum negative pressure in the connection position was in the transition from the windward side of windshield to train body, and it was –5937 Pa. As shown in Fig. 5(b), the maximum positive pressure in the connection position was at the windward side of windshield and was 2363 Pa. When airflow flowed through the connection position, airflow lingered at the windward side of windshield. Vortexes with different scales and rotational directions were at the recession. In addition, airflow at the windward side was very small. Therefore, the maximum pressure at the windward side was in this area.
Aerodynamic noise source in the connection position of high-speed trains was mainly dipole source. Surface dipole source in the connection position of high-speed trains was determined by fluctuation pressure on the surface of trains. Namely the size of fluctuation pressure on the surface of train body could be used to reflect the near-field noise radiation of sound production plane. According to three governing equations including flow field, turbulent kinetic energy equation and turbulent dissipation rate equation, the size of fluctuation pressure on the surface of train body could use turbulent kinetic energy to evaluate the distribution characteristics of noises on the surface of trains. Expression formula of kinetic energy was . Fig. 6 displayed the contour for the distribution of turbulent kinetic energy at the longitudinal cross-section and on the surface in the connection position of high-speed trains. It could be seen from Fig. 6 that the windshield area was where high turbulent kinetic energy was distributed. In addition, front-end turbulence in the windshield impacted back-end train body, which caused large near field noises in the connection position. Turbulence continued to impact the back end of train body. Vortex shedding in the connection position further intensified noise radiation in the windshield. Thus, it was clear that the connection position was the main noise source of high-speed trains. Additionally, the sound source area of high-speed trains was where airflow was easily separable and turbulent motion was drastic.
Fig. 5Contours of surface pressures in the connection position
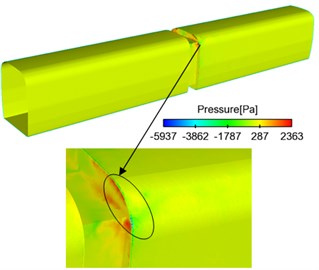
a) Whole train
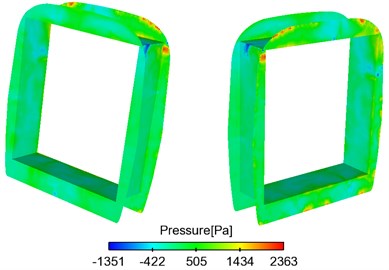
b) Windshield
Fig. 6Contours for the distribution of turbulent kinetic energy in the connection position
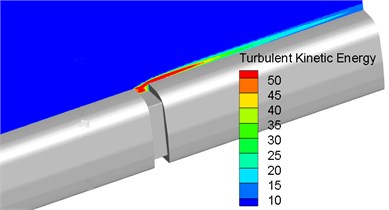
a) Longitudinal cross-section
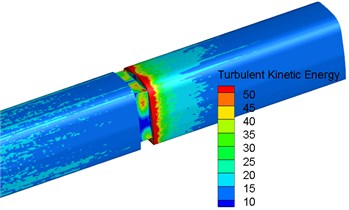
b) Head train
Fig. 7 displayed the contour for the distribution of vortexes based on -criterion (dimension was 0.006) when the high-speed train ran at the speed of 250 km/h in the connection position. As shown in Fig. 7, main vortexes appeared in the connection position and in the rear of train body. Thus, it could be seen that the vortex shedding and fluid separation of trains were main reasons for the aerodynamic noise. Fig. 7 also displayed the generation process of vortexes. Firstly, airflow got to the leeward side in the connection position. At this time, airflow had a high velocity. As leeside in the connection position was a vertical plane, airflow did not flow in the normal direction on the surface of front-end train body, but vertically entered in the connection position. In fact, the incidence direction of airflow formed a certain angle with the surface in the connection position. The flow phenomenon caused by the incidence of airflow was similar to the flow model of wall turbulence. Due to the viscous effect of solid surface, a layer of fluid close to solid surface reduced its flow velocity. The flow far away from solid surface increased its flow velocity. In this case, the flow velocity of flow increased with the increase of its distance from solid surface. Flow velocity showed stratification phenomenon. On the other hand, fluid itself was viscous. Fluid with high flow velocity and fluid with low flow velocity would interact with each other under the action of internal viscous stress. Due to the effect, a thin layer of fluid close to solid surface presented a trend of gradually getting close to solid surface in the flow process. In the case of high velocity, the trend of getting close to wall surface would finally develop into local backflow. A serious of low-velocity streaks appeared in the area close to solid surface, as shown in Fig. 7(a). Low-velocity streaks were the initial stage of vortexes development. Low-velocity streaks grew constantly. The viscous effect of solid surface weakened its binding effect on them. At this time, low-velocity streaks would oscillate. Then, vortexes rolled up, shed, stretched forward in the flow direction and formed horseshoe vortexes or crescent vortexes. On the whole, horseshoe vortexes or crescent vortexes were the most common turbulence vortexes caused by the connection position. On the other hand, turbulence vortexes shedding from the leeward side in the connection position of vehicle ends were large in size. Energy was mainly included in these large-scale vortex bodies with intensive vortexes. Vortexes stretched in the flow direction and impacted the windward side in the connection position of vehicle ends. Vortex bodies broke and formed vortexes with smaller scale. The range of vortex distribution was expanded. Vortexes with different scales and rotation directions ran fiercely in the connection position. Stripe-type vortexes formed in the position of leeward side in the connection position. Formed vortexes further accelerated turbulent flow at the recess of connection position, impacted the windward side of connection position and formed horseshoe vortexes at the windward side. The vortexes further impacted along the train body and formed crescent vortexes at the back of train body. Vortexes would be smaller and smaller when they were further away from the train body.
Fig. 7Contours for the distribution of vortexes in the connection position
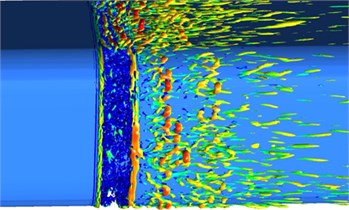
a) Vortexes in the connection position
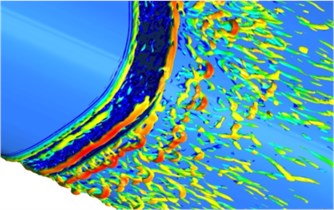
b) Zoomed drawing of vortexes
5. Far field aerodynamic noises in the connection position
5.1. Exploration on the aerodynamic noise in the connection position
In the connection position, the length-depth ratio of top, side and bottom cavities was different. For cavities with different length-depth ratios, flow behavior was different. Therefore, the mechanism of aerodynamic noises was also different. In the connection position, the length-depth ratio of top and side cavities was less than 4. The length-depth ratio of side cavity was slightly smaller, about 1. The generation mechanism of its noise could be attributed to the self-oscillation of cavity [28]. At the top and side of connection position, highly oscillatory shear flow separated at the upstream edge of cavity. Unsteady flow moved downstream and then impacted the edge of downstream. At this time, strong backflow was formed in the cavity. Energy release formed sound pressure and passed back, strengthening the unstable level of the upstream shear layer. Oscillation was caused by the structure of cavity and interaction between the downstream echo of sound wave and the upstream unstable shear layer. The schematic diagram of oscillation was shown in Fig. 8.
The noise of top and side connection position of trains mainly resulted from oscillation in Fig. 8. The period of oscillation could be expressed as the sum of the time of unstable shear flow moving from upstream to downstream and the time of sound wave produced from the edge of downstream and returned from downstream to upstream [29]. The peak frequency of aerodynamic noises was the reciprocal of oscillation period:
wherein, is the length of recess; is exchange velocity which is 60 % of running speed of trains; is air velocity; is phase lag angle. This paper selected 0.25[28]. Therefore, peak frequencies in the connection position of high-speed trains were 34 Hz, 79 Hz, 124 Hz and 170 Hz through the computation of Eq. (6).
Fig. 8Schematic diagram of oscillation in the connection position [29]
![Schematic diagram of oscillation in the connection position [29]](https://static-01.extrica.com/articles/18307/18307-img15.jpg)
5.2. Arrangement for observation points of aerodynamic noises
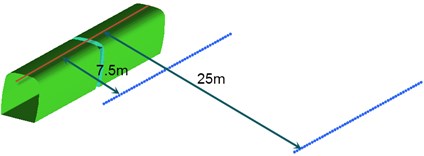
According to the relevant requirements of international standards for the aerodynamic noise test of high-speed trains [30], noise observation points for computing far field aerodynamic noises in the connection position of high-speed trains were arranged as follows: In the area which was 3.5 m high away from the track and 7.5 m away from the center line of track, 51 observation points of noises were arranged uniformly along the longitudinal direction of trains. The distance between adjacent observation points of noises was 0.5 m. In the area which was 3.5 m high away from the track and 25 m away from the center line of track, 51 observation points of noises were arranged uniformly along the longitudinal direction of trains. The distance between adjacent observation points of noises was 0.5 m. Arrangement for the detailed observation points in this paper was shown in Fig. 9.
Fig. 9Schematic diagram for observation points of aerodynamic noises
5.3. Distribution of far-field aerodynamic noises in the connection position
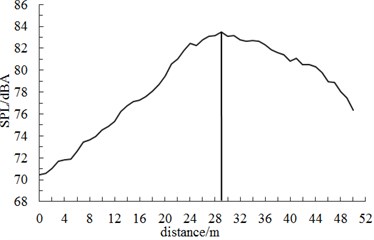
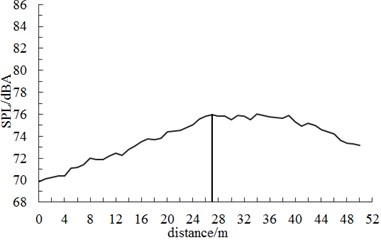
Fig. 10 displayed the diagram of A-weighted sound pressure level at different observation points when the connection position of high-speed trains ran at the speed of 250 km/h. Fig. 10 showed: The maximum sound pressure levels appeared at the back of the connection position. When the observation point was 3.5 m high away from the track and 7.5 m away from the center line of track, its maximum sound pressure level was 83.6 dB. When the observation point was 3.5 m high away from the track and 25 m away from the center line of track, its maximum sound pressure level was 75.9 dB. Sound pressure level increased firstly along the longitudinal direction of trains, reached a peak value in the connection position and decreased gradually, which was mainly caused by the attenuation characteristics of sound pressure and the oscillation of sound wave in Fig. 8. It further indicated the correctness of the computational method in this paper.
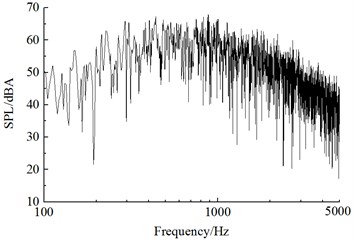
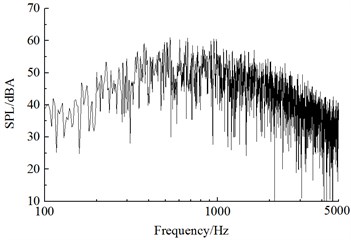
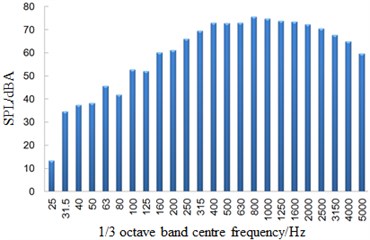
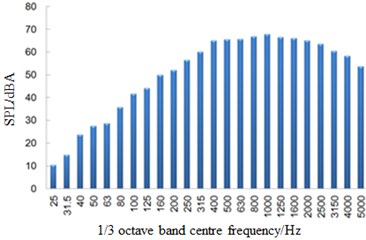
Fig. 11 showed a comparison of linear spectrums of observation points with maximum sound pressure levels in Fig. 11. Fig. 12 displayed the diagram for a comparison of one-third octave band spectrums. From Fig. 11 and Fig. 12, it could be seen that far-field aerodynamic noises in the connection position of high-speed trains had a wide spectrum and were a broadband noise, whose main energy was within 400 Hz to 2500 Hz. With the increased distance of observation points, spectrum energy of its far-field aerodynamic noise moved to high frequencies and the energy of main frequencies decreased gradually.
Fig. 10Sound pressure level in the connection position of high-speed trains
a) 7.5 m away from the center line of track
b) 25 m away from the center line of track
Fig. 11Frequency spectrum of sound pressure level in the connection position
a) 7.5 m away from the center line of track
b) 25 m away from the center line of track
Fig. 12One-third octave band spectrum in the connection position
a) 7.5 m away from the center line of track
b) 25 m away from the center line of track
5.4. Propagation of aerodynamic noises in the connection position
This paper adopted BEM to identify aerodynamic noises in the connection position of high-speed trains and study the propagation characteristics of aerodynamic noises. Time-domain signals of surface fluctuation pressure in the connection position of high-speed trains were extracted from the flow field. BEM was used to solve sound pressure at the sound field node of receiving points. Acoustic software Virtual.Lab was applied to compute sound propagation on the surface of the connection position of high-speed trains. Sound pressure boundary conditions were used to map the surface fluctuation pressure on the surface of high-speed trains through CFD computation to acoustic meshes in the connection position of high-speed trains. Discrete Fourier transform was used to transfer the data of surface fluctuation pressure. Meanwhile, this paper conducted acoustic response computation, identified aerodynamic noise source in the connection position of high-speed trains and computed far-field aerodynamic noises. Fig. 13 displayed acoustic meshes in the connection position of high-speed trains. The maximum size of acoustic meshes on the surface of the connection position of high-speed trains should satisfy the requirements of maximum frequency:
wherein, is the maximum size of acoustic meshes; is the computed maximum frequency, 5000 Hz; is the propagation velocity of sound in the air, 340 m/s.
According to the Eq. (7), the maximum size of acoustic meshes 11 mm in the connection position of high-speed trains was obtained. Therefore, the maximum size of meshes was set as 10 mm in the computation of sound propagation in this paper. Thus, the acoustic meshes computed in this paper satisfied the requirements of sound propagation for minimum wavelength.
Fig. 13Acoustic meshes in the connection position
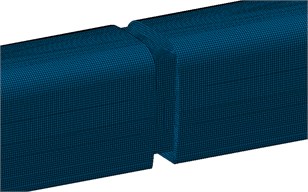
Fig. 14Aerodynamic noises on the surface of the connection position
a) 34 Hz
b) 79 Hz
c) 124 Hz
d) 170 Hz
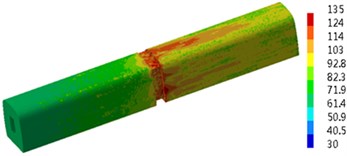
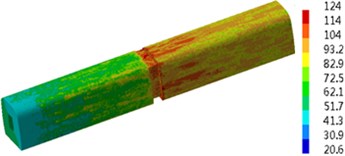
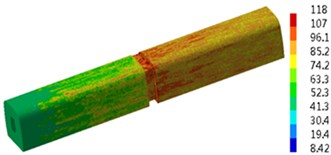
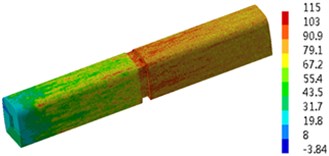
Through computing Eq. (6), peak frequencies of aerodynamic noises in the connection position of high-speed trains were 34 Hz, 79 Hz, 124 Hz and 170 Hz. Therefore, contours for the distribution of sound pressure levels of near field aerodynamic noises at these frequencies were extracted, as shown in Fig. 14. From the comparative analysis of Fig. 14, the aerodynamic noise in the connection position of high-speed trains was mainly distributed in the mid-high frequency. The energy of aerodynamic noises in the low frequency was lower than that in the mid-high frequency. Main aerodynamic noises in the connection position of high-speed trains was at the recess and back (the second train body) of the connection position. The first train body was not main aerodynamic noises.
6. Conclusions
This paper established a computational model for aerodynamic noises in the connection position of high-speed trains based on computational acoustic theories, adopted DES method to conduct unsteady computation in the connection position of high-speed trains, used FW-H model to conduct simulation analysis on the far field aerodynamic noise of high-speed trains, imported the flow field into boundary element model to analyze the near field aerodynamic noises in the connection position of high-speed trains, and reached the following conclusions:
1) The windshield was the distribution area of turbulent kinetic energy in the connection position of high-speed trains. In addition, front-end turbulence in the windshield impacted back-end train body, causing large near-field noises in the connection position. Turbulence continued to impact the back of train body. Vortex shedding in the connection position further intensified noise radiation in the windshield. Thus, it was clear that the main noise source of high-speed trains was in the connection position and the sound source of high-speed trains was where airflow was separable easily and turbulent motion was drastic.
2) Computational results of far field aerodynamic noises showed: Sound pressure level increased firstly along the longitudinal direction of high-speed trains, reached a peak value at the back of the connection position and then decreased gradually. Maximum sound pressure levels appeared at the back of the connection position. When observation points were 7.5 m away from the center line of track, its maximum sound pressure level was 83.6 dB; when observation points were 25 m away from the center line of track, its maximum sound pressure level was 75.9 dB.
3) Far field aerodynamic noises in the connection position of high-speed trains had a wide spectrum and were a broadband noise, whose main energy was within 400 Hz to 2500 Hz. With the increased distance of observation points, the spectrum energy of its far field aerodynamic noise moved to high frequencies and the energy of main frequencies decreased gradually.
4) Computation for the radiation of aerodynamic noises in the connection position of high-speed trains showed: Main noise source in the connection position of high-speed trains was at the recess and back (the second train body) of the connection position and the first train body was not main aerodynamic noise source. In addition, the main energy of aerodynamic noises was distributed in the mid-high frequency and the energy of aerodynamic noises in the low frequency was lower than that in the mid-high frequency.
References
-
Shen Z. Y. Dynamic environment of high-speed train and its distinguished technology. Journal of the China Railway Society, Vol. 28, Issue 4, 2006, p. 1-5, (in Chinese).
-
Jin X. Key problems faced in high-speed train operation. Journal of Zhejiang University Science A, Vol. 15, Issue 12, 2014, p. 936-945.
-
Nagakura K. Localization of aerodynamic noise sources of Shinkansen trains. Journal of Sound and Vibration, Vol. 293, Issue 3, 2006, p. 547-556.
-
Kitagawa T., Nagakura K. Aerodynamic noise generated by Shinkansen cars. Journal of Sound and Vibration, Vol. 231, Issue 3, 2000, p. 913-924.
-
Zhang W. H. Study on top-level design specifications of high-speed train. Journal of the China Railway Society, Vol. 34, Issue 9, 2012, p. 15-19, (in Chinese).
-
Brockie N. J. W., Baker C. J. The aerodynamic drag of high speed trains. Journal of Wind Engineering and Industrial Aerodynamics, Vol. 34, Issue 3, 1990, p. 273-290.
-
Raghunathan R. S., Kim H. D., Setoguchi T. Aerodynamics of high-speed railway train. Progress in Aerospace Sciences, Vol. 38, Issue 6, 2002, p. 469-514.
-
Mellet C., Létourneaux F., Poisson F., et al. High speed train noise emission: latest investigation of the aerodynamic/rolling noise contribution. Journal of Sound and Vibration, Vol. 293, Issue 3, 2006, p. 535-546.
-
Poisson F. Railway Noise Generated by High-Speed Trains. Noise and Vibration Mitigation for Rail Transportation Systems, Springer Berlin Heidelberg, 2015, p. 457-480.
-
Thompson D. J., Latorre Iglesias E., Liu X., et al. Recent developments in the prediction and control of aerodynamic noise from high-speed trains. International Journal of Rail Transportation, Vol. 3, Issue 3, 2015, p. 119-150.
-
Zhu J. Y., Hu Z. W., Thompson D. J. Analysis of Aerodynamic and Aeroacoustic Behaviour of a Simplified High-Speed Train Bogie. Noise and Vibration Mitigation for Rail Transportation Systems, Springer Berlin Heidelberg, 2015, p. 489-496.
-
Zhu J., Hu Z., Thompson D. J. Flow behaviour and aeroacoustic characteristics of a simplified high-speed train bogie. Proceedings of the Institution of Mechanical Engineers, Part F: Journal of Rail and Rapid Transit, Vol. 230, Issue 7, 2016, p. 1642-1658.
-
Zhu J. Y., Hu Z. W., Thompson D. J. Flow simulation and aerodynamic noise prediction for a high-speed train wheelset. International Journal of Aeroacoustics, Vol. 13, Issues 7-8, 2014, p. 533-552.
-
Huang S., Yang M., Li Z., et al. Aerodynamic noise numerical simulation and noise reduction of high-speed train bogie section. Journal of Central South University: Science and Technology, Vol. 42, Issue 12, 2011, p. 3899-3904, (in Chinese).
-
Zhang Y. D., Zhang J. Y., Li T., et al. Numerical research on aerodynamic noise of trailer bogie. Journal of Mechanical Engineering, Vol. 52, Issue 16, 2016, p. 106-116, (in Chinese).
-
Zhang Y. D., Zhang J. Y., Zhang L., Li T. Numerical analysis of aerodynamic noise of motor car bogie for high-speed trains. Journal of Southwest Jiaotong University, Vol. 51, Issue 5, 2016, p. 870-877, (in Chinese).
-
Xiao Y. G., Shi Y. Aerodynamic noise calculation and shape optimization of high-speed train pantograph insulators. Journal of Railway Science and Engineering, Vol. 9, Issue 6, 2012, p. 72-76, (in Chinese).
-
Wu J. M. Research on numerical simulation and noise reduction of aerodynamic noise in connection section of the high-speed train. Journal of Vibroengineering, Vol. 18, Issue 8, 2016, p. 5553-5570.
-
Li H., Xiao X. B., Zhu M. H., Jin X. S. Analysis on aerodynamic noise in inter-coach space of high-speed train. Journal of Vibration and Shock, Vol. 35, Issue 6, 2016, p. 109-114, (in Chinese).
-
Kang H. M., Kim C. W., Cho T. H., et al. Two dimensional numerical study in gangway of next generation high speed train for reduction of aero-acoustic noise. Journal of the Korean Society for Railway, Vol. 14, Issue 4, 2011, p. 327-332.
-
Choi S. H., Park C. S., Park J. H., et al. Experimental investigation of noise generation from the inter-coach spacing of a high-speed train. Journal of the Korean Society for Railway, Vol. 10, Issue 6, 2007, p. 786-791.
-
Yang J. S., Jiang C. W., Gao Z. X., Lv Y. C., Zhang J. B. Influence of inter-car wind shield schemes on aerodynamic performance of high-speed trains. Journal of the China Railway Society, Vol. 34, Issue 11, 2012, p. 29-35, (in Chinese).
-
Wang J. T., Sun Q., Guo W. Q., Tang Y. N. Study on interior noise characteristics of the gangway in high-speed trains. Noise and Vibration Control, Vol. 34, Issue 6, 2014, p. 97-101, (in Chinese).
-
Favre T., Efraimsson G. An assessment of detached-eddy simulations of unsteady crosswind aerodynamics of road vehicles. Flow, Turbulence and Combustion, Vol. 87, Issue 1, 2011, p. 133-163.
-
Morden J. A., Hemida H., Baker C. J. Comparison of RANS and detached eddy simulation results to wind-tunnel data for the surface pressures upon a class 43 high-speed train. Journal of Fluids Engineering, Vol. 137, Issue 4, 2015, p. 041108.
-
Miao X., Guang-jun G. Aerodynamic performance of train under cross-wind based on DES. Journal of Central South University (Science and Technology), Vol. 7, Issue 43, 2012, p. 2855-2860, (in Chinese).
-
Ffowcs-Williams J.-E., Hawkings D. L. Sound generation by turbulence and surfaces in arbitrary motion. Philosophical Transactions for the Royal Society of London, Series A, Mathematical and Physical Sciences, Vol. 264, Issue 1151, 1969, p. 321-342.
-
Lighthill M. J. On sound generated aerodynamically. Part 1: General theory. Proceedings of the Royal Society of London, Series A, Mathematical and Physical Sciences, Vol. 211, Issue 1107, 1952, p. 564-587.
-
Rowley C. W., Colonius T., Basu A. J. On self-sustained oscillations in two-dimensional compressible flow over rectangular cavities. Journal of Fluid Mechanics, Vol. 455, 2002, p. 315-346.
-
EN ISO 3095. Railway Application-Acoustics Measurement of Noise Emitted by Railbound Vehicle. 2005.
Cited by
About this article
The authors wish to thank the Science and Technology Plan Projects of Henan Province for Contract 162102310614 and 162102310147.
