Abstract
The fatigue damage of automobile is subject to long-period aero-dynamic noise when it is moving. In the paper, the response of simplified automobile model under broadband aerodynamic noise is calculated by using statistical energy analysis (SEA) and hybrid FE-SEA method, and the stress RMS of the subsystem where the maximum response happens is obtained. The simplified stress PSD shape is then created to conduct the fatigue analysis, and the result shows a good agreement with the one of bands method.
1. Introduction
A structure, such as automobile or craft, subject to wide-band random loading is commonly encountered in engineering, and the structure may cause serious fatigue damage. The finite element method is often used in the low frequency analysis, and SEA is generally applicable in the high-frequency range. In middle frequency, a new method called Hybrid FE-SEA which combines the advantages of FE and SEA method is subsequently developed [1-4]. At present, the fatigue analysis is mainly restricted in low-frequency range, because the stress PSD at the dangerous point can be easily obtained by theoretical method or commercial software based on FEM. While in middle and high frequency, the outcomes reflect only the energy distribution of SEA subsystem, which cannot be used directly for structure fatigue life assessment. Thus, it is difficult to conduct the fatigue analysis of the structure in middle and high range.
Contributions have been made by some researchers, which build a bridge to combine the average energy of the key subsystem with frequency-domain fatigue analysis. Yongyan Wang et al. [5] observed that the fatigue damage is insensitive to the shape of the stress PSD when the bandwidth is properly divided, and only the stress RMS in each frequency band is enough for the fatigue life estimation. Braccesi et al. [6] proposed the bands method, where the zero order moment of the process translated to the reference frequency in each subdivided frequency-band is used for fatigue damage evaluation. The aforementioned researches laid a good foundation for the fatigue analysis of a structure subject to broadband acoustic excitation.
In this study, the fatigue life of a simplified automobile model subject to a given broadband random excitation spectrum is predicted. The vibration energy of the structure is first calculated by using SEA and Hybrid FE-SEA, and the stress RMS of the key subsystem is obtained. Then, the simplified stress PSD is created to conduct the fatigue analysis of the simplified automobile model, and the results show a good agreement with the one of bands method.
2. Vibro-acoustic analysis of simplified automobile model
2.1. Description of the structure and frequency band division
When the automobile is running at high speed, a broadband random wind noise will act on the structural surface and induces the fatigue damage of the structure. In order to investigate the fatigue analysis of a structure in wide band, the simplified automobile model is designed as a example, and the vibro-acoustic analysis must be carried out first by adopting Hybrid FE-SEA method [7] in middle range and SEA method [8] in high range.
The simplified automobile model, shown in Fig. 1, is made of aluminum plates with the 3 mm thickness except the purple one with 1 cm thickness. Structural material density is 2700 kg/m3, Young’s modulus 7e10 N/m2, Poisson ratio 0.3, and the Damping loss factor is 0.06.
A random sound pressure spectrum in the range of 100 Hz-10000 Hz, shown in Fig. 2, is exerted on the surface of the analysis model and transformed to the diffuse acoustic field excitation in VAone software to simulate the external loads and connect all the subsystems.
One can see that, the excitation keeps strong for frequencies up to 6000 Hz and becomes small when the frequency is higher, which is consistent with the response.
Different methods are adopted in different frequency range. But the first step is to divide the frequency band, which depends on the mode numbers of each subsystem in 1/3-octave band, shown in Fig. 3. 5 modes per band is a critical modal count, and is seen as the frontier between FE subsystem and SEA subsystem [9].
Fig. 1The model and the subsystem labels
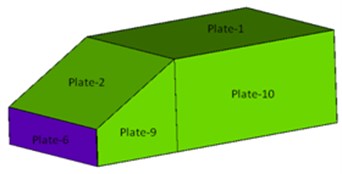
Fig. 2A random sound pressure spectrum
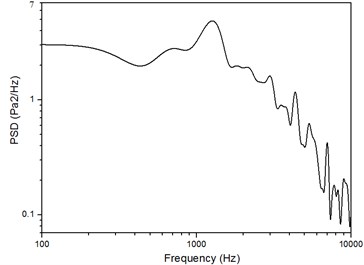
Fig. 3The mode numbers of each subsystem in 1/3-octave band
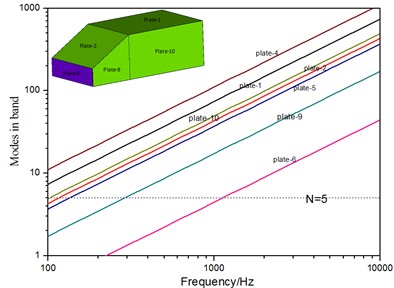
It can be seen from Fig. 3 that, above 1000 Hz the mode numbers of each subsystem are greater than 5 and SEA methodology should be employed in this frequency range. In the 250 Hz-1000 Hz range, the subsystem called plate-6 with a lower number of modes than 5 should be modelled with FE part and other subsystems which have more than 5 modes per band should be modelled SEA part. Therefore, Hybrid FE-SEA should be used for the analysis in this range.
2.2. The vibro-acoustic analysis of the concerned structure
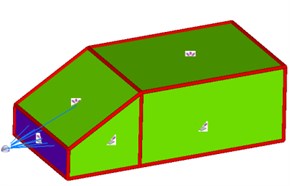
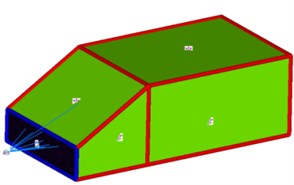
The SEA model and the Hybrid model are shown in Fig. 4, in which the red lines represent SEA line junction and the blue lines are Hybrid line junction.
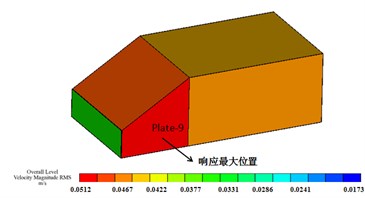
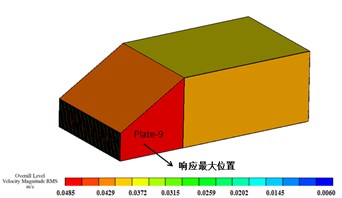
The velocity response distributions of the whole model in overall level over the range of 500 Hz-10000 Hz and the range of 250 Hz-2000 Hz are displayed respectively in Fig. 5, the result indicates that whether in high frequency range or middle range, the plate-9 is always the critical subsystem where the maximum response happens and is prone to leading to structural fatigue failure. That is to say, the fatigue analysis of the plate-9 subsystem can be considered to be the fatigue analysis of the whole structure, and only the RMS response of plate-9 subsystem in the middle and high frequency is needed, which shown in Fig. 6.
In Fig. 6, the red curve represents the solution of the Hybrid FE-SEA method in the middle frequency band, and the black line represents the solution of the SEA method in the high frequency band. It can be observed that; the two kinds of solutions are consistent in the overlap range of 500 Hz-2000 Hz.
Fig. 4The analysis model: a) SEA model, the analysis frequency range is 500 Hz-10000 Hz; b) Hybrid model, and the range is 250 Hz-2000 Hz
a)
b)
Fig. 5The velocity response distribution in overall level: a) over the range of 500 Hz-10000 Hz, the result of SEA analysis; b) over the range of 250 Hz-2000 Hz, the result of Hybrid FE-SEA analysis
a)
3. Fatigue life of the simplified automobile model in middle and high frequency band
3.1. The zero order moment of stress PSD
Having obtained the velocity RMS response of plate-9 subsystem which was found as the dangerous zone, the fatigue life evaluation of the considered structure in middle and high frequency range based on SEA and Hybrid FE-SEA method is then presented here.
The frequency-domain method is commonly used for fatigue life estimation. In this paper, the Wirsching and Dirlik’s method [5] will be utilized to predict the fatigue life of the simplified automobile model based on the simplified stress PSD, and also the bands method [6] proposed by Braccesi will be used for the comparison. In the aforementioned methods, the zero order moment of stress PSD in each frequency band will be found to be the critical quality.
For a uniform and isotropic plate, the mean square stress of the concerned subsystem can be calculated by the following formulation:
where Y0 is the Young’s modulus, ρ is the material density, and 〈v2〉 is the mean square velocity.
The results are the average response of the subsystem. Assuming that the dangerous point is M, which is located in the concerned subsystem, then the maximum stress RMS is expressed as:
where Rs is the response concentration factor, and Rs=φmax√N0 with N0 being the number of modes of the plate in a 1/3-octave band and φmax= 2 for two-dimensional vibration modes.
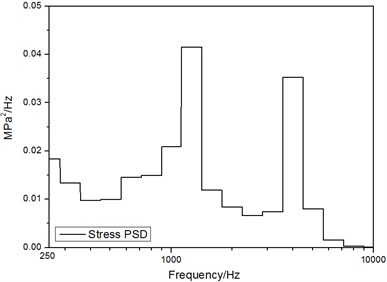
The zero order moment at the dangerous point in each 1/3-octave band, which is the critical quantity for the fatigue analysis of SEA subsystem, is given by:
Fig. 6The velocity RMS response of plate-9 subsystem at 1/3-octave bands
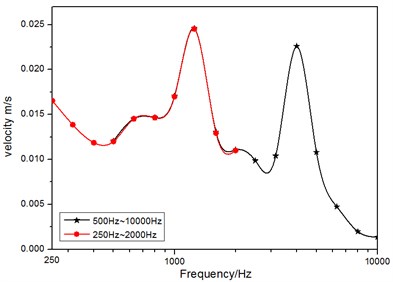
Fig. 7The simplified stress PSD at the dangerous point
3.2. The fatigue life calculation with the Wirsching and Dirlik’s method based on the simplified stress PSD
It has been found that the simplified stress PSD, compared with the real one, does not induce a large error to the calculation of fatigue damage when the frequency ratio of the upper band limit to the lower band limit is less than 1.26 [5]. And 1/3-octave division in this paper meets the requirement. Therefore, it can replace the real PSD for the calculation of fatigue damage here.
The simplified PSD is assumed to be a constant in the frequency band and is given by:
The obtained stress PSD curve is shown in Fig. 7. The stress PSD is the same in each frequency band, so the curve is composed of some line segments.
The frequency-domain method is commonly used for fatigue life estimation. In this paper, the Wirsching and Dirlik’s method will be utilized to predict the fatigue life of the simplified automobile based on the obtained stress PSD.
The damage under the Palmgren-Miner rule adopted by Wirsching method is given by:
where E[0]=12π√m2/m0(mi=∫ωiG(ω)dω), T is the loading time, C and k are the parameters of the relation SkN=C, and fWir=a(k)+[1-a(k)](1-ε)b(k), in which a(k)=0.926-0.033k, b(k)=1.587k-2.323, ε=√1-α22, α2=m2/√m0m4.
The damage with Dirlik’s method is expressed by:
where:
Q=1.25(α2-D3-D2R)D1,R=α2-xm-D121-α2-D1+D12,
xm=α1∙α2=m1√m0m2∙m2√m0m4,E[P]=12π√m4m4.
The fatigue life results used by above methods are shown in Table.1, with k= 8.360and C=3.17×10²² in the S-N relation.
3.3. The fatigue life calculation with bands method
Bands method presented recently by Braccesi [6] is very effective for fatigue life evaluation and only the zero order moment rather than four moments of the stress PSD is needed.
In bands method, the analyzed PSD function can be divided into n bands, for each of them a Rayleigh distribution could be associated for the corresponding damage calculation. The relative random process in each band has a different cycles numerousness, function of the central frequency fi. In order to realize the combination of the n processes, these processes must have the same cycles numerousness. Thereby, the operation of moving the ith process to the reference frequency fref will be performed under the condition of damage equivalence, and the newfound zero order moment of the process translated to the reference frequency is given by:
where (m0)i is the zero order moment of the ith band, k is the parameter of the S-N relation.
The zero order moment of the combination process over the whole analyzed band is then:
The damage formulation adopted by Rayleigh approximation can be transformed to the following form:
Make KRay=∫∞0Zk+1e-Z22dZ and substitute Eq. (8) into Eq. (9), then the total damage over the whole band can be obtained:
where E[0] is equal to fref when each band is narrow.
The fatigue life calculation by bands method is also shown in Table 1. Three kinds of results agree well in the concerned band, which indicates that, based on the zero order moment in each 1/3-octave band obtained from SEA or Hybrid FE-SEA method, the frequency-domain method with simplified stress PSD and the bands method are all applicable for the fatigue life estimation of a structure in middle and high frequency range.
Table 1Fatigue life of the simplified automobile model over the range of 250-10000 Hz
Method | Dirlik (simplified PSD) | Wirsching (simplified PSD) | Bands method |
Fatigue life (month) | 55.85 | 68.81 | 60.44 |
4. Conclusions
The simplified PSD method and bands method are used for fatigue life prediction in this paper. Firstly, the average energy of subsystem is calculated by using Hybrid FE-SEA method and SEA. Secondly, the average energy in each frequency are used to obtain the stress RMS at dangerous point. Thirdly, the fatigue life of the structure is calculated. A practical engineering example, which concerning the fatigue analysis of a simplified automobile model, is presented. The results show that both the two methods are applicable for the fatigue life estimation in middle and high frequency, and the zero order moment of stress PSD is the key quality to act a bridge between the fatigue life estimation algorithm and SEA or Hybrid FE-SEA method.
References
-
Zhang Guo-jun, Yan Y., Li P. Noise-induced vibration experiment of aircraft structure and vibro-acoustic coupling response analysis. Applied Mathematics and Mechanics, Vol. 34, Issue 11, 2013, p. 1157-1164.
-
Lin H., Yan Y., Li P. Aircraft Structure’s response prediction analysis and experimental study in high-strength broadband noise environments. Journal of Mechanical Engineering, Vol. 52, Issue 3, 2016, p. 71-78.
-
Yan Y., Li P., Lin H. Analysis and experimental validation of the middle-frequency vibro-acoustic coupling property for aircraft structural model based on the wave coupling hybrid FE-SEA method. Journal of Sound and Vibration, Vol. 371, 2016, p. 227-236.
-
Zou Y., Han Z., Zhang J. Research progress on full-frequency prediction techniques of spacecraft's mechanical environment. Advances in Mechanics, Vol. 42, Issue 4, 2012, p. 445-454.
-
Wang Y., Chen H., Zhou H. A fatigue life estimation algorithm based on statistical energy analysis in high-frequency random processes. International Journal of Fatigue, Vol. 83, 2015, p. 221-229.
-
Braccesi C., Cianetti F., Tomassini L. Random fatigue. A new frequency domain criterion for the damage evaluation of mechanical components. International Journal of Fatigue, Vol. 70, 2015, p. 417-427.
-
Ji L. The Analysis Method for Vibration in Middle Frequency. China Machine Press, Beijing, 2013.
-
Lyon R. H. Statistical Energy Analysis of Dynamical Systems: Theory and Applications. MIT Press, Cambridge, 1997.
-
Roibás-Millán E., Chimeno Manguan M., Martínez-Calvo B., et al. Criteria for mathematical model selection for satellite vibro-acoustic analysis depending on frequency range. 12th European Conference on Spacecraft structures, Materials and Environmental Testing, The Netherlands, 2012.
About this article
This work was supported by the Strategic Priority Research Program of the Chinese Academy of Sciences, Grant No. XDB22040502.
