Abstract
Influenced by repeated effects of vehicle loads during an operation period, a bridge structure will suffer from cyclic stress, while the corresponding fatigue damage will be generated. Therefore, it is very important to conduct on fatigue performance analysis and life assessment of a bridge during the operation period. Firstly, vehicle load spectrums and dynamic stress are determined through using field vehicle recorder and strain gauge to measure stress responses of steel-structure bridge diaphragm plates. Results show that: No.1 strain gauge was closer to the hole edge than No. 2 strain gauge, and its stress concentration was more obvious; sequence of stress values is as follows: No. 1 strain gauge > No. 2 strain gauge > No. 3 strain gauge. Then, the vehicle load spectrums are loaded into the finite element model of the steel-structure bridge (with and without struts), so stresses at holes, weld and plates are computed. Stresses at holes and plates have the similar variation tendency, but stresses at the hole are larger. Variation of stresses at welds is more complicated than other two positions when vehicles pass by. Equivalent stress amplitudes at holes, plates and other positions in the steel-structure bridge (with struts) model are less than computational results of the steel-structure bridge (without struts) model, but stress amplitudes at the weld don’t vary obviously, indicating that force at holes and plates can be effectively improved by strengthening rigidity of the diaphragm plate using struts. Finally, fatigue lives of detailed parts for the steel-structure bridge are computed. Results show that applying struts can effectively increase fatigue lives of some detailed positions, which can further improve fatigue life of the whole steel-structure bridge.
1. Introduction
A bridge structure is repeatedly influenced by vehicle loads during an operation period, so cyclic stress will be generated in the structure. For this reason, the corresponding fatigue damage will also be generated. When the fatigue damage accumulates to a certain extent, fatigue failures will happen to the structure, causing serious damage to the bridge [1]. Therefore, it is very important to conduct on fatigue performance analysis and life assessment of a bridge during the operation period.
At present, researches about fatigue life of bridges have obtained a lot of achievements. While repairing and reinforcing cracks of Seven Bridge, the British Transport and Road Research Laboratory [2] compared and analyzed fatigue performance of different connection forms between diaphragm plates and ribs, finding that welding residual stress obviously influenced fatigue strength. Wolchuk [3] found that stress concentration and welding residual stress could easily lead to fatigue cracks of welds. Through a full-scale model experiment, Kolstein [4] researched fatigue performance of welding nodes of orthotropic steel bridge decks. Hou [5] proposed a new method to estimate the time ratio of initiation and development of weld fatigue cracks, where the obtained results were more consistent with the actually measured data. Robert[6] conducted on parameter analysis of variables such as diaphragm plate thickness, arc gap size and deck thickness related to the orthotropic steel bridge deck of a highway bridge, where results show that structural deflection was obviously influenced by thickness of diaphragm plate and bridge deck. In the repair project of Williamsburg Bridge, Tsakopoulos [7, 8] conducted on full-scale experiments to compare fatigue performance of different welding forms between longitudinal ribs and webs, finding that the improved forms were beneficial for improvement of fatigue performance; AASHTO LRFD regulations were also modified according to this result. Smaia[9] conducted a 30-day static and dynamic experiment to the main-span model of Triborough Bridge and installed over 300 strain gauges to measure fatigue stress at each detailed position, finding that fatigue damage could happen most easily at the intersected welding toe between horizontal rib and longitudinal rib of an orthotropic steel deck. AASHTO’s consideration for heavy trucks was far lower than actual levels, while a method for improving holes form of diaphragm plate was proposed based on the finite element model. Pfeil [10] corrected the finite element model based on the experimental data, researched stress distribution and concentration at welding positions between trapezoid longitudinal ribs and decks of the orthotropic steel deck. And he found optimal combination of geometric dimensions through parameter analysis in order to reach the minimum stress concentration. In the detection of Japanese Kinuura Bridge, Yamada [11] found a lot of cracks at weld toes between longitudinal ribs and bridge decks, where these cracks were caused by incomplete joint welding. Jen [12] analyzed ultimate strength and capacity of a steel bridge deck with orthotropic closed trapezoid longitudinal ribs. In the repair and reconstruction project of bridge deck, Chitoshi [13] researched various reasons and improvement methods for weld cracks of the orthotropic steel deck through finite element analysis, field test, fatigue experiment and other methods. And he pointed out that cracks of longitudinal ribs between diaphragm plates were mainly caused by local bending stress of diaphragm plates, so that flexural rigidity of diaphragm plates should be improved. Through experiments and finite element analysis, Petrini [14] has conducted on estimation of fatigue life for long span suspension bridge hangers under wind action and train transit. Modeling and fatigue life assessment of orthotropic bridge deck details using FEM has been made by Aygül [15]. The results of the finite element calculations were compared with the results of the fatigue tests which were carried out on full-scale specimens. The results of the finite element analyses revealed that the structural hot spot stresses obtained from the shell element models were unrealistically high when the welds were omitted.
In this paper, stress responses of steel-structure bridge diaphragm plates during vehicle travelling were detected, travelling vehicles were videoed and data statistics was conducted to obtain a simplified vehicle load spectrum. ABAQUS finite element analysis software was used to establish a sectional model of bridge steel box girder, and stress history of testing points on the diaphragm plate was computed to calibrate the vehicle load spectrum. By the calibrated vehicle load spectrum, stress and strain history of structural details of steel-structure bridges (with and without struts) was computed, and their fatigue lives were estimated. Differences of fatigue performance of structural details for steel-structure bridges before and after applying struts were compared.
2. Finite element model of steel-structural bridges
The steel-structure bridge researched in this paper is a cable-stayed bridge with main span of 310 m+190, a single tower, double cable planes, as well as steel and concrete blended main beams. With full length of 2650 m, the bridge is composed of a main bridge, a north approach bridge, a south approach bridge, an A ramp and a C ramp; bridge deck is 23 m wide. The main hole of the steel-structure bridge was selected as the research object. With length of 289.2 m, the main hole is divided into 20 sections, where the standard section is 16 m long, 5 diaphragm plates are set in each section, the plates are 24 mm thick, and the box girder is made of 16 Mnq. Stay cables are set on two ends of the section. Steel box girders between sections are welded at the deck position, while other steel box girders are connected by bolts. The cross section of steel box girder is formed by two parallel boxes which are connected by the middle diaphragm plate; both the left and right box chambers are 9.077 m wide, and the middle area is 6.0 m wide. The deck is made of orthotropic steel deck plates which are 14 mm thick; cross section of the longitudinal ribs has a U-shaped closed form with specifications of 300×260×10 mm, and interval of 600 mm. The paper mainly researches cracks of diaphragm plates of the orthotropic steel deck, wherein 12 U-shaped ribs on both sides under the box girder bridge deck were successively numbered as No. 1-12 U-shaped ribs from the wind guide hole to the center line, as shown in Fig. 1.
Fig. 1Diagram of steel box girder cross section

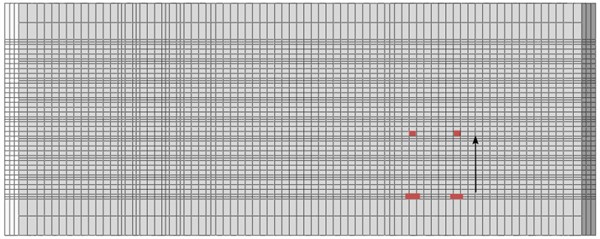
A steel box girder section with 3 diaphragm plates was taken as the computational model, and ABAQUS was used to establish its finite element model, as shown in Fig. 2. The paper mainly analyzes dynamic stress responses of the middle diaphragm plate located under No. 1 lane. Fixation of both ends of the steel box girder was set as the boundary condition. Uniform wheel loads were adopted as the loads, where area of front wheels was 0.3 m×0.2 m, and area of middle and rear wheels was 0.6 m×0.2 m. The DLOAD module was used to realize continuous moving of vehicle loads along the axial direction, as shown in Fig. 3. In fact, vehicles don’t run completely along the lane center line, while this variable was not considered during loading. Horizontal position of wheel loads was kept unchanged and subject to the lane center line measured on site. In the vehicle loads, the center line of left wheel was 1.8 m from that of right wheel. In order to increase the computational accuracy of local stress, ABAQUS sub-model technologies were applied. U ribs of the middle diaphragm plate under No. 1 lane and the diaphragm plate were divided into finer grids. Numbers of U-shaped ribs are shown in Fig. 4.
Fig. 2Finite element calculation model for steel box girder section

Fig. 3Loads of moving vehicles
3. Testing of steel-structure bridge load spectrum
Fatigue of a steel bridge is caused by accumulated fatigue damage which is generated from repeated effects of vehicle loads. The paper researches cracks of diaphragm plates in a steel-structure bridge and finds that it is very important to obtain vehicle loads applicable to a steel-structure bridge. In general, vehicle load frequency spectrum values can be obtained through manual test. The method is simple and feasible, but data such as vehicle axle load, wheel base, full/empty loads cannot be determined easily. A dynamic vehicle weighing system can rapidly and accurately measure the weight of a running vehicle and can record data such as vehicle flow. However, the system is embedded at a road toll station in general and used to monitor overweight of vehicles. It is not applicable to testing of load spectrum of a steel-structure bridge. The paper determines the vehicle load spectrums through on-site vehicle recording in combination with strain gauge measurement of stress responses of steel-structure bridge horizontal diaphragm plates.
Fig. 4Sub-model of U-shaped ribs

3.1. Layout of strain gauges
Two strain gauges were arranged at the holes on one side of wind guide hole of No. 12 U-shaped rib of an upstream diaphragm plate, where the strain gauge closer to the hole edge was numbered as No. 1, while the farther strain gauge was numbered as No. 2. The position was selected because cracks appeared at corresponding positions of both the adjacent diaphragm plates in the bridge axis direction, indicating that the position bore large loads. However, the position of the selected diaphragm plate had no crack, so that the measurement was not disturbed by cracks. A strain gauge No. 3 was arranged at struts, as shown in Fig. 5. The photo of the steel-structure bridge treated by adhesion of strain gauges is shown in Fig. 6. Data collection was carried out for twice at vehicle running peaks. Collection periods were respectively 5000 s and 2000 s. Finally, stress history of the 3 strain gauges during the two periods was obtained. No. 1 strain gauge was closer to the hole edge than No. 2 strain gauge, so that its stress concentration was more obvious. Sequence of stress values: No. 1 strain gauge > No. 2 strain gauge > No. 3 strain gauge.
Fig. 5Layout of testing points of strain gauges

Fig. 6On-site picture after adhesion of strain gauges

3.2. Computation of vehicle load spectrum and dynamic stress
During measurement of stress history of the horizontal diaphragm plates, a video recorder was set on the bridge deck to record vehicle travelling courses on the first lane in real time. Recording and strain gauge measurement were carried out at the same time. Each vehicle passing the lane was corresponding to the stress caused by it. A negative stress value obtained in the measurement indicates that the strain gauge measurement position was pressed under effects of vehicle loads. Under the pressure, defects inside steel materials could not be spread easily, and fatigue damage would not take place. However, in the actual structure, a lot of fatigue cracks were found at this position because the horizontal diaphragm plate had the initial residual stress, while the initial residual stress at the hole edge was relatively large. The position was pressed under vehicle loads, but after overlaying of it and the initial tension stress, the position would suffer from the cyclic tension stress, and fatigue cracks would happen easily. According to stress history, effects of front and rear vehicle wheels could be distinguished. In general, front and rear wheels of a heavy vehicle are equipped with multiple axles. However, the vehicle axles are close to each other, so that only two big waveforms could be observed in the stress history when front and rear wheels pass. When the wheels pass right above the detected horizontal diaphragm plate, the stress history curve reached the peak, while peak value corresponding to rear wheels exceeded that of front wheels. During the detection, we found that only vehicles on the first lane could cause stress responses. Obviously, the orthotropic steel bridge deck was influenced by vehicle loads only at some local positions.
Table 1Simplified load spectrums of five types of vehicles
No | Quantity of axle | Axle weight (kN) | Wheelbase (m) | Total weight (kN) | Diagram |
A | 2 | 15 | 2.8 | 30 | 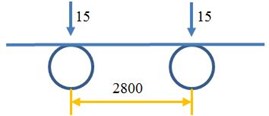 |
15 | |||||
B1 | 4 | 40 | 2.0 4.5 1.4 | 420 |  |
60 | |||||
160 | |||||
160 | |||||
B2 | 3 | 105 | 3.6 1.2 | 525 | 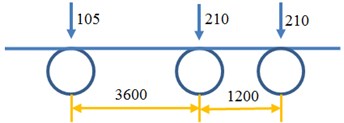 |
210 | |||||
210 | |||||
C1 | 6 | 30 | 2.9 1.4 6.9 1.4 1.4 | 340 |  |
50 | |||||
50 | |||||
70 | |||||
70 | |||||
70 | |||||
C2 | 6 | 50 | 2.9 1.4 6.9 1.4 1.4 | 865 |  |
90 | |||||
125 | |||||
200 | |||||
200 | |||||
200 |
Vehicles with high occurrence frequencies in the experiment were selected for classification and statistics. Results show that the passing vehicles are mainly classified into 5 types: small car A, light truck B1, heavy truck B2, light platform trailer C1 and heavy platform trailer C2. According to stress values measured by the strain gauges as well as front-rear stress ratios of various types of vehicles and in combination with relevant technical specifications, the simplified vehicle load spectrums could be obtained, as shown in Table 1.
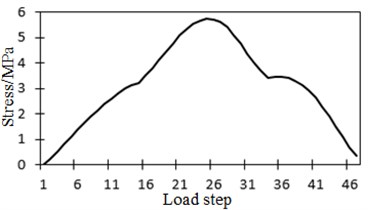
Under loads of moving vehicles, dynamic effects such as vibration and impact may be generated in a bridge structure. In bridge design specifications of different countries, the impact coefficient is used to measure the effect. The impact coefficient is influenced by conditions such as dynamic characteristics of the bridge structure, vehicle self-vibration characteristics, vehicle flow rules and deck smoothness. Impact coefficient of a bridge structure is a function of structural base frequency. As stipulated in American AASHOLRFD, the impact coefficient is the function of bridge span. Impact coefficient of 0.3 was selected in this paper. Multiplied by the coefficient of 1.3, the vehicle load spectrum was loaded into the finite element model. Stress history of units corresponding to the three strain gauge positions was computed. Stress amplitudes under each vehicle type were extracted. Results are shown in Table 2. It is shown in Table 2 that the stress amplitude: No. 1 strain gauge > No. 2 strain gauge > No. 3 strain gauge. Vehicles A and B2 were only corresponding to one stress amplitude, while other vehicle types were corresponding to two stress amplitudes. Stress history of the unit corresponding to No. 2 strain gauge position is shown in Fig. 7.
Fig. 7Stress history of No. 2 strain gauge under vehicle load spectrums
a) Stress history of Type A vehicle
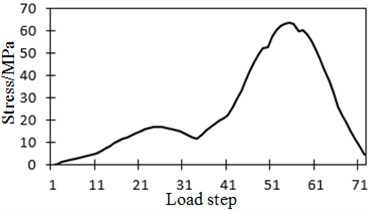
b) Stress history of Type B1 vehicle
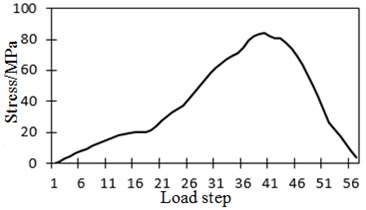
c) Stress history of Type B2 vehicle
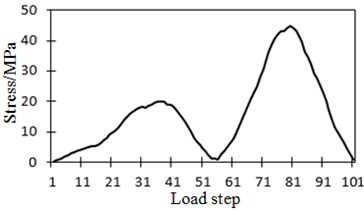
d) Stress history of Type C1 vehicle
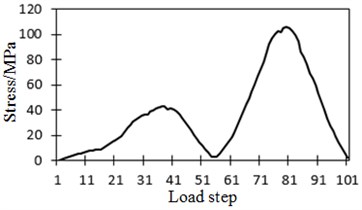
e) Stress history of Type C2 vehicle
Table 2Finite element stress amplitudes under vehicle loads
Stress value (MPa) | A | B1 | B2 | C1 | C2 | |||
No. 1 strain gauge | 14.2 | 14.4 | 160.3 | 202.4 | 57.6 | 109.2 | 105.8 | 259.2 |
No. 2 strain gauge | 5.7 | 5.4 | 63.5 | 84.0 | 23.9 | 44.6 | 42.5 | 103 |
No. 3 strain gauge | 2 | 2.5 | 22.5 | 29.3 | 8.6 | 15.4 | 14.6 | 42.9 |
4. Detailed dynamic stress analysis of steel-structure bridges
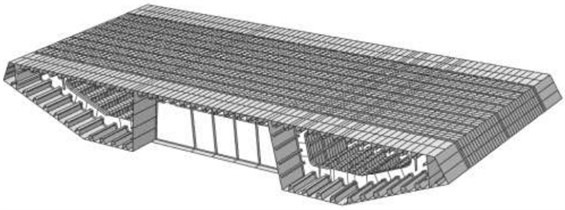
The paper mainly focuses on two finite element models – a steel-structure bridge (with stay struts) and a steel-structure bridge (without stay struts); researches fatigue mechanism of the orthotropic steel bridge deck; and estimates fatigue lives of structural details. Detailed parameters of the finite element model of steel-structure bridge (with struts) have been introduced detailedly above. When the steel-structure bridge was just built in 2002, no struts were set in splayed holes of the horizontal diaphragm plate, as shown in Fig. 8. Struts were set for repairing and reinforcing in 2010. In fact, after the original bridge was established and opened to traffic, cracks of horizontal diaphragm plates were found in the detection of 2007. In order to research initiation mechanism of the cracks and improvement of model force-bearing performance after setting of struts, the steel-structure bridge (without struts) finite element model was established for analysis. All the detailed parameters were completely consistent with those of the steel-structure bridge (with struts) finite element model, but stay bars at splayed holes of the horizontal diaphragm plates were removed, as shown in Fig. 8.
Fig. 8Finite element model of steel-structure bridge (without struts)
4.1. Stress distribution of steel-structure bridge sub-model
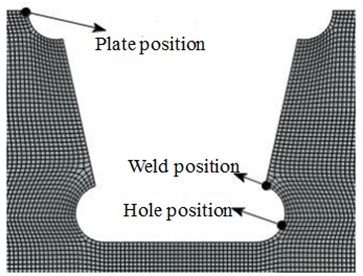
In the experiment, the stress history at the horizontal diaphragm plate hole corresponding to No. 12 U-shaped rib was measured. In fact, this position does not suffer from the most serious cracks. This position was selected under consideration of some experimental feasibility factors such as strain gauge range, while finite element analysis was not limited by this. In the simplified vehicle load spectrums, C2 vehicles had the largest loads. For example, when rear wheels of a C2 vehicle passed above the middle diaphragm plate in the finite element model, the stress distribution of horizontal diaphragm was analyzed. In the sub-model, No. 11 U-shaped rib located under wheel loads suffered from the most adverse force. The right hole position of No. 11 U-shaped rib had the largest stress of the horizontal diaphragm plate, wherein its stress cloud diagram is shown in Fig. 9. It is shown in the figure that yield happened at the position with the largest stress, and the position entered a plasticity stage. The paper focuses on three positions of the orthotropic steel bridge deck, which can easily suffer from fatigue cracks. They are respectively arc hole of horizontal diaphragm, lower end of vertical connecting weld between longitudinal rib and horizontal diaphragm plate, as well as the over-welding hole end of the connecting weld between cover plate and horizontal diaphragm plate, as shown in Fig. 10. The paper will analyze fatigue performance at three positions of No. 11 U-shaped rib, which could easily suffer from fatigue cracks.
Fig. 9Stress contour diagram at most adverse position

Fig. 10Positions with easy fatigue cracking
4.2. Detailed dynamic stress history of steel-structure bridges
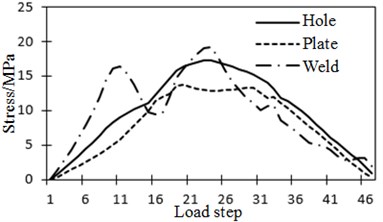
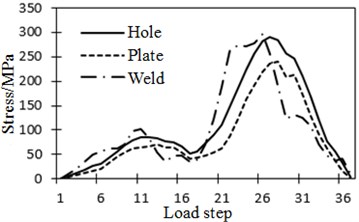
The simplified vehicle load spectrums were loaded into steel-structure bridge (with struts and without struts) finite element models. By moving the load DLOAD module, wheel loads of each car type could move forward for 300 mm along the lane at each loading step. The course since the first axle of front wheel entered the deck till the last axle of rear wheel exited the deck was simulated. Stress history of holes, weld positions and plate positions in two models was obtained. Stress history of 3 positions with easy fatigue cracking in the steel-structure bridge (with struts) sub-model is shown in Fig. 11. As for B2 vehicles, wheelbase was small; stress history at hole and plate positions only had one waveform. With regard to C1 and C2 vehicles, due to the large distance between front and rear wheels, the stress history was two independent waveforms. In the figure, the interval with stress valve of zero, counted since front wheels exited the bridge deck while the rear wheels had not reached the bridge deck, is neglected. Stress variation tendencies at holes and plate positions were similar, but stress values were larger at the holes. Stress variation at weld positions was more complicated than that at other positions during vehicle passing. By the rain-flow counting method, stress amplitude spectrums at positions with easy fatigue cracking were obtained. Results are shown in Table 3 and Table 4. By comparing data in the tables, we can find that stress amplitudes at positions of the steel-structure bridge (with struts) with easy fatigue cracking were smaller than those of the steel-structure bridge (without struts). Obviously, struts could improve local load bearing. When rear wheels of B2 and C2 vehicles passed the horizontal diaphragm plate, hole and weld positions had already entered a yield stage. Therefore, the paper will take strain amplitudes as the parameter to estimate fatigue lives of structural details.
Table 3Stress amplitude spectrum of steel-structure bridge (with struts)
Vehicle type | B1 Vehicle | B2 Vehicle | C1 Vehicle | C2 Vehicle | ||||
Times | 37 | 37 | 17 | 17 | 90 | 90 | 12 | 12 |
Stress amplitude at hole position (MPa) | 29 | 258 | 0 | 333 | 79 | 151 | 174 | 345 |
Stress amplitude at plate position (MPa) | 25 | 220 | 0 | 304 | 69 | 123 | 151 | 345 |
Stress amplitude at weld position (MPa) | 67 | 289 | 31 | 345 | 94 | 161 | 212 | 345 |
Table 4Stress amplitude spectrum of steel-structure bridge (without struts)
Vehicle type | B1 Vehicle | B2 Vehicle | C1 Vehicle | C2 Vehicle | ||||
Times | 37 | 37 | 17 | 17 | 90 | 90 | 12 | 12 |
Stress amplitude at hole position (MPa) | 35 | 302 | 0 | 345 | 94 | 180 | 203 | 345 |
Stress amplitude at plate position (MPa) | 29 | 231 | 0 | 315 | 73 | 131 | 155 | 345 |
Stress amplitude at weld position (MPa) | 71 | 304 | 79 | 345 | 95 | 171 | 222 | 345 |
Fig. 11Stress history of steel-structure bridge under vehicle loads
a) Stress history of Type A vehicle
b) Stress history of Type B1 vehicle
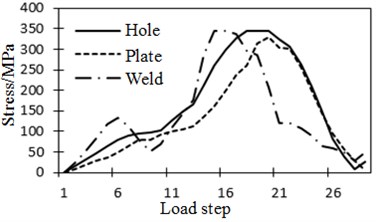
c) Stress history of Type B2 vehicle
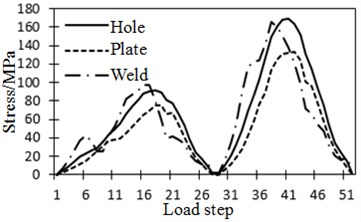
d) Stress history of Type C1 vehicle
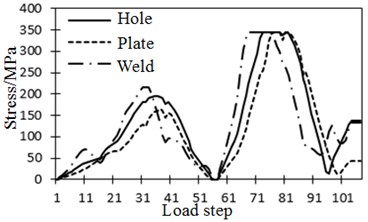
e) Stress history of Type C2 vehicle
5. Estimation of detailed fatigue life of steel-structure bridges
5.1. Analysis of detailed stress and strain history of steel-structure bridges
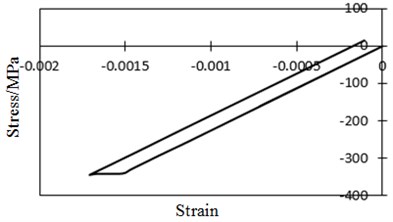
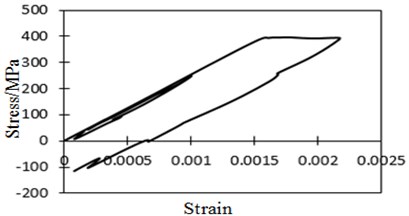
With regard to actual car flows, vehicles of various types pass the steel-structure bridge continuously. Multiple C2 vehicle loads were continuously loaded into the steel-structure bridge (with struts) finite element model so as to analyze its stress and strain history. When real wheels of C2 vehicles passed the middle horizontal diaphragm plate for the first time, holes, weld and plate positions entered a yield stage. Their stress and strain relations are shown in Fig. 12. When rear wheels of C2 vehicle got closer to the middle horizontal diaphragm plate gradually, the pressure borne at the holes increased, while elasticity was transformed into plasticity. When rear wheels reached right above the horizontal diaphragm plate, the sum of elastic strain and plastic strain reached the maximum value of –0.24 %. When rear wheels went far, the pressure stress decreased; elastic strain decreased gradually to zero. When the pressure stress decreased to zero, residual strain existed at the holes. Elastic unloading was continued around the holes. The holes bore the tension force. After unloading of wheel loads, the tension stress at the holes reached the maximum value of 120 MPa. Residual strain was generated after a cycle. Due to the subsequent vehicle load effects, force borne at the holes would be recycled according to the intensified stress and strain relations, wherein the strain amplitude was 0.2 % at this moment. In other words, the cyclic stress and strain curve of the holes is a straight line. In fact, steel materials will suffer from cyclic hardening or softening under cyclic stress, but such influence was not considered in the finite element model. In the subsequent fatigue life estimation, the intensified strain amplitude was taken as the parameter. Variation of stress and strain curve of the plate position was similar with that of the holes. Variation of stress and strain curve at the weld position was similar with the holes form, but their symbols were opposite. In other words, the weld position was pulled under wheel loads, while it was pressed after unloading.
Fig. 12Stress and strain relations at concerned point under C2 vehicle effects
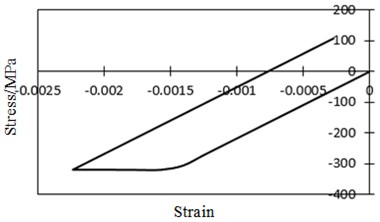
a) Stress and strain relations at hole position
b) Stress and strain relations at plate position
c) Stress and strain relations at weld position
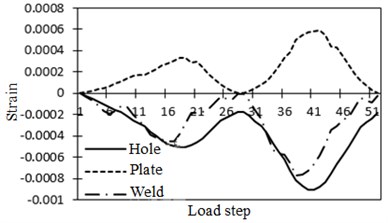
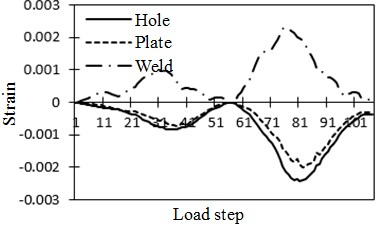
Strain history of holes, plates and weld positions of the steel-structure bridge (with struts) diaphragm plate under the simplified vehicle load spectrums is shown in Fig. 13. It is shown in the figure that pressure-bearing strain values at holes and plates are negative, while tension-bearing strain values at the weld position are positive. Variation rules of strain history are consistent with those of stress history. Strain value at the holes exceeded that at the plate position. Strain variation at the weld position was more complicated. Effects of front and rear wheels can be distinguished from the strain history.
Strain amplitude spectrums at three positions with easy fatigue cracking in two steel-structure bridge (with stay struts and without struts) models under the simplified vehicle load spectrums are analyzed, as shown in Table 5 and Table 7. Equivalent strain amplitudes are shown in Table 6 and Table 8. If strain amplitudes caused by all the vehicles are considered in the equivalent computation, the quantity of equivalent times at hole and plate positions is 295; there are two corresponding strain amplitudes at the weld position due to B2 vehicle, and the quantity of equivalent times is 312. When the equivalent calculation only takes into account the strain amplitudes caused by heavy vehicle rear wheels, the total quantity of equivalent times is 29.
Fig. 13Strain history of steel-structure bridge under vehicle loads
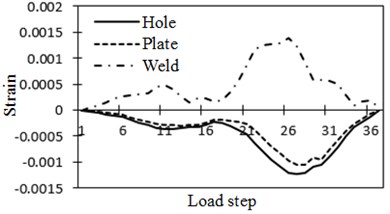
a) Strain history of B1 vehicle
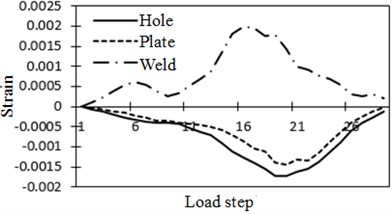
b) Strain history of B2 vehicle
c) Strain history of C1 vehicle
d) Strain history of C2 vehicle
Table 5Strain amplitude spectrum of steel-structure bridge (with struts)
Vehicle type | B1 vehicle | B2 vehicle | C1 vehicle | C2 vehicle | ||||
Times | 37 | 37 | 17 | 17 | 90 | 90 | 12 | 12 |
Strain amplitude at hole position (MPa) | 0.014 | 0.123 | 0 | 0.159 | 0.038 | 0.072 | 0.083 | 0.200 |
Strain amplitude at plate position (MPa) | 0.012 | 0.105 | 0 | 0.144 | 0.033 | 0.058 | 0.072 | 0.170 |
Strain amplitude at weld position (MPa) | 0.032 | 0.137 | 0.029 | 0.180 | 0.045 | 0.078 | 0.101 | 0.230 |
Table 6Equivalent strain amplitude spectrum of steel-structure bridge (with struts)
Parameter | Equivalent strain value (%) | Equivalent stress value (MPa) | Equivalent strain value (%) | Equivalent stress value (MPa) |
Times | 295,312 (with consideration of all vehicles) | 29 (with consideration of heavy vehicle rear wheels) | ||
Hole | 0.098 | 206 | 0.178 | 374 |
Plate | 0.085 | 178 | 0.156 | 328 |
Weld | 0.209 | 229 | 0.203 | 427 |
Table 7Strain amplitude spectrum of steel-structure bridge (without struts)
Vehicle type | B1 vehicle | B2 vehicle | C1 vehicle | C2 vehicle | ||||
Times | 37 | 37 | 17 | 17 | 90 | 90 | 12 | 12 |
Strain amplitude at hole position (MPa) | 0.017 | 0.144 | 0 | 0.180 | 0.045 | 0.086 | 0.097 | 0.238 |
Strain amplitude at plate position (MPa) | 0.014 | 0.110 | 0 | 0.150 | 0.035 | 0.063 | 0.074 | 0.177 |
Strain amplitude at weld position (MPa) | 0.034 | 0.145 | 0.038 | 0.186 | 0.045 | 0.082 | 0.106 | 0.220 |
Table 8Equivalent strain amplitude spectrum of steel-structure bridge (without struts)
Parameter | Equivalent strain value (%) | Equivalent stress value (MPa) | Equivalent strain value (%) | Equivalent stress value (MPa) |
Times | 295,312 (with consideration of all vehicles) | 29 (with consideration of heavy vehicle rear wheels) | ||
Hole | 0.115 | 241 | 0.208 | 436 |
Plate | 0.089 | 185 | 0.162 | 340 |
Weld | 0.111 | 232 | 0.204 | 428 |
It is found in data comparison of Table 6 and Table 8 that equivalent stress amplitudes at hole and plate positions of the steel-structure bridge (with struts) model were smaller than computational results of the steel-structure bridge (without struts), but variation at the weld position was not obvious. This result shows that setting of struts and strengthening of horizontal diaphragm plate rigidity could effectively improve force borne by hole and plate positions, but cannot influence the weld position obviously.
5.2. Computation of fatigue life
Expression of the strain-life curve used by local stress-strain approach is as follows:
where: denotes a fatigue intensity coefficient; denotes an elastic modulus; denotes a fatigue life; denotes a fatigue continuity coefficient; denotes a fatigue intensity index; denotes a fatigue continuity index.
The Q345 fatigue experimental results given in Reference [16] are substituted into Eq. (1). The obtained fatigue life formula is as follows:
Initial residual stress was not considered in the finite element model, while average stress in the computational stress history did not satisfy actual situations, so that this amendment is not considered in this paper. Equivalent strain amplitudes in Table 6 and Table 8 are substituted into Eq. (2). The estimated fatigue lives are shown in Table 9 and Table 10. Data in the tables is analyzed. When the 29 times are considered during computation of equivalent strain amplitudes, namely the stress amplitude was small, the estimated life would not be reasonable. In the steel-structure bridge (without struts) model, the weld position is the most adverse and has the shortest fatigue life of 15 years. In the steel-structure bridge (with struts), the fatigue life is still 15 years at this position. Obviously, struts cannot improve fatigue performance at this position. In the steel-structure bridge (without struts) model, the hole position is the most adverse, and has the shortest fatigue life of 13 years.
Table 9Estimation of fatigue life of steel-structure bridge (with struts)
Parameter | Equivalent times | Equivalent strain amplitude (%) | Frequency | Year | |
Hole | 295 | 0.098 | 1.2E+9 | 0.059 | 650 |
29 | 0.178 | 7.4E+6 | 0.0058 | 40 | |
Plate | 295 | 0.085 | 4.6E+9 | 0.059 | No damage |
29 | 0.156 | 2.1E+7 | 0.0058 | 114 | |
Weld | 312 | 0.109 | 4.6E+8 | 0.0624 | 234 |
29 | 0.203 | 2.8E+6 | 0.0058 | 15 |
Table 10Estimation of fatigue life of steel-structure bridge (without struts)
Parameter | Equivalent times | Equivalent strain amplitude (%) | Frequency | Year | |
Hole | 295 | 0.115 | 2.8E+8 | 0.059 | 152 |
29 | 0.208 | 2.4E+6 | 0.0058 | 13 | |
Plate | 295 | 0.088 | 3.3E+9 | 0.059 | No damage |
29 | 0.162 | 1.5E+7 | 0.0058 | 84 | |
Weld | 312 | 0.111 | 3.9E+8 | 0.0624 | 198 |
29 | 0.204 | 2.8E+6 | 0.0058 | 15 |
6. Conclusions
1) Vehicle load spectrums and dynamic stresses were determined through field vehicle recording and strain gauge test of stress responses of steel-structure bridge diaphragm plates. Results show that: No. 1 strain gauge was closer to the hole edge than No. 2 strain gauge; its stress concentration was more obvious; sequence of stress values: No. 1 strain gauge > No. 2 strain gauge > No. 3 strain gauge.
2) The simplified vehicle load spectrums were loaded into steel-structure bridge (with and without struts) finite element models so as to obtain stress history of the two models at holes, weld and plate positions. Stress at the holes had the same variation tendency with that at the plate position, but stress values at the holes were larger. Variation of stress at the weld position was more complicated than other two positions during vehicle running.
3) Stress amplitude spectrums at positions with easy fatigue cracking were obtained through the rain-flow counting method. Stress amplitudes at the positions with easy fatigue cracking in the steel-structure bridge (with struts) were smaller than those of the steel-structure bridge (without struts). Obviously, stay bars set during repairing and reinforcing could improve local load carrying.
4) Equivalent stress amplitudes at hole and plate positions of the steel-structure bridge (with struts) model were smaller than computational results of the steel-structure bridge (without struts) model, but variation at the weld position was not obvious. This result shows that setting of struts and strengthening of horizontal diaphragm plate rigidity could effectively improve force borne by hole and plate positions, but cannot influence the weld position obviously.
5) In the steel-structure bridge (without struts) model, the weld position is the most adverse and has the shortest fatigue life of 15 years. In the steel-structure bridge (with struts), the fatigue life is still 15 years at this position. Obviously, struts cannot improve fatigue performance at this position. However, setting of struts could effectively improve fatigue lives at other positions.
References
-
Wang C. S., Zhou J., Wu Q. Y. Fatigue life and service safety assessment for existing concrete bridges. China Journal of Highway and Transport, Vol. 25, Issue 6, 2012, p. 101-104.
-
Cuninghame J. R. Strengthening fatigue prone details in a steel bridge deck. Fatigue of Welded Structure, 1987, p. 127-137.
-
Roman Wolchuk Lessons from weld cracks in orthotropic decks on three European bridges. Journal of Structural Engineering, Vol. 116, Issue 1, 1990, p. 75-84.
-
Kolstein M. H., Wardenier J., Cuninghame J. R., Beales C. Fatigue strength of welded joints in orthotropic decks. Welding in the World, Vol. 38, 1996, p. 175-194.
-
Hou C. Y., Charng J. J. Models for the estimation of weldment fatigue crack initiation life. International Journal of Fatigue, Vol. 19, Issue 7, 1997, p. 537-541.
-
Connor Robert J. A Comparison of the in-service Response of an Orthotropic Steel Deck with Laboratory Studies and Design Assumption. Lehigh University, 2002.
-
Tsakopoulos Paul A., Fisher John W. Full-scale fatigue tests of steel orthotropic decks for the Williamsburg Bridge. Journal of Bridge Engineering, Vol. 8, Issue 5, 2003, p. 323-333.
-
Tsakopoulos Paul A., Fisher John W. Fatigue performance and design refinements of steel orthotropic deck panels on full-scale laboratory tests. Steel Structures, Vol. 5, Issue 3, 2005, p. 211-223.
-
Abdou Samia, Zhang Wuzhen, Fisher John W. Orthotropic deck fatigue investigation at Triborough Bridge. Transportation Research Record: Journal of the Transportation Research Board, Vol. 1845, Issue 1, 2003, p. 153-162.
-
Pfeil Michèle S., Battista Ronaldo C., MergulhãoAluísio Jr. Stress concentration in steel bridge orthotropic decks. Journal of Constructional Steel Research, Vol. 61, Issue 8, 2005, p. 1172-1184.
-
Xiao Zhi-Gang, Kentaro Yamada, Jirou Inoue, Kouta Yamaguchi Fatigue cracks in longitudinal ribs of steel orthotropic deck. International Journal of Fatigue, Vol. 28, Issue 4, 2006, p. 409-416.
-
Jen Wallchun Strength of Steel Orthotropic Deck with Trapezoidal Shaped Longitudinal Stiffeners. Lehigh University, 2006.
-
Chitoshi Miki Fatigue damage in orthotropic steel bridge decks and retrofit works. Journal of Steel Structure, Vol. 6, Issue 4, 2006, p. 255-267.
-
Petrini F., Bontempi F. Estimation of fatigue life for long span suspension bridge hangers under wind action and train transit. Structure and Infrastructure Engineering, Vol. 7, Issues 7-8, 2011, p. 491-507.
-
Aygül M., Al-Emrani M., Urushadze S. Modelling and fatigue life assessment of orthotropic bridge deck details using FEM. International Journal of Fatigue, Vol. 40, 2012, p. 129-142.
-
Luo Y. R., Wang Q. Y., Liu Y. J., Huang C. X. Low cycle fatigue properties of steel structure materials Q235 and Q345. Journal of Sichuan University (Engineering Science Edition), Vol. 44, Issue 2, 2012, p. 169-175.
