Abstract
Finite element method (FEM) is used to calculate coupling loss factor (CLF), which is an important parameter in statistical energy analysis(SEA). The results are in good agreement with the one of wave method, and the relative error of the two methods is calculated. The influence of side length of the plate, internal loss factor (ILF), concentrated mass and boundary conditions on the calculation accuracy of CLF is studied by FEM. It is found that, with the increase of the side length the results of CLF become more reliable. In the low frequency band, the influence of concentrated mass and boundary conditions on CLF is obvious, while the influence can be neglected in the high frequency band. In order to ensure the accuracy of CLF, ILF should be much larger than CLF, but ILF can’t be increased indefinitely.
1. Introduction
In the aerospace field high-frequency sound and vibration problems are often encountered, which is induced by turbulence noise during hypersonic flight and jet noise at rocket take-off and so on [1, 2]. At present, statistical energy analysis (SEA) is considered as the most effective analytical method to solve high frequency vibration problems. The key step of the SEA is to determine the relevant parameters, such as coupling loss factor (CLF). The CLF between two SEA subsystems are mainly solved by wave method. Many scholars have used wave method to calculate the CLF of L and T-shaped plate, and the results have been widely recognized [3, 4]. However, wave method is only suitable for solving the CLF of simple structure. For more complex connection systems, it is necessary to determine the CLF by experiment. Because of the assumption of weak coupling in SEA, it is difficult to guarantee the accuracy of measurement by experiment [1]. And it costs a lot of time and effort for the design and implementation of the experiment [5]. In recent decades, finite element method (FEM) becomes another available method to calculate CLF [6].
As we know, FEM is still effective for structure with complicated geometry, and it can be used to solve the high frequency problem when the meshing is fine, which makes up for the deficiency of theoretical calculation and experimental measurement. Many scholars have used FEM to calculate the CLF of L, T and X-shaped plate [7-9]. Compared with wave method and experiment, the validity of FEM for calculating CLF is proved. However, fine meshing will result in a substantial increase of the computational complexity, and the results of FEM are sensitive to the details of the structure in high frequency band [10]. At present, FEM can only obtain the total energy of the plate, including bending, longitudinal and transverse energy. So, a certain error may be introduced when calculating the bending CLF by FEM. In addition, different boundary conditions will also have influence on the structural response, and the magnitude of the error is related to the specific structure and frequency range.
In this paper, FEM is used to calculate the bending CLF of an L-shaped plate, and then the relative error between FEM and wave method is analyzed. Finally, the influence of side length, internal loss factor (ILF), concentrated mass and boundary condition on the accuracy of CLF are studied, and some suggestions is presented for obtaining the exact CLF by FEM.
2. CLF calculated by wave method
As shown in Fig. 1, the L-shaped plate is composed of plate 1 and plate 2, which is coupled with a line junction. Each plate contains bending wave, longitudinal wave and transverse wave. Therefore, the coefficient of energy propagation should be written as τ12ij, where subscript is the symbol of the waveform (i, j=b, l, t). Assuming that, an impulse wave with an amplitude of α, an incident angle of θ and a frequency of ω is applied to the plate 1. The incident wave power is P1i and the outgoing wave power is P2j, so the coefficient of energy propagation corresponding to the incident angle θ can be obtained:
At the coupling junction, the power expression of the three waveforms Pi can be expressed as [3]:
where kb, kl and kt are the wave numbers of bending wave, longitudinal wave and transverse wave, respectively.
For the reverberant sound field, the energy of the incident wave at different angles need to be integrated. So, the coefficient of energy propagation τ12ij(ω) can be obtained by integrating the incident angle θ with Eq. (1), as follows:
Based on the obtained coefficient of energy propagation, the CLF between the mode group Yi of the plate 1 and the mode group Yj of the plate 2 can be given [1]:
where, f is the frequency, l is the length of the junction between the plates, A is the area of the plate, cgi is the wave group velocity, for different waveforms:
Cgi=√Gm/ρm(1-μ2m),i=t.
3. CLF calculated by FEM
The FEM form of structural vibration equation is written as:
where, Ks, Cs and Ms are the rigid matrix, damping matrix and mass matrix, respectively; dj is the displacement of node, Fs is the external excitation, i is the unit imaginary number and ω is the circular frequency.
The displacement of node can be obtained by using FEM, and then the energy of vibration EVib can be expressed as:
where, EKE and EPE are the maximum kinetic energy and potential energy of vibration, respectively.
If there are only two subsystems, the governing equations of SEA can be expressed as:
where, ηn, En, Pn are the ILF, vibration energy and input power of subsystem n, respectively, η12 and η21 are the CLFs between plate 1 and plate 2.
When the two subsystems are the same, η12=η21; if only subsystem 1 is applied loading, then P2=0. The CLF can be calculated by Eq. (9):
When using the FEM, the ILF is known, and the energy of the subsystem has been calculated before, so the bending CLF of the two subsystems can be calculated by Eq. (10).
Fig. 1Geometrical model of L-shaped plate
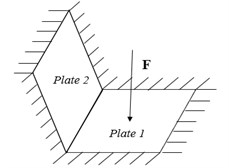
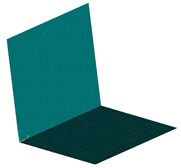
Fig. 2Finite element model of L-shaped plate
4. The analysis of numerical example
The L-shaped plate finite element model shown in Fig. 2, The material and geometric dimensions of the two plates are identical, with thickness h=0.006 mm, side length L=0.4 m, Poisson’s ratio μ=0.333, ILF η=0.1, density = 2700 kg/m3. The loading position is the center of the plate 1, and the amplitude of the harmonic force is 1 N. The boundary of the plates is fixedly supported except the coupling side.
The frequency of analysis is very high, so the meshing should be very density. Considered of the accuracy and efficiency of calculation, the convergence of meshing should be examined. The meshing size is 0.002 m and 0.001 m, respectively. The CLFs of two kinds of meshing are shown in Fig. 3. It can be seen that the two curves are almost the same, so 0.002 m satisfies the accuracy requirement.
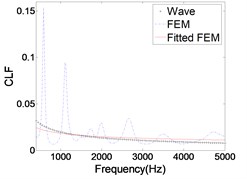
The CLFs calculated by FEM and wave method are shown in Fig. 4. The results of FEM have obvious fluctuation in low frequency band. Because plate mainly displays the overall mode in the low frequency band, and each peak corresponds to the intrinsic mode of the plate. With the frequency increases, a large number of local modes appear, so the fluctuation is relatively flat. In order to facilitate comparison with the results of wave method, the FEM results need to fit into a smooth curve. It is noticed that the CLF curve calculated by FEM is a straight line in log-log coordinate. Therefore, the CLF curve is fitted in log-log coordinate, which is denoted by ‘Fitted FEM’ in figures. The results of wave method and ‘Fitted FEM’ are basically same, and the relative error of the two methods gradually decrease with the increase of frequency. And the ‘Fitted FEM’ results are larger than those of the wave method. The main reason is that the vibration of plate is divided into three forms, namely, bending, stretching, shear vibration. In SEA, these three vibrations are divided into three subsystems. But when using FEM calculation, the energy of the three vibrations is coupled together and can’t be distinguished. In addition, the excitation force is perpendicular to the surface of the plate, so the bending wave of the plate is mainly excited. Although the longitudinal and transverse wave energy is relatively small, it is equivalent to bending vibration energy that causes the CLF to be slightly larger than the true value.
Fig. 3The CLFs calculated by different meshing sizes
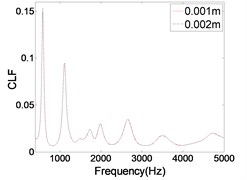
Fig. 4The CLFs calculated by FEM and wave method
4.1. Influence of side length on CLF
As shown in Fig. 5, The CLF is calculated when the side length is 0.2 m, 0.6 m and 0.8 m respectively. It can be seen that the results of the two methods are quite different when the side length is 0.2 m. When the thickness of the plate is constant, the relative error of FEM and wave method is gradually reduced with the increase of the side length, and the results are almost the same in the high frequency band. Therefore, it can be concluded that, with the increase of the side length the results of CLF are more reliable.
Fig. 5The CLFs with different side length
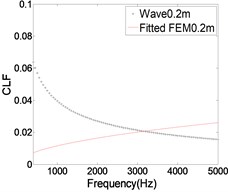
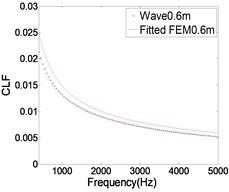
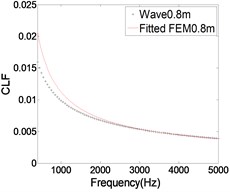
Fig. 6The CLF between the waveforms varies with side length and frequency
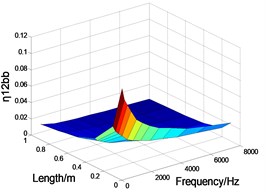
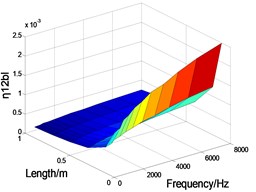
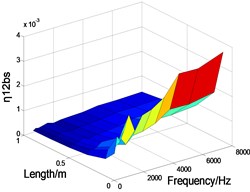
As shown in Fig. 6, the influence of side length on the CLF of three waveforms is given by wave method.
It can be seen that the CLF of bending wave decreases obviously with the increase of frequency, but the CLF of longitudinal and transverse wave increase obviously. In the whole frequency band, bending, longitudinal and transverse wave CLF decrease obviously with the increase of the side length. In the high frequency band, with the increase of the side length, the bending wave CLF varies very little, while the longitudinal and transverse wave CLF decrease significantly. This shows that with the frequency increases and the side length decreases, the energy stored in the longitudinal and transverse waves will increase. Therefore, if we use the FEM to calculate the bending wave CLF, the energy of the longitudinal and transverse waves can’t be simply equivalent to the energy of the bending wave. If not, a large error may be generated when calculating the bending CLF by FEM.
4.2. Influence of concentrated mass and boundary conditions on CLF
Engineering structures often contain a variety of connection forms and boundary conditions, and there are many additional concentrated masses on them. As we know, the influence of these factors on the low frequency vibration characteristics is obvious, while the impact on the high-frequency is not paid enough attention. As shown in Fig. 7, there are four 5 kg concentrated masses on the L-shaped plate, and the influence of the concentrated mass on the CLF is studied by FEM. As shown in Fig. 8, the influence of the concentrated mass on the CLF is obvious at low frequency band, and decreases with the increase of frequency. When the frequency is greater than 2500 Hz, the concentrated mass has little effect on the CLF. Therefore, the influence of concentrated mass can be neglected when using SEA to analyze the high frequency vibration response.
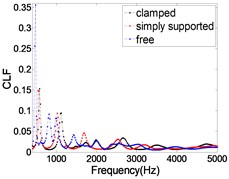
As shown in Fig. 9, the influence of three kinds of boundary conditions (clamped, simply supported and free) on the CLF is given. It can be seen that the influence of the boundary condition on the CLF is large at low frequency band and decreases with the increase of frequency. Because the L-shaped plate mainly displays the overall mode in the low frequency band, the different boundary conditions will affect the natural frequency and overall mode. While in the high frequency band, the L-shaped plate mainly displays local mode, so the influence of boundary conditions on CLF is relatively small.
Fig. 7L-shaped plate with concentrated mass
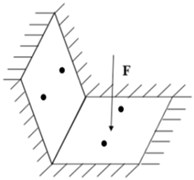
Fig. 8Effect of concentrated mass on CLF
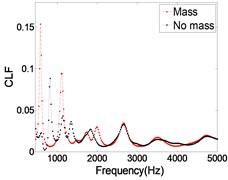
Fig. 9The CLFs calculated by different boundary conditions
4.3. Influence of ILF on CLF
ILF is a very important parameter when calculating the response of structure by FEM. The magnitude of ILF directly determines the magnitude of the vibration response of structure, and then will affect CLF. The variation of CLF under different ILF is calculated by FEM and compared with wave method.
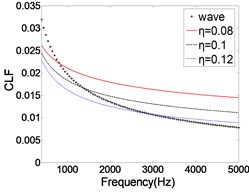
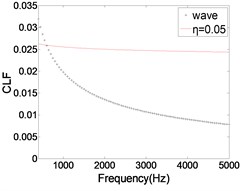
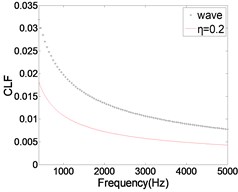
As shown in Fig. 10, the CLF decreases with the increase of ILF. The relative error of the two methods is gradually reduced, especially in the high frequency band. As we know, the modal overlap factor M increases with the increase of ILF. When M>2, the calculation result of CLF is more accurate. Therefore, with the ILF increases, the error of the CLF is gradually reduced. But when the ILF is very small (η=0.05), the results calculated by FEM are much larger than those calculated by wave method. The main reason is that one of the basic assumptions of SEA is weak coupling, that is, the CLF between the two coupled subsystems is significantly smaller than the ILF. In this context, the SEA can be applied. When ILF is very large (η=0.2), the calculated result is obviously smaller than that of wave method. The main reason is that the ILF is too large, resulting in almost all of the vibration energy dissipation, the energy transfer between subsystems was significantly weakened. Therefore, when using FEA to calculate CLF, on the one hand, ILF should be much larger than CLF, on the other hand ILF can't be unlimited increase. In this condition, the results of CLF have certain credibility.
Fig. 10The CLFs with different ILFs
5. Conclusions
The result of CLF is analyzed by FEM and wave method, it is found that, with the increase of the side length the results of CLF are more reliable. The energy of longitudinal and transverse wave increases sharply with the decrease of side length, the error of CLF will increase significantly when using FEM.
The influence of concentrated mass and boundary conditions on the vibration response of the L-shaped plate is obvious in the low frequency band, and the influence can be neglected in the high frequency band.
When CLF is calculated by FEM, on one hand, ILF should be much larger than CLF, on the other hand, ILF can’t be increased indefinitely. In this condition, the results of CLF have certain credibility.
References
-
Yao D. Y., Wang Q. Z. The Theory and Application of Statistical Energy Analysis. Beijing Institute of Technology Press, Beijing, 1995.
-
Ma X. R., Yu D. Y., et al. Research progress of environmental analysis and test technology of star-rock mechanics. Journal of Astronautics, Vol. 27, Issue 3, 2006, p. 323-331.
-
Langley R. S., Heron K. H. Elastic wave transmission through plate/beam junctions. Journal of Sound and Vibration, Vol. 143, Issue 2, 1990, p. 241-253.
-
Hopkins C. Experimental statistical energy analysis of coupled plates with wave conversion at the junction. Journal of Sound and Vibration, Vol. 322, Issues 1-2, 2009, p. 155-166.
-
Bies D. A., Hamid S. In situ, determination of loss and coupling loss factors by the power injection method. Journal of Sound and Vibration, Vol. 70, Issue 2, 1980, p. 187-204.
-
Shorter P. J., Mace B. R. Energy flow models from finite elements: an application to three coupled plates. Journal of Sound and Vibration, Vol. 233, 1998, p. 369-389.
-
Pankaj A. C., et al. A comparison of different methods for determination of coupling factor and velocity response of coupled plates. Journal of Vibroengineering, Vol. 15, Issue 4, 2013, p. 1885-1897.
-
Mao B. Y., Xie S. L., et al. Simulated and experimental studies on identification of impact load with the transient statistical energy analysis method. Mechanical Systems and Signal Processing, Vol. 46, Issue 2, 2014, p. 307-324.
-
Zhang J., Ma X. R., Han Z. Y., et al. Study on energy flow analysis based on finite element method. Journal of Vibration and Shock, Vol. 31, Issue 8, 2012, p. 47-51.
-
Simmons C. Structure-borne sound transmission through plate junctions and estimates of sea coupling loss factors using the finite element method. Journal of Sound and Vibration, Vol. 144, Issue 2, 1991, p. 215-227.
About this article
This work was supported by the Strategic Priority Research Program of the Chinese Academy of Sciences, Grant No. XDB22040502.
