Abstract
The acoustic field reconstruction using the statistical optimal near-field acoustic holography can avoid the winding error, but the finite aperture error cannot be avoided. In order to reduce the finite aperture error, the data extrapolation technique is used before the separation of the sound field. Numerical simulation shows that the method can effectively reduce the reconstruction error.
1. Introduction
The statistical optimal near-field acoustical holography algorithm can effectively avoid the winding error in the two-dimensional Fourier transform, and the precision of the reconstructed sound field is high [1-5]. At the same time, the acoustic field separation algorithm based on the statistical optimal near-field acoustic holography has been paid more and more attention [6, 7]. In order to effectively improve the effect of sound field reconstruction, this paper presents a statistical optimal near-field acousto-acoustic field separation technique based on wave-number domain extrapolation, and the effectiveness of the method is verified by numerical simulation.
2. Theoretical deduction
In the case of noise source interference, the holographic extrapolation technique is usually the first sound field separation, and then data extrapolation, this paper proposes the first data extrapolation, and then the sound field separation, and finally the use of statistical optimal near-field acoustic holography Principle of sound source reconstruction.
2.1. Holographic surface data extrapolation
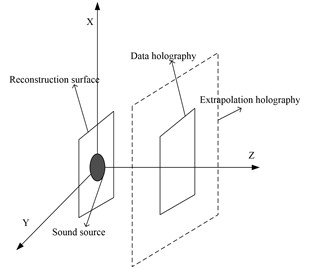
In the actual measurement, taking into account the cost of measurement and budget issues, holographic aperture is generally small, if the direct use of measured data for sound field separation and reconstruction of the sound source surface will bring a larger error, it is necessary to extrapolate the holographic data. With the holographic data extrapolation, we can extend the holographic aperture to the sound source surface more than 4 times, effectively reduce the error. The data extrapolation diagram is shown in Fig. 1.
The data extrapolation process is essentially a data smoothing process. The key to the success of data extrapolation is the design of the filter. The high-wavenumber components generated during the data extrapolation are filtered out and fitted to the enlarged aperture.
The specific steps are as follows:
Step 1: In the real space domain, the holographic surface data is zeroed according to the rule of Eq. (1):
Fig. 1The data extrapolation diagram
Step 2: The two-dimensional Fourier transform is performed and the results of the two-dimensional Fourier transform are low-pass filtered:
where the λα is a low pass filter. An improved regularization algorithm is used to determine the parameters of the low-pass filter:
Step 3: The inverse Fourier transform is performed:
Step 4: Holographic surface actual measurement data replacement:
Step 5: The first to fourth steps are repeated until the number of iterations is reached.
2.2. Sound field separation technology
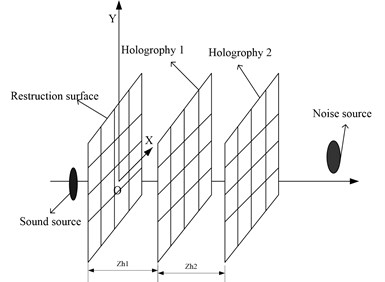
For a steady state single-frequency sound field, the sound pressures on the holographic surfaces 1 and 2 are p1(r) and p2(r'), respectively. Holographic sound pressure is generated by the sound source and noise source. Sound source in the holographic surface 1 produces a sound pressure of p11(r), the sound source in holographic surface 2 on the sound pressure is p12(r), according to the sound pressure can be superimposed principle, we can obtain:
Similarly, we can obtain:
According to the principle of the statistical optimal near-field acousto-optic holography, the weight coefficients of the plane waves and the sound field are independent of each other, the acoustic pressure p11(r) and p12(r) generated by the holographic surface can be solved. At the same time, the resulting sound pressure is p21(r') and p22(r'), and the sound field is separated.
2.3. Statistical optimal near-field acoustic holography
The princeple of the SONAH: in the free sound field, the wave field consists of plane waves, plane waves can be countless units of plane waves in a linear combination of said. which is:
According to the principle of wave superposition:
Eq. (8) establishes the relationship between the holographic sound pressure and sound source surface sound pressure. Eq. (7) is written in the form of a matrix:
According to the matrix theory combined with the regularization of the relevant knowledge can be solved:
where θ is a regularization parameter, which is determined according to the method of Document 3.
Fig. 2The diagram of sound field separation
3. Numerical simulation
The simulation uses the point source to simulate, and the spatial position relation between the point source, the noise source and the holographic surface is shown in Fig. 2. Sound source, noise sources are located on both sides of the holographic surface. The specific parameters are as follows: the source and the noise source distance 0.5 m, respectively, the radius of the sound source and interface sound source are 0.01 m, and their frequency are 1000 Hz, surface vibration velocity v= 0.5 m/s, holographic and reconstruction surface size of 1 m by 1 m. And the distance between the reconstruction surface and the sound source surface is 0.2 m and 0.1 m. The two holographic planes use 32×32 array elements. Fig. 3-6 shows the reconstructed sound field using the method proposed in this paper. Fig. 7-10 shows the theoretical sound pressure of the reconstruction surface.
Reconstruction error is defined as:
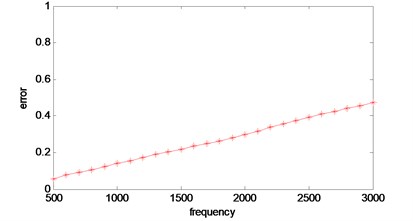
The error versus frequency curve is shown in Fig. 11.
Fig. 3Reconstructed surface acoustic pressure (a)
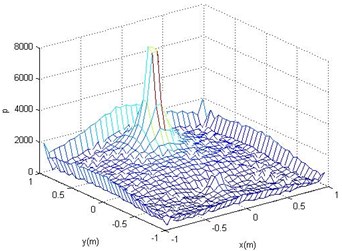
Fig. 4Reconstructed surface acoustic pressure (b)
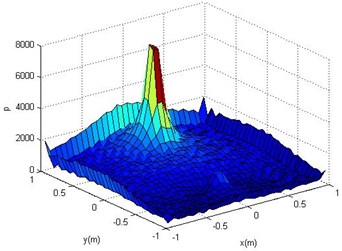
Fig. 5The clouds of the reconstructed Surface Sound Pressure (a)
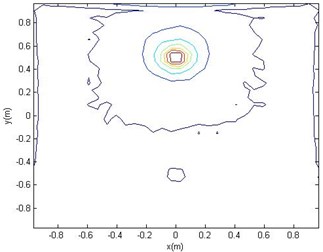
Fig. 6The clouds of the reconstructed Surface Sound Pressure (b)
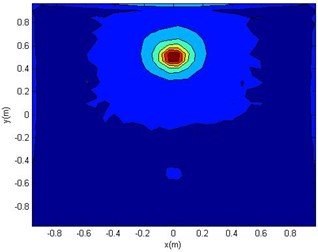
Fig. 7Reconstruction surface theory sound pressure (a)
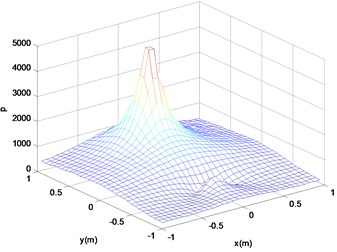
Fig. 8Reconstruction surface theory sound pressure (b)
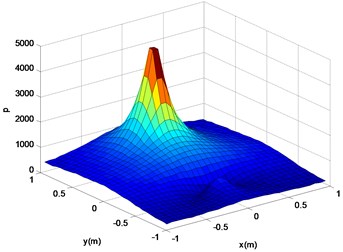
From the error curve, it can be seen that the error of reconstructed sound field is increasing with the vibration frequency of the sound source increasing. When the vibration frequency reaches 3000 Hz, the error has reached 50 %, which indicates the reconstruction failure. However, reconstruction at 3000 Hz is effective. The error varies with the vibration frequency, because the higher the vibration frequency is, the higher the wave component value is, and the more effective wave number filtered by the low-pass filter, the lower the pass-through point of the low-pass filter can reduce the error. The adaptive low-pass filter algorithm is the focus of the next step.
Fig. 9Reconstruction surface theory sound pressure cloud (a)
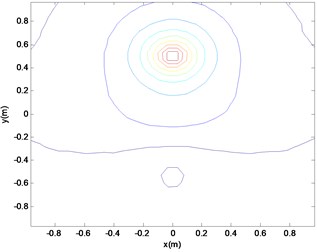
Fig. 10Reconstruction surface theory sound pressure cloud (a)
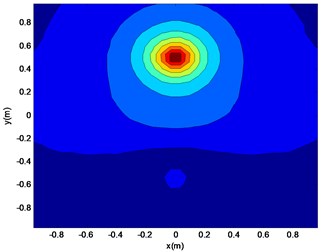
Fig. 11Error versus frequency curve
4. Conclusions
First, the holographic data is extrapolated, then the sound field on both sides of the holographic surface is separated. Finally, the sound field is reconstructed by using the principle of statistical optimal acoustic holography. The theoretical derivation shows the correctness of the method and the numerical simulation verifies the effectiveness of the method.
References
-
Du Xianghua, Zhu Haichao, Mao Rongfu, et al. Patch near-field acoustic holography based on support vector regression. Acta Acoustic, Vol. 37, Issue 3, 2012, p. 286-293.
-
Hald J. Patch near-field acoustical holography using a new statistically optimal method. Proceedings of Inter-noise, 2003, p. 2203-2210.
-
Li Weibing, Chen Jian, Yu Fei, et al. Study on statistically optimal cylindrical near-field acoustical holography. Chinese Journal of Mechanical Engineering, Vol. 41, Issue 4, 2005, p. 123-127.
-
Finn J., Virginie J. Statistically optimized near field acoustic holography using an array of pressure-velocity probes. Journal of Acoustical Society of America, Vol. 121, Issue 3, 2006, p. 1550-1558.
-
Finn J., Chen Xinyi A comparison of statistically optimized near field acoustic holography using single layer pressure-velocity measurements and using double layer pressure measurements. Journal of Acoustical Society of America, Vol. 123, Issue 4, 2008, p. 1842-1845.
-
Hald J. Basic theory and properties of statistically optimized near-field acoustical holography. Journal of Acoustical Society of America, Vol. 125, Issue 4, 2009, p. 2105-2120.
-
Jia W. Q., Chen J., Yang C., et al. Study of a sound field separation technique based on a single holographic surface and wave superposition method. Journal of Mechanical Engineering Science Part C, Vol. 223, 2009, p. 1827-1835.
