Abstract
Based on the theory of modal acoustic emission, this paper describes a new method to determine whether a plate made of a composite material has been damaged following external impact. Using modal acoustic emission theory, the relationship between the Lamb-wave mode of acoustic emission and the force direction in the plate was analyzed. This relationship was then verified using a lead-break experiment. The Lamb-wave mode of the acoustic emission signals produced by the damage in the plate was investigated, and the criterion for assessing the impact damage was proposed. During the impact experiments, the proposed criterion was employed to monitor the impact damage of the plate. The results indicate that it is feasible to use acoustic emission signals to directly determine whether an impact had caused damage to the plate.
1. Introduction
Due to their excellent mechanical properties, composite materials have been widely used in aircraft structures, pressure vessel shells, and pressure piping. Composite materials are very strong, durable, and relatively lightweight. However, it is difficult to avoid the impact of foreign objects during use. Although sometimes the impact energy is low, and there are no obvious visual defects on the structure surface, the impact may have caused damage such as matrix cracking, fiber breakage, and local internal delamination, which not only reduces service life but also leaves potential future risks in the structure [1-4]. The monitoring of impact damage has been in the spotlight of research for a long time, especially in the area of health monitoring of composite structures [5-13].
Davide Nardi et al. used the vibration signal of carbon-fiber reinforced composite plates to monitor impact damage. They obtained different output parameters for undamaged and damaged plate structures using the optimized auto-regression-model algorithm [7]. Marco A. Pérez et al. established the composite plate structure model based on the parameters obtained from the frequency response function. They determined the occurrence of impact damage and the damage degree by comparing the change of model parameters for the plate structure before and after impact damage [8]. F. Aymerich et al. diagnosed impact damage by using nonlinear features of acoustic waves. An ultrasonic wave is generated in the structure using actuator with the excitation frequency f1. The ultrasonic waves were measured through sensors. At the same time, the composite material structure is in the low-order vibration mode (for example the frequency f2 of the first bending mode). If there is no impact damage in the plate structure, the acquired ultrasonic frequency spectrum energy should concentrate at the excitation frequency f1, if there is damage, the acquired ultrasonic spectral energy will reduce relative to the incentive frequency and show frequency spectra at the frequency f1±nf2. The offset frequency spectrum energy correlates with the degree of damage [9]. S. Takeda et al. pasted a Bragg grating on the back face of the impact point of the composite material plate, which enables the monitoring of impact damage: internal damage of the plate causes a change in the frequency spectra [10]. In addition, the research team led by Prof. Yuan also did a lot of work on impact damage monitoring of composite material plate structures [11-13]. From the above literature, it can be seen that there are various methods to monitor the impact damage of composite material plate structures. However, research to determine impact damage by directly using the impact acoustic emission (AE) of composite plates has rarely been reported. Compared with other monitoring methods, this method is better compatible with online monitoring and real-time damage diagnosis.
In this paper, modal acoustic emission was used to analyze the impact damage of a composite plate structure. A method that can directly determine the impact damage of the composite plate structure, using impact acoustic emission, is put forward. Firstly, based on the theory of modal acoustic emission, this article shows the relationship between the Lamb-wave mode of acoustic emission and the force direction in the plate. We further verified the relationship with an experiment. Then, the characteristics of acoustic emission in the plate under impact and damage were studied. It was proposed that the damage acoustic emission signal could be directly extracted from the impact acoustic emission to determine the impact damage, which was also verified by experiment. Finally, our proposed method to assess impact-damage was used to monitor the impact damage of the composite plate structure. In addition, the acoustic emission source, which was located by the damage signal geometric method, was compared with the real damage location.
2. Modal acoustic emission in the plate
Modal acoustic emission makes it possible to study the characteristics of acoustic emission signals in a plate structure using Lamb-wave theory. One can then attribute acoustic emission to a specific physical process [14]. Plate structures, such as wings, composite rudder surfaces, pressure-vessel shells, etc., are widely used in engineering. Their thicknesses are far smaller than the plate, in which the stress wave propagates as a Lamb-wave. The acoustic emission frequency-band in the plate occurs predominantly in the range of hundreds of kilohertz. In other words, the wavelength is much longer than the plate thickness, and the corresponding frequency-thickness product is significantly smaller than 1 (units: MHz×mm). Lamb-wave theory suggests that when the frequency-thickness product is below 1, both isotropic and anisotropic plate structures are of the lowest-order mode in the plate, namely the zero-order symmetric mode S0, and the zero-order asymmetric mode A0 [14-16]. Therefore, based on the theory of modal acoustic emission, the acoustic emission in the plate only needs to consider the S0 mode and the A0 mode of the Lamb-wave.
2.1. Lamb-wave modal analysis of the acoustic emission in the plate
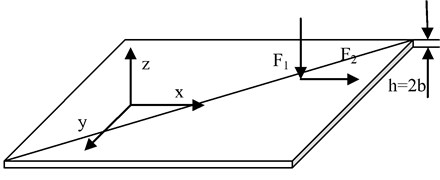
Acoustic emission is a transient stress wave produced by the rapid release of energy due to a local stress concentration in the material, such as deformation and fracture. When a foreign object hits the plate structure, any local deformation and fracture in the impacted region can produce acoustic emission. The transformation of the kinetic energy of objects to stress waves becomes possible thanks to the effect of the force. The force can be simplified as one component force vertical to the plate surface (F1) and the other parallel to the plate surface (F2), as shown in Fig. 1. Here, the plate thickness h is set as h=2b. First, we will analyze the acoustic emission wave velocity in the plate produced by the force vertical to the plate surface (F1).
Fig. 1Schematic of applied force on the plate surface
The equilibrium equation of the plate can be simplified as follows:
where is the bending strength of the plate; is the force vertical to the plate surface; is the displacement of the plate surface under the action of the force; is the Young modulus; and is the Poisson ratio. If the expression is written as the product of acceleration and the mass of unit area , namely:
Then substituting Eq. (2) into Eq. (1) yields:
We assume , where is a constant, and is the wavelength. For a one-dimensional problem, . From Eq. (3), we obtain:
where . Substituting into Eq. (4) and rearranging it yields:
Thus, the wave velocity of the bending wave can be expressed as:
Now we will analyze the acoustic emission-wave velocity when the force is parallel to the plate surface. At this moment, the directions of the wave include the wave propagation that is consistent with the direction of particle displacement in the -axis direction and the direction of particle displacement in the -direction, which is vertical to the wave propagation direction (-direction). The equations of motion for these two waves are:
If we ignore the coupling relationship between them, we obtain:
Thus, we can determine the velocity of the spreading wave propagating in the -axis direction:
Then, we can obtain the velocity of the shear wave (SH wave) propagating in the -axis direction:
The SH wave should not be ignored only in thick plates. It has no frequency dispersion, and mainly occurs in the high frequency range above 100 kHz. The SH wave does not participate in the mode transformation of the plates, and its influence can be ignored in the study of the Lamb-wave in thin plates [15, 16].
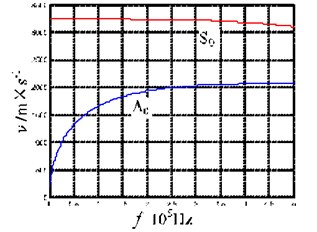
The above derivation indicates that both spreading wave (Eq. (11)) and bending wave (Eq. (6)) for the acoustic emission are triggered by the impact of foreign object. Eq. (11) shows that the spreading wave velocity has nothing to do with the frequency, and no dispersion curves are obtained. Eq. (6) shows that the bending wave velocity depends on the frequency (angular frequency ), and that a frequency dispersion effect can be observed. In the mode, cutoff range for the Lamb-wave, only the lowest-order modes and exist. The velocity of the mode varies little with the increase of frequency. Hence, it can be viewed as a constant value. By contrast, the velocity of the mode increases for increasing frequencies, and there is a frequency dispersion effect. Here, we use the epoxy glass-fiber plate as an example to analyze this problem. Fig. 2 shows the Lamb-wave mode and theoretical group velocity in the mode cutoff interval calculated according to Table 1. It can be seen that the results are consistent with the mode cutoff interval in the Lamb-wave theory. Therefore, it can be concluded that when the direction of the force is perpendicular to the plate surface, the excited acoustic emission is a bending wave, which is also the mode of the Lamb-wave. When the direction of the force is parallel to the plate surface, the excited acoustic emission is a spreading wave, which is also the mode of the Lamb-wave.
Table 1Material parameters of the epoxy glass-fiber plate
Parameter | Young modulus (GPa) | Shear modulus (GPa) | Possion’s ratio | Density (kg.m-3) |
Value | 20 | 8.7 | 0.17 | 1960 |
Fig. 2Lamb-wave group velocity for the epoxy glass-fiber plate for a low frequency-thickness product
2.2. Experimental verification of the acoustic emission Lamb-wave mode
In the previous section, Lamb-wave modes in the plate that corresponded with the acoustic emission produced by the applied force in different directions were investigated and obtained. In this section, a verification experiment is conducted to verify that conclusion. Here, an epoxy glass-fiber plate of 2 mm thickness is used for the experiment. The acoustic emission sensors are three piezoelectric ceramic transducers (PZTs), which are arranged in a straight line with an interval of 47 mm. Lead break is used as the excitation source of the acoustic emission. Lead break on the plate surface is used to simulate the action of the force vertical to the plate surface, and the plate end-face is used to simulate the action of the force parallel to the plate surface. Here, the plate side face near Sensor 1 is set as the end-face for the lead break. In order to ensure the consistency of the propagation distances in the secondary acoustic emission, the lead break point is set as the intersection of plate surface and plate side face, and the lead break point is on the same straight line with the three sensors. Fig. 3(a) shows a photograph of experimental setup.
Fig. 3Lead-break acoustic emission experiments and time-frequency analysis at the end-face and upper surface of the plate
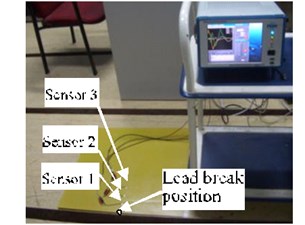
a) Set-up diagram for the lead-break experiment on the top surface and end-face of the epoxy glass-fiber plate
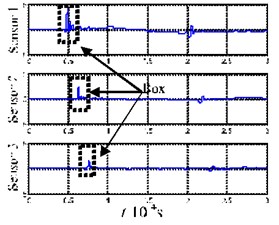
b) Lead-break acoustic emission at the end-face of the plate
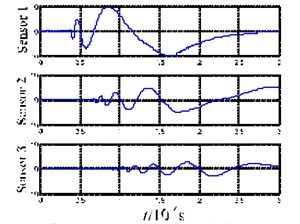
c) Lead-break acoustic emission at the upper surface of the plate
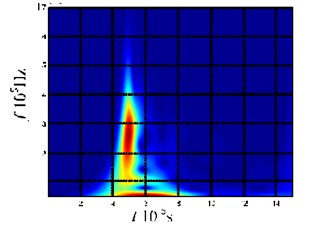
d) Time-frequency analysis of the lead break acoustic emission at the end-face of the plate
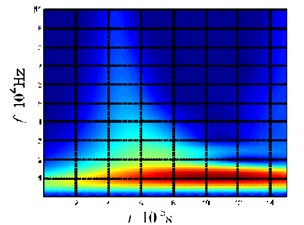
e) Time-frequency analysis of the lead break acoustic emission at the upper surface of the plate
Fig. 3(b) shows the acoustic emission signals received by the three sensors after the lead break on the plate end-face. For all the three sensing signals, there is an obvious wideband wave packet similar to an impulse signal (marked by the box in the figure). The wave packet shows amplitude attenuation during the propagation process, but the waveform remains almost unchanged. Using the sensing signal from Sensor 1, time-frequency analysis is carried out on the wave packet (the first 1500 points of the signal), as shown in Fig. 3(d). The main frequency components of the wave packet are between 100 and 400 kHz, within the mode cutoff range of the Lamb-wave (as shown in Fig. 2). The waveform of the wave packet remains unchanged during the propagation process, which also indicates that the propagation velocities of the components with different frequencies are consistent with each other. This result agrees well with the feature description for the spreading waves described in Eq. (11). It is also consistent with the characteristics of the mode velocity in the mode cutoff range that does almost not change with frequency. Taking the extremum points (48.8 μs, 62.5 μs and 76.0 μs) of the waveforms of the three sensor signals as the reference points, we can calculate the velocities for the wave packet respectively as: 3431 m/s and 3481 m/s, which are close to the wave velocity of in Fig. 2. Hence, we can conclude that this wave packet is the mode of the Lamb-wave. The experimental results are also consistent with the conclusions from the theoretical analysis, namely that the acoustic emission produced by the force parallel to the plate surface is the mode of the Lamb-wave.
Fig. 3(c) shows the acoustic emission signals received by the three sensors after the lead break on the plate top surface. Although the lead break is a transient process, the wave packet of the acoustic emission gradually expands and elongates with increasing propagation distance. Taking the sensor signal from Sensor 1, time-frequency analysis was carried out on the wave packet (the first 1500 points of the signal), as shown in Fig. 3(e). The main frequency components of the wave packet are between 20 and 5 kHz, within the mode cutoff range of the Lamb-wave (as shown in Fig. 2). Through a comparison of the waveforms received by the three sensors, it can be found that, in addition to amplitude attenuation, the waveforms gradually unfold on the time axis, and the velocity of the high-frequency components is greater than that of the low-frequency components. This result is in line with the expression for a bending wave in Eq. (6). More specifically, the wave velocity is related to the frequency and the propagation velocity at high frequencies is greater than that at low frequencies. In addition, this result is also consistent with the fact that the group velocity of the mode shows frequency dispersion in the mode cutoff range of the Lamb-wave. Hence, we can conclude that this wave packet is the mode of the Lamb-wave. The experimental results are also consistent with the conclusions from the theoretical analysis, namely that the acoustic emission caused by the force vertical to the plate surface is the mode of the Lamb-wave.
The above theoretical analysis and experimental results show that the waveform characteristics of the acoustic emission in thin plates can be explained by the and modes of a Lamb-wave. Then, according to the relationship between the and modes of the acoustic emission and the direction of the produced forces, the force direction of the plate can be deduced. This is the basis for determining whether the plate has been damaged or not, based on the acoustic emission method.
3. Investigation of the acoustic emission Lamb-wave mode of the composite plate
When the plate structure is hit by foreign objects, it can be damaged most likely only when the impact direction is vertical to the plate surface. Whereas the impact parallel to the plate surface does not depend on energy absorption and deformation of the plate structure. In view of this, this article only considers the impact vertical to the plate surface. When the impact energy is large enough, in other words, beyond the bearing limits of the composite material plate, it can produce various damage states, including matrix cracking, fiber fracturing, delamination, etc.
3.1. Investigation of the impact acoustic emission
From the analysis of the relationship between the direction of the force and the Lamb-wave modes of acoustic emission signals in Section 2, we know that when a foreign object hits the plate in the direction vertical to the plate surface, the action of the force between the foreign object and the plate surface is vertical to the contact surface. At this moment, the produced acoustic emission signal is the mode of the Lamb-wave. In the experiment, an epoxy glass-fiber plate of 2 mm thickness is studied because it can be approximately regarded as an isotropic material. The experimental setup is shown in Fig. 3(a), and an impact pestle used to vertically hit the plate structure. The impact point is about 30 cm from Sensor 3, and lies on the same straight line with the three sensors. The recorded signals are shown in Fig. 4.
For the waveform in Fig. 4(a), the high frequency wave velocity is greater than the low frequency wave velocity in the time domain, which is consistent with the characteristics of the mode. But when the plate is hit by the impact pestle, the contact between them can be classified as a surface contact that covers a certain area. In other words, more than one source can cause acoustic emission. In this case, the waveform of the impact acoustic emission is more complex than that of the single acoustic emission source. Nevertheless, the acoustic emission signals are dominated by the mode overall, and the waveform shows frequency dispersion.
Although this paper considers mainly the impact vertical to the plate surface, if there is a certain angle between the impact direction and the vertical direction, the acoustic emission produced by the force parallel to the direction of the plate surface belongs to the mode of the Lamb-wave. From Eqs. (6) and (11) and Fig. 2, we can see that, for the cutoff mode, the wave velocity of the mode is much greater than that of the mode. It is noticed that the acoustic emission signals corresponding to these two modes are produced almost simultaneously. As a result, in the time domain, the wave packets of the two modes will not overlap together, and the wave packet of the mode is ahead of that of the mode. This can be seen in Fig. 4(a). Since the impact of the impact pestle is not strictly vertical to the plate surface, the wave packet of mode can be observed in the prior 1200 data points in Fig. 4(a), see Fig. 4(b). This wave packet maintains an unchanged waveform during the entire propagation process. By taking the minimum values as reference points (54 μs, 67.4 μs and 81.8 μs), the average velocity of this wave packet can be determined as 3400 m/s. Clearly, this wave packet is consistent with the mode. By comparing Fig. 5(a) and Fig. 5(b), it can be deduced that the horizontal component of the impact force is much smaller than the vertical component, which is consistent with the vertical degree for the actual impact.
Fig. 4Acoustic emission signals of the epoxy glass-fiber plate hit by the impact pestle
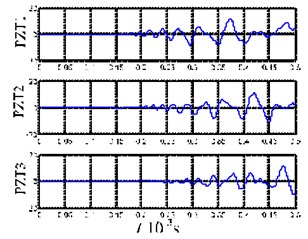
a) Acoustic emission signals received by the three sensors
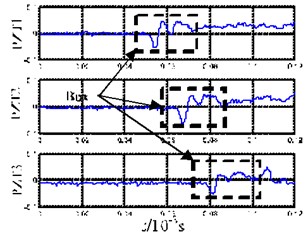
b) Locally enlarged picture of the first 1200 points of the acoustic emission
3.2. Investigation of the damage acoustic emission
Since this article uses mainly the impact acoustic emission signals to determine whether a composite plate has been damaged after impact, it is necessary to conduct relevant experiments to study the acoustic emission Lamb-wave mode produced by the damage in the plate. However, it is very difficult to obtain the acoustic emission signal generated by the damage from the direct impact of foreign objects on the plate structure. Because the acoustic emission energy produced by the impact is far greater than that produced by the plate damage, it is impossible to observe the acoustic emission signal generated by the damage using the sensing signals. Considering the impact damage is due to excessive deformation beyond the bearing limit of the plate because of the absorption of impact energy, we applied the force slowly to the plate structure. We also ensured the deformation of the plate exceeded the limit of the plate to cause the damage of the plate. Since the force was loaded on the plate slowly and gradually, the produced acoustic emission was not similar to that produced by a foreign object. At this moment, the acoustic emission received by the sensor was only the signal produced by the damage. The damage in this experiment and the impact damage were both caused by excessive deformation of the plate structure beyond the bearing limit of the plate. Hence, the acoustic emissions generated by them can be seen as equivalent.
Fig. 5 illustrates the sensor layout and force region on the plate in the experiment. The signals received by the sensors are shown in Fig. 5(b). Here, we use the periods between 0.18 and 0.6 ms to conduct the time-frequency analysis. The results are shown in Figs. 5(c) and 5(d). From the time-frequency analysis, we know that the waveform in Box 1 of Fig. 5(b) belongs to a wideband, and that the frequency mainly concentrates in the range from 100 to 250 kHz, within the mode cutoff range of the Lamb-wave. After propagating for a certain distance, the waveform shows no dispersion. If we take the maximum value in Box 1 (the corresponding time point is 199.1 μs) and that in Box 2 (the corresponding time point is 224.8 μs) as the reference points, respectively, we find that the velocity of the wave packet is about 3890 m/s. This velocity is much greater than the wave velocity of the mode, and close to that of the mode. Hence, the wave packet in Box 1 should belong to the mode. From Figs. 5(c) and 5(d), we know that, during the propagation process of the waveform in Box 2 of Fig. 5(b), the high frequency velocity is higher than the low frequency velocity, and the waveform shows dispersion. The frequency occurs mainly below 100 kHz, within the mode cutoff range of the Lamb-wave. Hence, the wave packet in Box 2 should belong to the mode.
Fig. 5Force experiment and time-frequency analysis diagram for the acoustic emission caused by the damage of the epoxy-glass-fiber plate
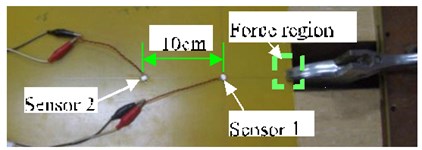
a) Sensor layout and force region for the epoxy glass plate
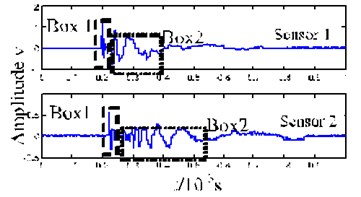
b) Acoustic emission signals caused by the damage
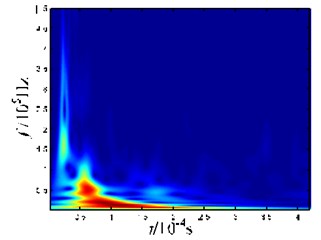
c) Time-frequency diagram for the wave packet captured by Sensor 1
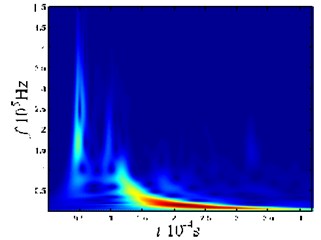
d) Time-frequency diagram for the wave packet captured by Sensor 2
The above analysis indicates that, when the plate structure is hit by a foreign object, the acoustic emission produced by the damage may include both the mode and the mode. The damage to the composite material plate includes matrix cracking, fiber fracturing, and delamination. Matrix cracking is usually accompanied with the action of forces in vertical and parallel directions, and it can produce the acoustic emission of both mode and mode. Fiber fracture is mainly accompanied with the action of the horizontal force, and it can produce the acoustic emission of the mode. Delamination is mainly accompanied with the action of the vertical force, and it can excite the acoustic emission of the mode [15]. In general, for the high-speed impact of foreign objects, the above damage states occur simultaneously, while the chance for a single damage is very small. Therefore, the fact that the acoustic emission signals in the experiment contain two modes is consistent with the actual situation.
3.3. Investigation of the damage-signal features
From the above analysis, we know that under the same action of force, there is no obvious difference in the acoustic emissions produced by external impact and the damage in terms of Lamb-wave mode. In this paper, according to the characteristics of mode and mode, we arrive at the following three conclusions, and we propose to take the acoustic emission of the mode produced by the damage as a token to distinguish the two kinds of acoustic emission generation sources.
a) From Section 3.1, we know that the wave packets of the mode and the mode generated by the impact are independent of each other during the propagation process. In addition, the wave packet velocity of the mode is far lower than that of the mode. Hence, in the case of no impact damage, even though the impact is not strictly vertical to the plate surface, it is impossible to overlap the wave packet of the mode in the sensing signals of the acoustic emission mode.
b) If we analyze the impact damage of the plate with respect to energy absorption, the damage is caused by the impact vertical to the plate surface because the plate structure cannot easily absorb the kinetic energy parallel to the plate surface. If impact damage occurs in the plate, the acoustic emission produced by the damage should be accompanied by the acoustic emission signal of the mode that is produced by the impact force. In other words, the acoustic emissions of the mode and the mode by the damage overlap in the acoustic emission of mode produced by the impact.
c) In the mode cutoff range of Lamb-wave, there is almost no frequency dispersion for the mode, and its waveform is close to the transience during the acoustic emission process. This is why the mode wave-packet of the acoustic emission has high-frequency components relative to the mode wave packet, as shown in Figs. 4(b), 4(c) and 5(b). With the help of appropriate signal processing methods, the mode wave packet with a relatively high frequency, which represents the damage, can be extracted from the mode signals of the acoustic emission produced by the impact. This makes it possible to assess whether the impact causes damage or not.
Here, we conducted impact experiments to verify the impact damage assessment method proposed in this paper. For the first time, we used an impact pestle to hit the composite plate, and there was no impact damage due to the low energy. For the second time, we used a pendulum to hit the composite plate, and the energy was large enough to cause impact damage. The impact points of these two impact experiments were in the same straight line with the three sensors, and the distance between the sensors was 47 mm. The experimental setup and the collected impact acoustic emission signals are shown in Fig. 6. In this paper, signal processing was carried out using empirical mode decomposition (EMD). The decomposing signals by EMD do not require selecting decomposition bases, and they can directly decompose signals adaptively and autonomously in time domain, which is suitable for the processing of non-stationary signals [17-22].
The waveforms in Fig. 6(b) and 6(c) display frequency dispersion, and are dominated by the mode. Although the pendulum impact caused damage to the plate structure, the corresponding waveform shows no significant difference relative to the impact acoustic emission produced by the impact pestle. Here, EMD was used to decompose the signals received by Sensor 1, and the results are shown in Fig. 6.
The first six orders of intrinsic mode function (IMF) were used for analysis. Fig. 7(a) shows the decomposition result of the acoustic emission signal produced by the impact pestle. In Fig. 7(a), the first-order IMF (IMF1) is primarily the noise, and the wave packets that appear successively in IMF2-IMF6 show frequency dispersion (as marked in Fig. 7(a)), the characteristic of signal decomposition mainly appears as a mode. Fig. 7(b) shows the decomposition result of the acoustic emission signal produced by the pendulum. In Fig. 7(b), the first-order IMF (IMF1) is primarily the noise, and the wave packets in IMF2 to IMF6 are consistent with the characteristic of frequency dispersion (as marked in Fig. 7(b)). However, relatively high frequency signals occur in IMF2 and IMF3 for the pendulum acoustic emission. Such high frequency signals also appear in the EMD decomposition results of the signals received by Sensor 2 and Sensor 3. To further analyze the high frequency signals obtained from decomposing the pendulum impact signals, we merged these IMFs containing high frequency signals that are obtained from decomposing the three sensing signals, see Fig. 8. The merged signals have multiple wave packets. Considering that the wave packets with later arrival time are easily affected by the end-face reflection, the first two wave packets, which arrive at the sensors earliest, are selected as the research subject. Taking their maximum values as the time reference points (as marked in Figs. 8(a), 8(b) and 8(c)), the time intervals for the first two wave packets that arrive at the three sensors first are 841, 843, and 842 (unit: 10-7 s), respectively.
Fig. 6Experimental setup for the impact experiments and the corresponding acoustic emission signals of the epoxy glass-fiber plate
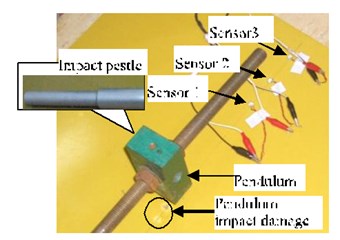
a) Experimental setup for the impact experiment with the epoxy glass-fiber plate
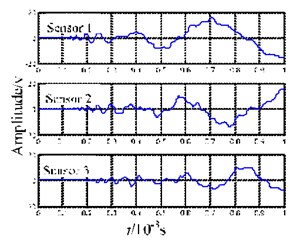
b) Impact signals of impact pestle
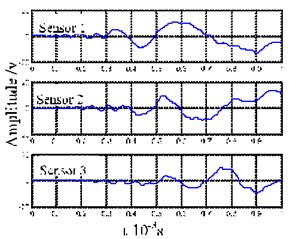
c) Impact signals of pendulum
These results show that the two wave packets have almost equal velocities. The velocity remains unchanged during the propagation process, and the wave velocity can be determined to be at around 3500 m/s. Then, we take the signals for the periods between 0.3 and 0.8 ms in Fig. 8(a) for a time-frequency analysis. The results are shown in Fig. 8(d). As can be seen, the frequencies of wave packets in the signals are in mode cutoff range of the Lamb-wave, and no frequency dispersion occurs during the propagation process. The above characteristics confirm that the two wave packets belong to mode.
The experimental results show that the mode wave packets of the acoustic emission produced by the damage can be overlapped in the mode of the acoustic emission signals produced by the impact only when the impact has caused damage to the plate structure. Therefore, whether mode wave packets can or cannot be extracted from the impact acoustic emission signals can be used as the criterion to determine the occurrence of impact damage.
Fig. 7The first six orders of IMFs by EMD decomposition for impact pestle signals and pendulum signals
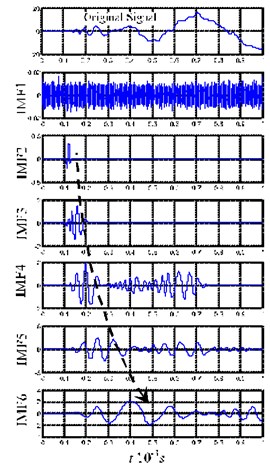
a) The first six orders of IMFs by EMD
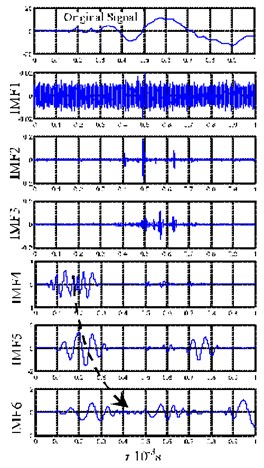
b) The first six orders of IMFs by EMD
Fig. 8Merged signals of IMF2 and IMF3 from EMD decomposition and local time-frequency diagram for the merged signals
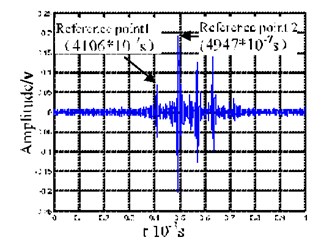
a) Sum of IMF2 and IMF3 for signals received by Sensor 1
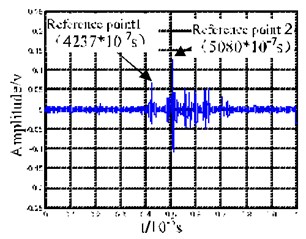
b) Sum of IMF2 and IMF3 for signals received by Sensor 2
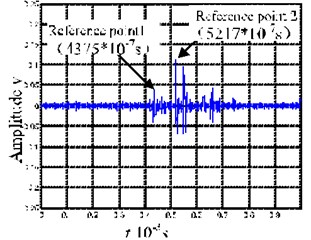
c) Sum of IMF2 and IMF3 for signals received by Sensor 3
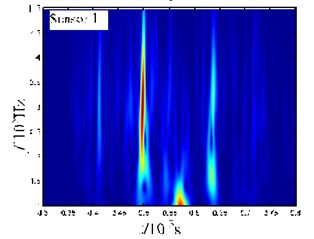
d) Time-frequency diagram for the period from 0.3 to 0.8 ms
4. Application of modal acoustic emission
In this section, we describe experiments to apply the impact damage judgment method proposed using modal acoustic emission to the health monitoring of a composite material plate. We used an epoxy glass-fiber plate of ~1000 mm width and ~1000 mm length as the subject of this study. Three piezoelectric patches were pasted on the plate surface. Their coordinates are (300 mm, 400 mm), (500 mm, 600 mm) and (70 mm, 400 mm), respectively. A pendulum was used to hit the plate, and the acoustic emission signal of each impact was collected by the acquisition system. Fig. 9(a) shows a photograph of the experimental apparatus, and the impact positions of the four pendulums are marked as shown in Fig. 10.
Fig. 9Impact acoustic emission signals and the corresponding EMD decomposition results of the epoxy plate
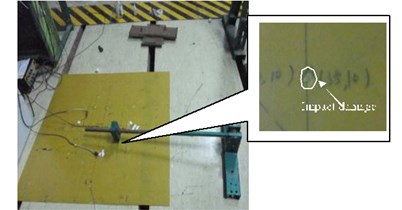
a) Setup for the impact experiment with the epoxy plate
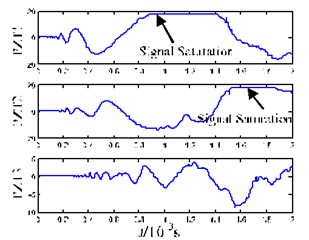
b) Impact acoustic emission signals of the epoxy plate
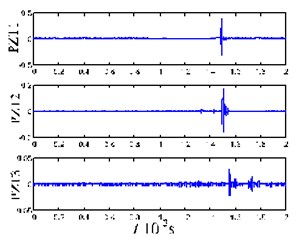
c) mode wave packets obtained from EMD decomposition of the acoustic emission signals
Fig. 10Impact location schematic of the pendulum at four positions
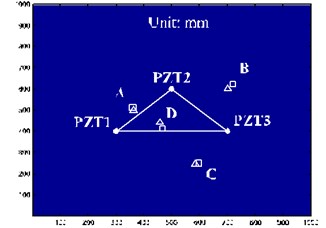
Fig. 9(b) shows that the sensing signals after position A are affected by the pendulum. It can be seen that there is a signal overload phenomenon. This is because the impact positions should be close to certain sensors in order to ensure that every sensor can receive the acoustic emission signals of the impact. In order to prevent EMD false decomposition due to signal overload, we introduced the processing method of reducing mode overlapping during EMD decomposition [23]. Fig. 9(c) shows the mode wave packets decomposed from the acoustic emission signals after Position A was hit. We used the maximum values of the wavelet packets as reference points, using the hyperbola method as location algorithm, and setting the velocity as 3500 m/s, the mode acoustic emission source was located. Then, the same processing procedure was conducted on the impact acoustic emission signals at the other three impact positions. Fig. 10 shows the results, in which “△” denotes the four impact positions, and “□” denotes the emission source location of the mode wave packets. Table 2 shows the comparison results of the impact coordinates and damage location coordinates.
Table 2Actual coordinates for the impact positions and the damage location
Impact position | Impact coordinates (△). Unit: mm | Damage location coordinates (□). Unit: mm |
A | (360, 510) | (363, 498) |
B | (700, 600) | (721, 623) |
C | (600, 250) | (583, 246) |
D | (460, 440) | (466, 414) |
5. Conclusions
In this paper, the respective characteristics of impact and damage acoustic emission signals in the plate structure were analyzed using modal acoustic emission theory. A method of assessing the damage directly using the impact signals was proposed and used to monitor the impact damage in plate structures. This enabled the assessment of the impact damage. Compared to nondestructive testing and active monitoring on plate structures, our proposed method has the advantage of real-time capability. However, it should be noted that since the velocity of the mode is greater than that of mode, assuming the monitoring is beyond a certain scope, it may be impossible to extract the mode of the impact acoustic emission from the impact acoustic emission of foreign objects, even if the damage occurs. The monitoring scope, however, relates not only to the velocity difference, but also to the time difference between impact and the occurring damage.
References
-
Zhong Yongteng, Yuan Shenfang MUSIC algorithm based impact localization in the near-field of composite structure. Acta Materiae Compositae Sinica, Vol. 30, Issue 2, 2013, p. 189-194.
-
Li Shizhe, Chen Yan, et al. Contact force and indentation characteristics due to low velocity impact of composite wing-box panel and their simulations. Acta Materiae Compositae Sinica, Vol. 33, Issue 1, 2016, p. 204-212.
-
Feng Yongming, Zhou Li, Li Zhen Research on honeycomb sandwich composite structure damage detection based on matching pursuit method. Chinese Journal of Scientific Instrument, Vol. 33, Issue 4, 2012, p. 836-842.
-
Garnier Christian, Pastor Marie-Laetitia, Lorrain Bernard, et al. Fatigue behavior of impacted composite structures. Composite Structures, Vol. 100, 2013, p. 443-450.
-
Gaudenzi P., Bernabei M., Dati E., et al. On the evaluation of impact damage on composite materials by comparing different NDI techniques. Composite Structures, Vol. 118, 2014, p. 257-266.
-
Wang Yishou, Qing Xinlin Progress on study of structural health monitoring technology for composite joints. Acta Materiae Compositae Sinica, Vol. 33, Issue 1, 2016, p. 1-16.
-
Nardi D., Lampani L., Pasquali M., et al. Detection of low velocity impact-induced delaminations in composite laminates using Auto-Regressive models. Composite Structures, Vol. 151, 2016, p. 108-113.
-
Pérez M., Gil L., Oller S. Impact damage identification in composite laminates using vibration testing. Composite Structures, Vol. 108, 2014, p. 267-276.
-
Aymerich F., Staszewski W. J. Impact damage detection in composite laminates using nonlinear acoustics. Composite: Part A, Vol. 41, 2010, p. 1084-1092.
-
Takeda S., Aoki Y., Ishikawa T., et al. Structural health monitoring of composite wing structure during durability test. Composite Structures, Vol. 79, 2007, p. 134-138.
-
Yuan Shenfang, Liu Peipei, Qiu Lei A miniaturized composite impact monitor and its evaluation research. Sensors and Actuators A: Physical, Vol. 184, 2012, p. 182-192.
-
Liang Dong, Yuan Shenfang, Liu Menglong Distributed coordination algorithm for impact location of preciseness and real-time on composite structures. Measurement, Vol. 46, 2013, p. 527-536.
-
Qiu Lei, Liu Bin, Yuan Shenfang, et al. Impact imaging of aircraft composite structure based on a model-independent spatial-wavenumber filtered. Ultrasonics, Vol. 64, 2016, p. 10-24.
-
Gorman Michael R. Plate eave acoustic emission. Acoustical Society of America, Vol. 90, Issue 1, 1991, p. 358-364.
-
Liu Zhenqing Ultrasonic lamb waves in nondestructive testing. NDT, Vol. 21, Issue 9, 1999, p. 409-413.
-
Geng Rongsheng, Shen Gongtian, Liu Shifeng A study on modal acoustic emission theory. NDT, Vol. 24, Issue 7, 2002, p. 302-306.
-
Huang N. E., Shen Z., Long S. R., et al. The empirical mode decomposition and Hilbert spectrum for nonlinear and non-station time series and non-stationary time series analysis. Proceedings of Royal Society of London A, Vol. 454, 1998, p. 903-995.
-
Pan Zhaoqing, Zhang Yun, Kwong Sam Efficient motion and disparity estimation optimization for low complexity multi view video coding. IEEE Transactions on Broadcasting, Vol. 61, Issue 2, 2015, p. 166-176.
-
Yuan Chengsheng, Sun Xingming, Rui L. V. Fingerprint liveness detection based on multi-scale LPQ and PCA. China Communications, Vol. 13, Issue 7, 2016, p. 60-65.
-
Xia Zhihua, Wang Xinhui, Sun Xingming, et al. Steganalysis of LSB matching using differences between nonadjacent pixels. Multimedia Tools and Applications, Vol. 75, Issue 4, 2016, p. 1947-1962.
-
Zheng Yuhui, Jeon Byeungwoo, Xu Danhua, et al. Image segmentation by generalized hierarchical fuzzy C-means algorithm. Journal of Intelligent and Fuzzy Systems, Vol. 28, Issue 2, 2015, p. 961-973.
-
Wen Xuezhi, Shao Ling, Xue Yu, et al. A rapid learning algorithm for vehicle classification. Information Sciences, Vol. 295, Issue 1, 2015, p. 395-406.
-
Deering R., Kaiser J. F. The use of masking signal to improve empirical mode decomposition. Proceedings of IEEE International Conference on Acoustics, Speech Signal Processing, Vol. 4, 2005, p. 485-488.
Cited by
About this article
This work is supported by Natural Science Research Foundation of Jiangsu Provincial Universities (Grant No. 15KJB460011), the Nanjing Institute of Technology Foundation (Grant No. ZKJ201310), and the Opening Project of Jiangsu Key Laboratory of Advanced Numerical Control Technology (Grant No. SYKJ201603).

