Abstract
The mechanical vibration source signal collected by sensor often includes a variety of internal vibration source of contributions such as gears, bearings, shaft and so on. It is often hoped to achieve effective separation of the source signal in order to obtain better fault diagnosis result. Blind source separation of the failure signal of rolling element bearing is a challenging task due to the above reasons, especially in the case of single channel compound fault. A method of blind source separation of rolling element bearing’s single channel compound fault based on Shift-Invariant Sparse Coding (SISC) is proposed in the paper. The waveform characteristic of different fault signal has some difference in the structure even that the same impulse characteristics of signals are produced by different parts, and the difference can be captured by the SISC method with the following reasons: Firstly, a set of basis functions is trained and obtained by SISC feature self-study method (The number of the basis functions is big necessarily). Then the potential components are constructed using the corresponding obtained basis functions. At last, the clustering operation is carried out using the structural similarity of the potential components, and the clustering signals represent the different vibration source signals. Apply the traditional vibration signal handling method such as envelope demodulation to the obtained clustering signals respectively and better fault diagnosis results are obtained at last.
1. Introduction
The rolling element bearing is the most widely used part in the rotating machinery. It is necessary to study the effective fault feature method of rolling element bearing to avoid catastrophic accident due to the failure of it. The Fast Fourier Transform (FFT) and envelope demodulation (ED) were the two traditional and classic methods to extract the fault features of rolling element bearing. However, the above two mentioned methods would not work effectively because the fault vibration signal of rolling element bearing is becoming more and more complex with the increasing complexity of rotating machinery. In recent decades, though several useful techniques such as Spectral kurtosis (SK) [1], Wavelet transform (WT) [2], Minimum entropy deconvolution (MED) [3, 4], Cyclostationary analysis [5, 6] and so on have been proposed for feature extraction of rolling element bearing, most of them are only effective for the single defect of rolling element bearing. Compound fault of rolling element bearing may occur in engineer practice, and now there are only very few effective signal processing based methods to diagnose the compound fault of rolling element bearing. Furthermore, Most of the of the current works on fault diagnosis of compound fault of rolling element bearing are focusing on intelligent algorithms such as Hidden Markov model (HMM), Artificial neural network and so on [7-11] which have the common shortage of time-consuming, so the fault diagnosis of rotating machinery could not be realized timely. So far, several signal processing based methods for fault feature extraction of rotating machinery have been proposed. If localized faults exist in both gear tooth and rolling bearing simultaneously it is difficult to tell the differences between the two types of defects. As such, in paper [12] a new method was proposed to solve the problem by using the meshing resonance and spectral kurtosis algorithm together, and the effectiveness of the proposed method was validated via both simulated and experimental gearboxes vibration signal with compound faults. In paper [13] a hybrid systems named as HGSA-ELM for diagnosis of the compound fault of rolling element bearing was proposed, and the experimental results showed that HGSA-ELM achieved significant high classification accuracy compared with its original version and methods in literatures. A novel method based on the optimal variational mode decomposition and 1.5-dimension envelope spectrum was proposed for detecting the compound fault of rotating machinery [14]. An improved CICA algorithm named constrained independent component analysis based on the energy method was proposed in order to realize single channel compound fault diagnosis of bearings and improve the diagnosis accuracy [15]. To improve the effectiveness of compound fault diagnosis in roller bearings, the paper presented a new method to solve the underdetermined problems and to extract fault features based on variational mode decomposition [16].
SISC [17, 18] is a new signal processing method based on sparse representation, and its application in fault diagnosis of the compound fault of rotating machinery is very limited. In paper [19] a redundant dictionary from a large number of existing signals was trained using SISC and the different bearing faults classification combined with intelligent algorithm was realized. From a different perspective, the basic idea of this paper is to penetrate into the underlying structure of the signal to realize noise cancellation and feature extraction. SISC is used here as the basis function learning algorithm to capture different structural characteristics buried in the signal. By decomposing the original signal simultaneously into these basis functions, fault related time series can be separated through optimal latent component filtering. So, the method proposed in this paper can be considered as a feature enhancing technique without requiring any prior knowledge.
The paper is organized as follows. Section 2 is dedicated to sparse representation and SISC. In Section 3, the processes of SISC in fault diagnosis of the rolling element bearing compound fault are given. Section 4 is the simulation verifying the effectiveness of the proposed method. In Section 5 the experimental analyzed results of rolling element bearing’ three kinds of compound fault (inner race and outer race faults, outer race and rolling element faults, inner race and outer race and rolling element faults) are presented. Conclusions obtained from the above results are given in Section 6.
2. SISC
2.1. Sparse representation
Mallat and Zhang put forward the idea of decomposing signal with the over-complete dictionary of atoms on basis of wavelet transform. The over-complete dictionary taking wavelet dictionary, Gabor dictionary and so on for example is over-complete which is composed of number of atoms. The sparse mode means representing the original signal using atoms as few as possible:
In the above equation, x is the analyzed discrete-time signal, A={a(1),a(2),…,a(n)} is a redundant dictionary which can span the entire Hilbert space RN. If n≫N, the A can be defined as over-complete dictionary. The coefficients for each atom are represented as s=(s1,s2,…,sn).
For the reason of over-completeness, there are numerous of methods for the solution of s=(s1,s2,…,sn) in Eq. (1). The preference is made towards the one with the minimum l0 norm among the numbers of methods. The sparse decomposition is determined by:
The minimization of norm in Eq. (2) is a NP-hard problem which is difficult to solve. Therefore, alternative solutions such as MOF, BOB, MP and BP are proposed based on different strategies. MOF chooses the composition with minimum norm of coefficients. BOB finds the orthogonal basis by minimizing the entropy measure of coefficients. MP selects atoms through a stepwise greedy approximation algorithm. BP selects the representation with minimum norm. BP has advantages of better sparseness and accuracy compared with other algorithms, but suffers the shortages of slower computation speed. The comparison of the main sparse decomposition algorithms is shown in Table 1. More generally, sparse coding poses the following optimization problem to compute the maximum-a-posteriori (MAP) estimation of both and :
As demonstrated in Eq. (3), it has two issues: 1) sparse coefficients solving and 2) redundant dictionary design.
Table 1Comparison of sparse decomposition algorithms
Algorithms | Sparseness measurement | Sparseness of the solution result | Calculation speed | Accuracy |
CM | Optimal | Very slow | Very good | |
BP | Very good | Slow | Very good | |
MP | Sub or local optimal | Good | Moderate | Good |
FOCUSS | Very good | Slow | Very good | |
MOF | Not good | Very fast | Poor | |
IPM | Sub or local optimal | Good | Fast | Moderate |
BOB | Sub or local optimal | Good | Fast | Moderate |
2.2. SISC model
Different from the traditional sparse representation model shown in Eq. (1), the model of SISC can be represented in Eq. (2):
where the basis function , can be replicated at each time offset within the signal and they can appear at all possible shifts. Any signal , could be encoded with a set of basis functions. in Eq. (3) represents the addictive noise. Each basis function being used at all possible time shifts within is represented by the convolution operator * succinctly. The main difference between the SISC model and sparse representation model is that the basis functions in the former are allowed to be lower dimension than the input signal. Furthermore, the coefficients is a vector and the size of it is . The learning of basis functions and coefficients under the maximum-a-posteriori can be solved by the following optimization problem:
The value of is prevented from becoming too large by the constrain shown in Eq. (6). The objective Eq. (5) is to convex one of and , so the solution of basis functionscan be realized by fixing the coefficients , and solving the by fixing .
2.3. SISC algorithm
The optimization problem shown in Eq. (5) can be attributed to a very large sparse representation problem like Eq. (3) with tied parameters by expanding out the convolution. However, even moderate problem sizes will be infeasible to solve due to the reformulation would ignore the special structure in the Eq. (5). An efficient SISC algorithm will be introduced and used in the paper.
The solution of sparse coefficients is a regularized least squares problem if the basis function is fixed, and the problem can be reduced to an unconstrained quadratic optimization problem using feature-sign search algorithm [17]. Keeping the sparse coefficients fixed, and the solution of reduces objective function Eqs. (5)-(6) into a constrained optimization problem:
Different components of basis functions will be coupled in the objective because each basis function can appear in any possible shift and each component of the basis function vector contributes to many different terms in the objective function. The solution to the above problem can turn to by transforming into the frequency domain because the convolution can be replaced by product:
In Eq. (9) the discrete Fourier transforms of basis function , the input signal and the sparse coefficient are represented by , and respectively as shown in Eq. (9). The Parseval’s theorem is the theoretical guarantee of Eqs. (7-8) to Eqs. (9-10), which proves that the discrete Fourier transform scales the norm by a constant factor . So Eqs. (9-10) is equivalent optimization problem with regard to Eqs. (7-8), because their objective and constrains both consist of terms. A sum of quadratic terms can be obtained by decomposing the lagrangian to solve the problem, and each quadratic term depends on a single frequency component :
With dual variables , unit vector , and:
Though it is hard to obtain the most optimal result in Eq. (11), it can be expressed as a function of only real variables using real and imaginary parts of . The obtaining of can be optimizing over and :
The detailed optimization processes can be referred to paper [18].
3. The flow chart of the proposed method
As to rolling element bearing fault signal, the feature of damaged races or cage or rolling element of bearings always takes on periodic impulse characteristic. In theory, the different impulses at different damage location can be represented by just one basis function, so SISC is very suitable to analyze the compound fault signal of rolling element bearing. The steps of the proposed method are given as following:
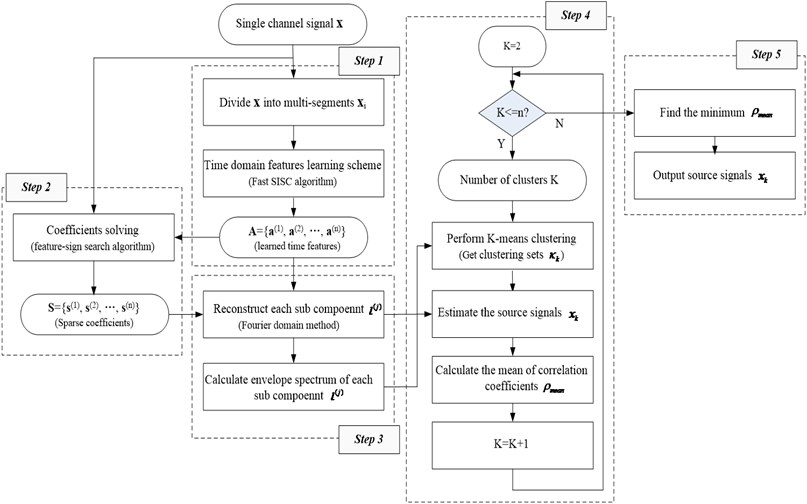
Step1: Divide the one single channel compound observed fault signal into multi-segments ( 1,…, ) and get the corresponding time-domain feature of the observed signal segments ( 1,…, ) and using SISC self-learning algorithm. There are two reasons to segment the signal: 1) Too large training data will cause the SISC dictionary learning algorithm very time-consuming. 2) Each segment is donated as to make sure that at least one fault feature is contained in the segment as shown in Fig. 1.
Fig. 1The segments of the observed signal

Step 2: Fix the time-domain feature obtained in Step 1, and the sparse coefficients of the observed signal based on are obtained through SISC algorithm presented in Section 2.3.
Step 3: The potential component are obtained based on and , and the normalized envelope spectrums of are calculated.
Step 4: Vary the clustering number from 2 to , and apply K-mean clustering algorithm to and the clustering results are obtained. Then the source signal are obtained by regrouping , and the regrouping equation is shown in Eq. (13). Besides, the mean value of Pearson correlation coefficient ( will be discussed in the following content) is also computed to estimate clustering number:
Step 5: Find the minimum obtained in Step 4, and the output signal corresponding to is considered as the last estimated source signal.
The overall flow chart of the above steps is shown in Fig. 2.
Fig. 2The flow chart of the proposed method
In the paper, the optimal clustering number is estimated using the Pearson correlation coefficient . The Pearson correlation coefficient between signal and signal can be computed using the following equation:
where and represent the mean values of signal and signal . and are their corresponding standard deviations. is an index measuring the degree of correlation between two variables and its value varies from –1 to 1: 1 represents that the two variables are positively correlated, and 0 represents that the two variables are unrelated completely. It is evident that –1 represents the two variables are correlated negatively. For each clustering number varying from 2 to , the estimated source signal can be reconstructed using Eq. (13). The Pearson correlation coefficient between any two estimated source signals can be calculated using the Eq. (14), and the Pearson correlation coefficient mean value can be obtained. The optimal estimated clustering number can be obtained when the value of is minimum, and the correlation characteristic among the source signals is weakest.
4. Simulation
The fault model of rolling bearing whose mathematical equation can be expressed as Eq. (15) [5, 20] is used to verify the feasibility of the proposed method. is the tiny fluctuation around mean period . Set the sampling frequency 2560 Hz, and the shaft rotation frequency is 10 Hz. The inner race and outer race fault characteristic frequencies are 105 Hz and 32 Hz respectively. Assuming the random slide between rolling element and race is normally distributed whose standard deviation is 0.5 % of the shaft rotation ratio:
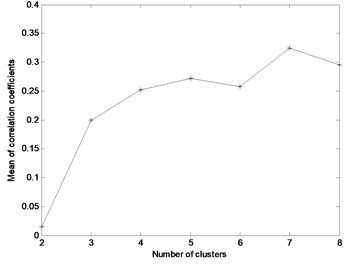
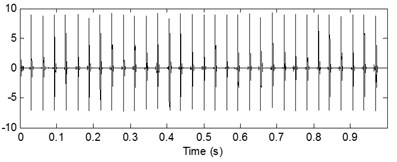
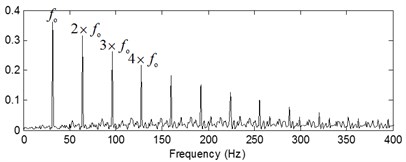
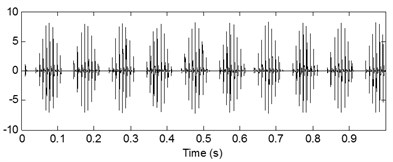
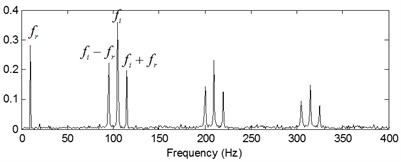
The outer race and inner race fault source signals and their combined signal are shown in Fig. 3: is the outer race fault signal, and is the inner race fault signal with is their combined signal. According to the processes of the proposed method shown in Fig. 2, the source combined signal is segmented and the data length of each segment is 1024. The overlap ratio is 50 % and the data length of each basis function is 256. The obtained time-domain features - and their corresponding potential components - are shown in Fig. 4. The mean value of Pearson correlation coefficients for each clustering number is shown in Fig. 5. It is evident that the mean value of Pearson correlation coefficient is minimum when clustering number is 2 based on Fig. 5, so the number of source signals is 2. The last re-constructed signal 1 and its envelope demodulation spectrum are shown in Fig. 6(a) and (b) respectively, and the reconstructed signal 2 and its envelope demodulation spectrum are shown in Fig. 6(c) and (d) respectively from which the inner race and outer race fault source signals are separated successfully.
Fig. 3Mixed signal of multi-fault bearing
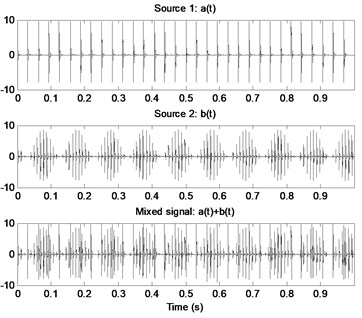
Fig. 4Time features and latent components
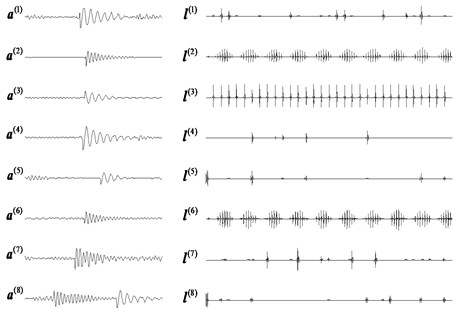
Fig. 5The mean value of correlation coefficients for each clustering number
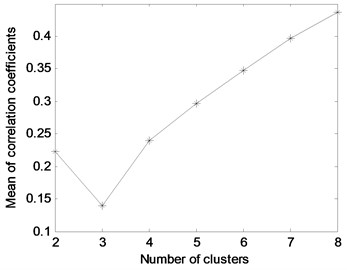
In the above simulation, the noise is not considered, and the white noised is added in the mixed signal shown in Fig. 3 (Mixed signal: ) and the noised mixed signal is shown in Fig. 7. The same steps shown in Fig. 2 are applied on the signal shown in Fig. 7, the obtained eight basis functions are shown in Fig. 8. The mean value of Pearson correlation coefficients for each clustering number is shown in Fig. 9. It is evident that the mean value of Pearson correlation coefficient is minimum when clustering number is 3 based on Fig. 9, so the number of source signals is 3.
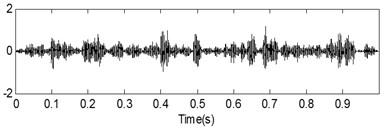
The last analysis results are shown in Fig. 10 and the three source signals are separated successfully.
Fig. 6Recovered sources of simulated signal
a)
b)
c)
d)
Fig. 7Mixed signal with noise

Fig. 88 basis functions
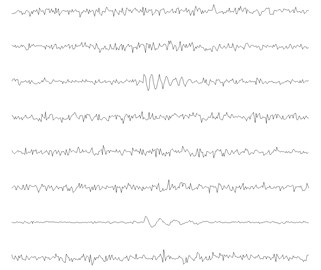
Fig. 9The mean value of correlation coefficients for each clustering number
5. Experiment
In this section, the application of proposed method in fault feature extraction of rolling element bearing’ experimental compound fault is carried out. The test rig is shown in Fig. 11. The type of test rolling element bearing is NU205 and the relative parameters of the test bearings are given in Table 2. Three types of compound fault are implemented: inner race and outer race compound fault, outer race and rolling element compound fault, inner race and outer race and rolling element compound fault. Process faults on the inner race, outer race and rolling element of the test bearing respectively. The processed faults on inner race, outer race and rolling element of the test bearing are shown in Fig. 12(a), (b) and (c) respectively. The two ends of the shaft are supported by rolling element bearings, and the right end is detachable which is convenient for replacement of the test bearings. The accelerator sensor is added in the vicinity of the test bearings and the peak values of the vibration are collected in the experimental process. The outer race is fixed on the bench and the inner race rotates synchronously with shaft in the test process. The rotating frequency is 13.3 Hz and the sampling frequency is 8192 Hz. The characteristic frequencies of inner race fault, outer race fault and rolling element fault are calculated using Eqs. (16)-(18):
In Eq. (16)-(18), is the number of rolling elements. is rolling element diameter. is the pitch diameter and is the contact angle. The values of , and are 95.38 Hz, 64.61 Hz and 5.38 Hz respectively through calculation.
Fig. 10Recovered sources of simulated signal with noise

a)

b)

c)

d)
e)

f)
Table 2The parameters of the test rolling element bearing
Type | Ball number | Ball diameter [mm] | Pitch diameter [mm] | Contact angle | Motor speed [rpm] |
NU205 | 12 | 7.5 | 39 | 0 | 800 |
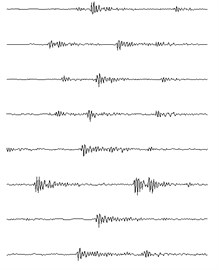
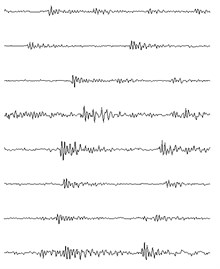
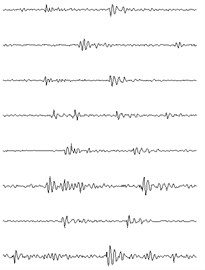
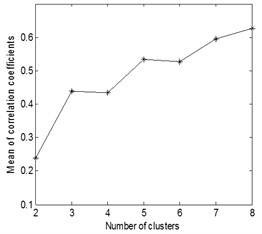
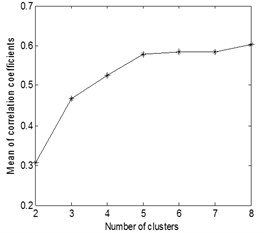
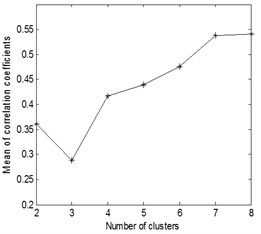
These three kinds of compound fault signals are to be handled using the same process and parameters as in the simulation: The source signals are segmented and the data length of each segment is 1024 point, and the overlap ratio is 50 %. The number and data length of the basis functions are 8 and 256 point respectively. The 8 time-domain feature of the three kinds of compound fault signals are shown in Fig. 13, and the mean value of correlation coefficients for each clustering number of the three kinds of compound fault are shown in Fig. 14: it is evident when the clustering numbers are 2 the of the first and second source signals are minimum, and the clustering number is 3 the of the third source signal is minimum. These verify that the fault sources numbers of the three kinds of compound fault signals are estimated correctly.
Fig. 11The test rig
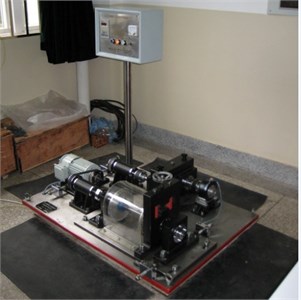
Fig. 12The processed faults on rolling bearing’ inner race, rolling element and outer race
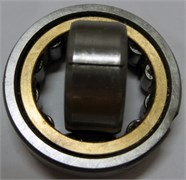
a) Inner race fault
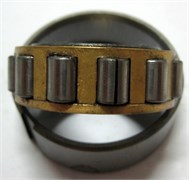
b) Rolling element fault
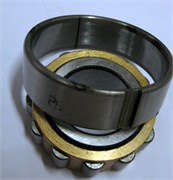
c) Outer race fault
Fig. 13The 8 basis functions of the three kinds of compound fault
a)
b)
c)
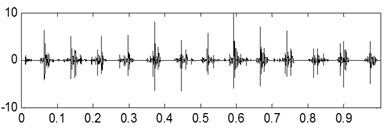
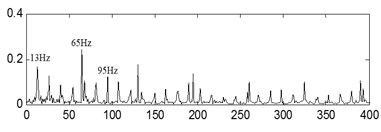
The time-domain waveforms of the three kinds of compound fault are shown in Fig. 15(a), Fig. 16(a) and Fig. 17(a) respectively, and their corresponding envelope demodulation spectrums are given in Fig. 15(d), Fig. 16(d) and Fig. 17(e). In Fig. 15(d), the spectral lines are relative chaotic and the inner race and outer race fault characteristic frequencies with their harmonic frequencies are interleaving together, so it is hard to identify the fault sources. In Fig. 16(d), the outer race fault characteristic frequency with its harmonic frequencies are extracted perfectly using the envelope demodulation method. However, the rolling element fault feature could not be obtained from Fig. 16(d). In Fig. 17(e), Its spectral lines structure is more complex than the spectral lines structure shown in Fig. 15(d) and Fig. 16(d). Though the inner race fault characteristic basic frequency could be extracted roughly, it is evident the spectral lines are chaotic and useful fault features of the outer race fault and rolling element fault could not be obtained based on Fig. 17(e). These analysis results verify that the traditional envelope demodulation spectrum signal processing method is not fit for handling the vibration signal of rolling element baring’ compound fault.
Fig. 14The mean value of correlation coefficients for each clustering number of the three kinds of compound fault
a)
b)
c)
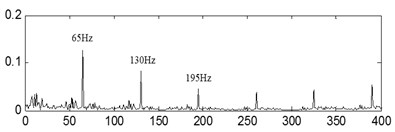
The last separation results of the signal shown in Fig. 15(a) are shown in Fig. 15(b) and Fig. 15(c) based on the proposed method, and their corresponding envelope demodulation spectrums are given in Fig. 15(e) and Fig. 15(f) from which the outer race and inner race fault characteristic frequencies with their harmonic frequencies are extracted successfully and expressed clearly.
Fig. 15The first kind of compound fault with its analysis results

a)
b)

c)
d)

e)
f)
The last separation results of the signal shown in Fig. 16(a) are shown in Fig. 16(b) and Fig. 16(c) based on the proposed method, and their corresponding envelope demodulation spectrums are given in Fig. 16(e) and Fig. 16(f) from which the outer race and inner race fault characteristic frequencies with their harmonic frequencies are extracted successfully and expressed clearly.
Fig. 16The second kind of compound fault with its analysis results

a)

b)

c)

d)

e)

f)
Fig. 17The third kind of compound fault with its analysis results

a)

b)

c)

d)

e)

f)

g)

h)
The last separation results of the signal shown in Fig. 17(a) are shown in Fig. 17(b), Fig. 17(c) and Fig. 17(d) based on the proposed method, and their corresponding envelope demodulation spectrums are given in Fig. 17(f), Fig. 17(g) and Fig. 17(h) from which the outer race and inner race fault characteristic frequencies with their harmonic frequencies are also extracted successfully and expressed clearly. These analysis results verify that the proposed method in the paper is fit for blind source separation the compound fault signals arising in rolling element bearing.
6. Conclusions
How to use shift invariant sparse coding idea to solve the problem of compound fault signal analysis is studied. Combining the characteristics of rolling element bearing fault signal, a method for blind source separation of single channel compound fault is proposed based on shift invariant sparse coding and adaptive clustering. The source number is estimated by minimize the structural correlation among source signals. Through simulation, the process and the effect of the method are introduced. The experimental analysis results further show that the proposed method can separate different source signals caused by different type of fault effectively.
References
-
Antoni J. The spectral kurtosis: a useful tool for characterizing non-stationary signals. Mechanical Systems and Signal Processing, Vol. 20, Issue 2, 2006, p. 282-307.
-
Qiu H., Lee J., Lin J., Yu G. Wavelet filter-based weak signature detection method and its application on rolling element bearing prognostics. Journal of Sound and Vibration, Vol. 289, Issues 4-5, 2006, p. 1066-1090.
-
Endo H., Randall R. B. Enhancement of autoregressive model based gear tooth fault detection technique by the use of minimum entropy deconvolution filter. Mechanical Systems and Signal Processing, Vol. 21, 2007, p. 906-919.
-
Sawalhi N., Randall R. B., Endo H. The enhancement of fault detection and diagnosis in rolling element bearings using minimum entropy deconvolution combined with spectral kurtosis. Mechanical Systems and Signal Processing, Vol. 21, 2007, p. 2616-2633.
-
Antoni J., Bonnardot F., Raad A., Ei Badaoui M. Cyclostationary modeling of rotating machine vibration signals. Mechanical System and Signal Processing, Vol. 18, Issue 6, 2004, p. 1285-1314.
-
McCormick A. C., Nandi A. K. Cyclostationarity in rotating machine vibrations. Mechanical Systems and Signal Processing, Vol. 12, 1998, p. 225-242.
-
Bunks C., Mccarthy D., Al-Ani T. Condition-based maintenance of machinesusing hidden Markov models. Mechanical Systems and Signal Processing, Vol. 14, Issue 4, 2000, p. 597-612.
-
Ocak H., Loparo K. A. HMM-based fault detection and diagnosis scheme for rolling element bearings. Journal of Vibration and Acoustics, Vol. 127, Issue 4, 2005, p. 299-306.
-
Lee J. M., Kim S. J., Hwang Y., et al. Diagnosis of mechanical fault signals using continuous hidden Markov model. Journal of Sound and Vibration, Vol. 276, Issues 3-5, 2004, p. 1065-1080.
-
Crupi V., Guglielmino E., Milazzo G. Neural-network-based system for novel fault detection in rotating machinery. Journal of Vibration and Control, Vol. 10, Issue 8, 2004, p. 1137-1150.
-
Samanta B., Al-Balushi K. R. Artificial neural network based fault diagnostics of rolling element bearings using time-domain features. Mechanical Systems and Signal Processing, Vol. 17, Issue 2, 2003, p. 317-328.
-
Wang T. Y., Chu F. L., Han Q. K. Compound faults detection in gearbox via meshing resonance and spectral kurtosis methods. Journal of Sound and Vibration, Vol. 392, 2016, p. 367-381.
-
Luo M., Li C. S., Zhang X. Y. Compound feature selection and parameter optimization of ELM for fault diagnosis of rolling element bearings. ISA Transactions, Vol. 65, 2016, p. 556-566.
-
Yan X. A., Jia M. P., Xiang L. Compound fault diagnosis of rotating machinery based on OVMD and a 1.5-diemension envelope spectrum. Measurement Science and Technology, Vol. 27, Issue 7, 2016, p. 122-143.
-
Chen G. H., Qie L. F., Zhang A. J. Improved CICA algorithm used for single channel compound fault diagnosis of rolling bearings. Chinese Journal of Mechanical Engineering, Vol. 29, Issue 1, 2015, p. 204-211.
-
Tang G., Luo G. G., Zhang W. H. Underdetermined blind source separation with variational mode decomposition for compound roller bearing fault signals. Sensors, Vol. 16, Issue 6, 2016, p. 133-145.
-
Lee H., Battle A., Raina R., Ng A. Y. Efficient sparse coding algorithms. Advances in Neural Information Processing Systems, Vol. 19, 2007, p. 801-808.
-
Grosse R., Raina R., Kwong H., Ng A. Y. Shift-invariant sparse coding for audio classification. Proceedings of the Twenty-Third Conference on Uncertainty in AI, 2007.
-
Liu H. N., Liu C. L., Huang Y. X. Adaptive feature extraction using sparse coding for machinery fault diagnosis. Mechanical Systems and Signal Processing, Vol. 25, Issue 2, 2011, p. 558-574.
-
Randall R. B., Antoni J., Chobsaard S. The relationship between spectral correlation and envelope anlysis in the diagnostics of bearing faults and other cyclostationary machine signals. Mechanical Systems and Signal Processing, Vol. 15, Issue 5, 2001, p. 945-962.

