Abstract
This paper presents a novel stall detection method based on symmetrized dot pattern (SDP) analysis, which detects the starting point of rotating stall timely and accurately during operations of centrifugal fans. To demonstrate the proposed method, experiments were first performed on a G4-73 No. 8D centrifugal fan to measure the aerodynamic pressure signals of the air flow inside the fan during the gradual development of rotating stall. Then, the SDP technique was used to analyze the pressure signals and extract the time-domain characteristics of the pressure signal during the gradual development of rotation stall. Finally, a comprehensive autocorrelation coefficient was defined and employed as the index for real-time stall detection. In addition, to verify the accuracy of detection results, the tested signals were also analyzed off-line by wavelet transform to detect the actual starting point of rotating stall. The comparison results show that the stall detection method based on the symmetrized dot pattern (SDP) analysis can accurately detect the starting point of rotating stall in centrifugal fans within a short period of 0.05 s.
1. Introduction
Centrifugal fans are a typical rotating machinery and it running states have direct relationship with the safe and economic operations of power plants. However, as the modern power plants become more large-scale, systematic and automated, more and more fans in these plants operate under variable loads. In the meanwhile, with the characteristic of pipe network resistance changing constantly, it is prone to rotating stalls. If the rotating stall cannot be effectively detected and corrected, the efficiency of the power plants will decrease and the fan body and connection pipes will vibrate and even possibly damaged [1]. Therefore, particular attentions should be paid to the detection of rotating stall, and subsequent control of rotating stall should be pursued. Effective detection of rotating stalls of centrifugal fans will ensure the safety and economy of the centrifugation fans and thus the entire power plant units.
Many rotating stall detection methods have been developed through analysis of stall inception data. For example, Longley et al. [2] detected changes in the amplitude and phase of modal wave based on the spatial Fourier analysis. Christensen et al. [3] computed a correlation measure with signal multiplication and integration to develop compressor stall management system. By detailed measurements, McDougall et al. [4] detected the stall transient process. Lin et al. [5] used the continuous wavelet transform method to analyze the aerodynamic signal of compressor. The traveling wave energy method proposed by Tryfonidis et al. [6] extended the use of spatial Fourier method to investigate the pre-stall behavior. Cameron and Morris [7] proposed a cross-correlation method for aerodynamic signals to detected the abrupt onset of rotation stalls. More recently, researchers have proposed a stall detection technique based on the symmetrised dot pattern (SDP) analysis [8, 9]. The technique is particularly effectively compared to other techniques when the signal of interest is low compared to the background noise [10].
This article presents a real-time stall detection technique based on the SDP analysis and the characteristic of dots in the SDP pattern arms. Firstly, experiments were conducted on a G4-73 No. 8D centrifugal fan to measure the aerodynamic pressure signals of the air flow inside the fan gradual development of rotating stall. Then, the SDP technique was used to analyze the pressure signals and the time-domain characteristics of the pressure signal during the gradual development of rotation stall. Finally, a comprehensive autocorrelation coefficient was defined as the index to perform real-time stall detection.
2. Experimental setup of a centrifugal fan system
The experiments were conducted on a 4-73No8D centrifugal fan. The experimental setup is schematically shown in Fig. 1(a). The pressure sensor arrangement is shown in Fig. 1(b). In order to measure the aerodynamic pressure of the air flow inside the fan, five piezoresistive pressure sensors (measurement range: 20 kPa; accuracy: 10 Pa) were arranged on the inner surface of the fan casing with an angular spacing of 60°. The pressure signals were recorded during the course when the fan operates from a normal state to a rotation stall state. The experiments were repeatedly conducted when the openings of the guide vanes were set to be 0°, 15°, 30° and 45°. The throttling cone installed in the outlet pipe was used to control the transition of the fan operation state by adjusting the resistance of the pipe network. A signal conditioning unit (9118DG, ADLINK Technology, Taipei, Taiwan) was used to simultaneously acquire the pressure signals from the five pressure sensors at 320 Hz.
Fig. 1Experimental setup for internal pressure measurements of a centrifugal fan operated under normal or rotating stall conditions
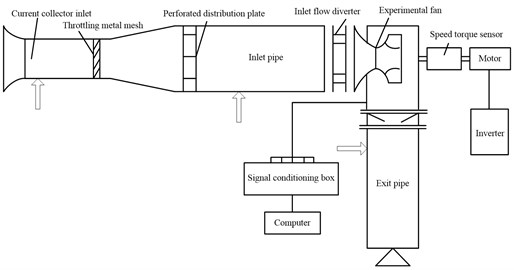
a) Experimental setup
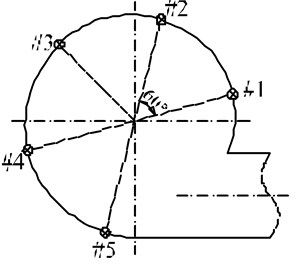
b) Sensors arrangement
3. SDP analysis
3.1. Mathematical framework of SDP analysis
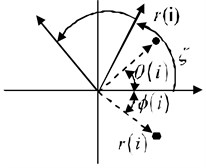
SDP analysis is a method for depicting changes in the amplitude and frequency of a time-series signal using an easy-to-understand visual representation, which maps a normalized time waveform into a symmetrized dot pattern (SDP) on a polar graph. Fig. 2 shows the principle of SDP plotting.
A point in the time waveform maps onto a radial component and the adjacent point maps to an angular component. We can formulate the polar transformation r(i) from waveform to SDP as:
where i is the number of dot (i= integer (t/Δt)), with t the time abscissa and Δt the sampling time, l is the time lag coefficient, xi is the sampled ith sound signal, xmaxand xmin are the highest and the lowest values of the original waveform window, n is the number of mirror symmetry plane, θ is the rotation of the origin angle of any reference line (θ= 360m/n, m= 1, 2,…, n), and ζ is the gain of the plotting (ζ≤θ), and θ(i) and ϕ(i) are the two angles of the traditional polar space.
Fig. 2Principle of SDP plotting
3.2. SDP parameterization
When plotting SDP patterns, the methodology requires a choice of values for the parameters angle θ, time lag l and the angular gain ζ. Typically, we take θ= 60°, which makes the SDP pattern as a snowflake-shaped pattern of six-fold symmetry. Eq. (1) to (3) show that, in SDP pattern, the frequency content manifests in the dot pattern curvature, while the signal variation results in the dot fuzziness, which increases the SDP footprint. The latter feature, correlated with the highest point in the recorded waveform, reflects in the dots’ outer radial positions. Therefore, reasonable selection of the values of ζ and l can improve the resolution of SDP patterns and amplify the differences between different time domain signals. Katsuhiko [11] proved that the optimal values of ζ and l depend on the researching object. Fig. 3 shows the SDP pattern arms of the pressure signal under normal and stall operation states of a fan for different lag l and gain ζ. It shows that the discrimination between the SDP pattern arms of the pressure signal under normal operation state and the SDP pattern arms of the pressure signal under stall operation state can be optimal by setting l= 15 and ζ= 20°. Therefore, l= 15 and ζ= 20° were set in this paper.
Fig. 3SDP pattern arms of the pressure signal under normal and stall operation state of fan for different lag l and gain ζ

a) SDP pattern arms of the pressure signal under normal operation state of fan for different lag l and gain ζ

b) SDP pattern arms of the pressure signal under stall operation state of fan for different lag l and gain ζ
The pressure signal with 300 sampling points during the gradual development of rotation stall from sensor #2 (guide vane opening: 45°, fan speed: 1300 rpm) under different operating states were analyzed by the SDP technique and the SDP patterns are shown in Fig. 4.
Fig. 4 shows that, as a new signal processing method, the SDP analysis can fully describe the characteristics of pressure signals under different operation states of fan, thus making the foundation for the recognition of fan operation state. In addition, Fig. 4 also shows that the mainly difference among the SDP patterns under different operation states is manifested in the degree of concentration about the dots in the SDP pattern arms. When the fan runs from normal to early-stage stall operation state, the degree of concentration is higher than that of the fan running under normal and stall operation state.
Fig. 4SDP patterns of the pressure signal under different operation states of the fan
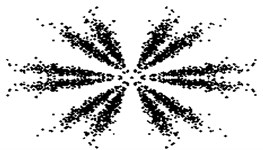
a) SDP pattern of the pressure signal under normal operation state of the fan
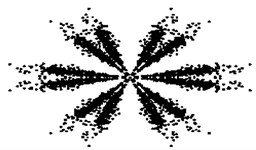
b) SDP pattern of the pressure signal under stall operation state of the fan
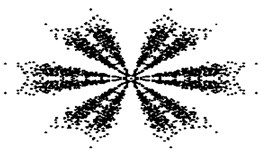
c) SDP pattern of the pressure signal from normal to early-stage stall operation state of the fan
4. Wavelet analysis of the pressure signal during the gradual development of fan rotating stall
In order to reveal the time-domain characteristics of rotating stalls, the pressure signal during the gradual development of rotation stall from sensor #2 (guide vane opening: 15°, fan speed: 1300 rpm) was analyzed by wavelet transform, and the results are shown in Fig. 5. Similar trends were shown of the pressure signals from other sensors. Because the sampling frequency in this paper is 320 Hz, the wavelet analysis frequency was set to be 160 Hz. The rotational frequency is 21.7 Hz, lying in the frequency band of the detail coefficient of the third layer (20-40 Hz). According to the spectral characteristics of rotating stall of centrifugal fan [12], the rotating stall frequency is approximately 14.4 Hz, lying in the frequency band of the detail coefficient of the fourth layer (10-20 Hz).
Fig. 5Fan casing pressure signal and its time-frequency map of wavelet analysis under the condition of 1300 r/min for speed and 15° for diverter opening
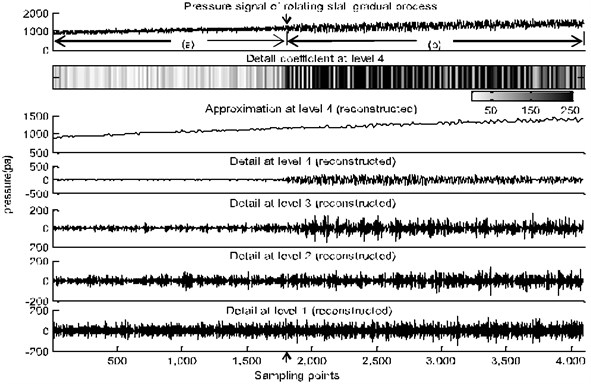
The arrow-labelled pressure data point was identified as the starting point of the rotation stall. Fig. 5 shows that the internal pressure of the fan casing constantly increases with the gradual decrease of the flow rate and some decentralized energy components gradually emerge in the fourth-layer frequency band of the pressure signal, reflecting the onset of rotation stall. The amplitude fluctuation of the pressure signal under rotating stall condition is of categories sinusoidal cycle and the amplitude fluctuation increases sharply compared to that of the pressure signal under normal condition.
As the Eq. (1):
which xmax and xmin are of the certain values for a certain signal. Therefore, after being analyzed by the SDP technique, the range of radiuses r(i) depends mainly on the amplitude xi with respect to the maximum amplitude xmax and minimum amplitude xmin of the signal. If amplitude xi is close to the maximum amplitude xmax, r(i) is close to the maximum 1. If amplitude xi is close to the minimum amplitude xmin, r(i) is close to the minimum 0. When the fan runs from normal to stall operation state, the amplitude fluctuation of the pressure signal increases sharply, that is, the maximum amplitude xmax increases sharply and the minimum amplitude xmin decreases sharply. If the fan runs from normal to early-stage stall operation state, most of the pressure signal is under the normal operating state and only a small portion of the pressure signal is under the stall operating state. The amplitudes xi basically remain unchanged, but the value of xmax-xmin increases sharply. Therefore, after being analyzed by the SDP technique, the range of r(i) decreases and the degree of the concentration of r(i) increases, which means that the variance D(r(i)) of r(i) will decrease.
Similarly, as the Eq. (2) (Eq. 3 is equally applicable):
which xmax, xmin, ζ, θ and l takes on the certain values for a certain signal. If the fan runs from normal to early-stage stall operation state, the range of θ(i) decreases and the degree of the concentration of θ(i) heighten, which means that the variance D(θ(i)) of θ(i) will decrease.
5. Stall detection of centrifugal fan
From the analysis above, one can see that the variances D(r(i)) and D(θ(i)) decrease when the fan runs from normal to early-stage stall operation state. Therefore, the autocorrelation coefficient ηr and the autocorrelation coefficient ηθ are used to express the change rate of D(r(i)) and D(θ(i)). The computation formulas are:
where D(r(i))n is the variance of r(i) of the dots in the SDP pattern arm at the nth sample, D(r(i))n-1 is the variance of r(i) of the dots in the SDP pattern arm at the (n-1)th sample, D(θ(i))n is the variance of θ(i) of the dots in the SDP pattern arm at the nth sample, and D(θ(i))n-1 is the variance of θ(i) of the dots in the SDP pattern arm at the (n-1)th sample.
Last, the comprehensive autocorrelation coefficient η(n)=ηr(n)ηθ(n) is defined and used as the index for stall detection.
The specific procedures of stall detection are as follows.
(1) SDP analysis. Pressure signals including 300 sampling points are analyzed by the SDP technique and the variances of D(r(i)) and D(θ(i)) of dots in the SDP pattern arm are calculated.
(2) Calculation of the comprehensive autocorrelation coefficient η(n)=ηr(n)ηθ(n). Take a sample every 12 sampling points and calculate the autocorrelation coefficients of ηr(n), ηθ(n) and η(n) until the fan runs from normal to rotating stall operation state.
(3) Detection of the starting point of rotating stall. η(n)= 0.8 is determined as the stall threshold and the real-time starting point detection of rotating stall is performed accordingly. When the value of η(n) is less than the threshold η(n)= 0.8, we consider that the rotating stall occurs.
Taking into account that the dot characteristics of the twelve arms in the same SDP pattern are identical, the arm of θ= 0° is just researched in this paper and the pressure signal from sensor #2 is just performed real-time stall detection because of similar trends are showed of the pressure signals during the rotation stall development from other sensors.
The pressure signal during the gradual development of rotating stall from sensor #2 (guide vane opening: 45°, fan speed: 1300 rpm) was performed real-time stall detection and the result is shown in Fig. 6.
Fig. 6Stall detection result of the pressure signal from sensor #2 (guide vane opening: 45°, fan speed:1300 rpm)
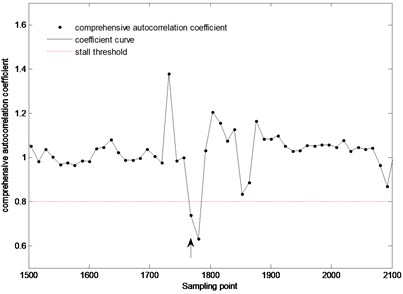
The result shows that at the 1780th sampling point of the pressure signal (shown by the arrow), the comprehensive autocorrelation coefficient decreases sharply and is less than the stall threshold, which indicates that the rotating stall occurred. Later, with sampling, the proportion of the pressure signal under stall operation state in the sampled pressure signal is gradually increasing. Thus, the difference of pressure signal characteristic between the (n-1)th sample and the nth sample decreases, and the comprehensive autocorrelation coefficient fluctuates around η(n)= 1.
In order to verify the accuracy of the detection results, the tested pressure signal was analyzed off-line by wavelet transform (db4 wavelet) to detect the actual starting point of the rotating stall. The tested pressure signal during the gradual development of rotation stall from sensor #2 (guide vane opening: 45°, fan speed: 1300 rpm) and its reconstructed detail coefficient at level 4 are shown in Fig. 7.
The result shows that at about the 1765th sampling point of the pressure signal (shown by the arrows), the amplitude fluctuation of the pressure signal sharply increases, which indicates that the rotating stall actually occurred at this moment. Making a comparison between this result and the stall detection result of Fig. 6, we can know that about 15 sampling points (0.047 s) after stall occurring, this method can detect the starting point of rotating stall successfully. It can meet the need to detect stall timely.
To further verify the accuracy of this method, the pressure signal during the gradual development of rotation stall from sensor #2 (guide vane opening: 15°, fan speed: 1300 rpm) and from sensor #2 (guide vane opening: 30°, fan speed: 1300 rpm) were performed real-time stall detection and off-line wavelet analysis. The results are shown in Figs. 8-11.
Fig. 7The pressure signal from sensor #2 (guide vane opening: 45°, fan speed: 1300 rpm) and its reconstructed detail coefficient at level 4

a) Actual pressure signal of rotating stall gradual process

b) Reconstructed detail coefficient at level 4 of actual pressure signal
Fig. 8Stall detection result of the pressure signal from sensor #2 (guide vane opening: 15°, fan speed: 1300 rpm)
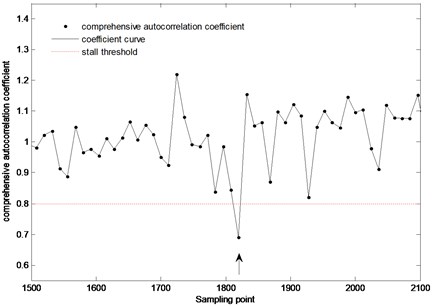
Fig. 9The pressure signal from sensor #2 (guide vane opening: 15°, fan speed: 1300 rpm) and its reconstructed detail coefficient at level 4

a) Actual pressure signal of rotating stall gradual process

b) Reconstructed detail coefficient at level 4 of actual pressure signal
Fig. 8 shows that at the 1820th sampling point (shown by the arrows) of the pressure signal from sensor #2 (guide vane opening: 15°, fan speed: 1300 rpm), the comprehensive autocorrelation coefficient decreases sharply and is less than the stall threshold, which indicates that the rotating stall occurred. By making a comparison between the stall detection result and the off-line wavelet analysis result of Fig. 9, we can know that about 16 sampling points (0.05 s) after stall occurring, this method can detect the starting point of stall successfully. Fig. 10 shows that at the 2248th sampling point (shown by the arrows) of the pressure signal from sensor #2 (guide vane opening: 30°, fan speed: 1300 rpm), the comprehensive autocorrelation coefficient decreases sharply and is less than the stall threshold, which indicates that the rotating stall occurred. By making a comparison between the stall detection result and the off-line wavelet analysis result of Fig. 11, we can know that about 20 sampling points (0.0625 s) after stall occurring, this method can detect the starting point of stall successfully. It also can meet the need to detect stall timely. Therefore, this stall detection method can timely, accurately detect the starting point of rotating stall, and accordingly, make a foundation for the stall control and prevention of centrifugal fan.
Fig. 10Stall detection result of the pressure signal from sensor #2 (guide vane opening: 30°, fan speed: 1300 rpm)
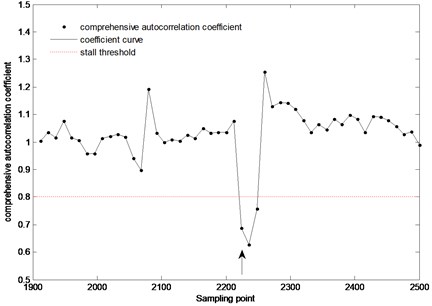
Fig. 11The pressure signal from sensor #2 (guide vane opening: 30°, fan speed: 1300 rpm) and its reconstructed detail coefficient at level 4

a) Actual pressure signal of rotating stall gradual process

b) Reconstructed detail coefficient at level 4 of actual pressure signal
6. Conclusions
This paper presented a stall detection method based on SDP analysis. The comprehensive autocorrelation coefficients were defined as the index to perform real-time stall detection of centrifugal fans. And the following conclusions are obtained based on the experimental results.
1) As a new signal processing method, the SDP analysis can fully describe the characteristics of pressure signals. In the meanwhile, it is easy to be understood and calculated.
2) When the fan runs from normal to early-stage stall operation state, the amplitude fluctuation of the pressure signal increases sharply, which makes the variances D(r(i)) and D(θ(i)) of the dots in the SDP pattern arms sharply decrease. Therefore, the autocorrelation coefficient ηr of D(r(i)) and the autocorrelation coefficient ηθ of D(θ(i)) are used to express the change rate of D(r(i)) and D(θ(i)). When rotating stall occurs, the comprehensive autocorrelation coefficient η(n)=ηr(n)ηθ(n) will sharply decrease.
3) The stall detection method based on the analysis of symmetrized dot pattern can detect the starting point of rotating stall timely and accurately. Accordingly, this research makes a foundation for the stall control and prevention of centrifugal fans.
References
-
Zhang L., Wang S. L., Zhang Q., Wu Z. R. Dynamic characteristics of rotating stall for centrifugal fans. Proceedings of the CSEE, Vol. 32, Issue 14, 2012, p. 95-102.
-
Longley J. P. Inlet Distortion and Compressor Stabilities. Cambridge University. Cambridge UK, 1988.
-
Christensen D., Cantin P., Gutz D., Prasad J. V. R. Development and demonstration of a stability management system for gas turbine engines. Journal of Turbomachinery, Vol. 130, Issue 3, 2008, p. 031011-031019.
-
McDougall N. M., Cumpsty N. A., Hynes T. Stall inception in axial compressors. Journal of Turbomachinery, Vol. 112, Issue 1, 1990, p. 116–123.
-
Lin F., Chen J., Liu M. Wavelet analysis of rotor-tip disturbances in an axial-flow compressor. Journal of Propulsion and Power, Vol. 20, Issue 2, 2004, p. 319-334.
-
Tryfonidids M., Etchevers O., Paduano J. D., Hendricks G. J. Prestall behavior of several highspeed compressors. Journal of Turbomachinery, Vol. 117, Issue 1, 1995, p. 62-80.
-
Cameron J. D., Morris S. C. Spatial correlation based stall inception analysis. Power for Land, Sea, and Air, Montreal, Vol. 6, 2007, p. 433-444.
-
Sheard A. G., Corsini A., Bianchi S. Stall warning in a low-speed axial fan by visualization of sound signals. Journal of Engineering for Gas Turbines and Power, Vol. 133, Issue 4, 2011, p. 041601-041610.
-
Bianchi S., Corsini A., Sheard A. G. Demonstration of a stall detection system for induced draft fans. Proceedings of the Institution of Mechanical Engineers, Part A: Journal of Power and Energy, Vol. 227, Issue 3, 2013, p. 272-284.
-
Bianchi S., Corsini A., Sheard A. G. Tortora C. A critical review of stall control techniques in industrial fans. ISRN Mechanical Engineering, Vol. 2013, Issue 2, 2013, p. 1-18.
-
Katsuhiko S., Atsushi T., Takuya S. Fault diagnosis of rotating machinery through visualisation of sound signals. Mechanical Systems and Signal Processing, Vol. 14, Issue 2, 2000, p. 229-241.
-
Hou J. H., Wang S. L., An L. S., Ai J. C. Characteristic analysis on rotating stall of centrifugal fan based on a family of reformed harmonic wavelet. Power Engineering Journal, Vol. 23, Issue 6, 2003, p. 2814-2818.
Cited by
About this article
This work was supported by the Fundamental Research Funds for the Central Universities of Ministry of Education of China (2015MS122), Natural Science Foundation of Hebei Province in China (E2012502016), the Science and Technology Planning Project of Hebei (No. 15273706D), and the Fundamental Research Funds for the Central Universities (No. 2015ZD24).
Xiaogang Xu’s contribution to this article is 50 %. Haixiao Liu’s contribution to this article is 10 % Songling Wang’s contribution to this article is 10 %. Zhiyuan Fan’s contribution to this article is 10 % Lijuan Yang’s contribution to this article is 10 %. Songtao Liu’s contribution to this article is 10 %.

