Abstract
Four sets of numerical models were created to study the effects of shapes, staggering patterns, Helmholtz resonators and array configurations on the acoustical performance of sonic crystals (SCs) in order to design an efficient SC window to mitigate the traffic noise level at a room in a student hostel of NUS. Rectangular SCs consistently obtained highest transmission loss for frequencies ranging from 300 Hz to 3000 Hz compared to diamond and semi-circle SCs. Fully staggered pattern performed better than non-staggered and 50 % staggered patterns for frequencies below 1700 Hz. Helmholtz resonators were useful for enhancing low frequency noise mitigation. The prototype of the final designed SC window was fabricated and tested in order to validate the simulation result. Generally, numerical and experimental results were in similar trends. Maximum transmission loss of the SC window was found to be occurred at 900 Hz which was about 18 dB.
1. Introduction
The idea of sonic crystal (SC) appeared in the 90s and it was defined as periodic distribution of cylindrical sound scatterers in air to inhibit sound transmission by their acoustic band gaps [1]. The scatterers can be made of sound hard or low acoustic impedance materials and the destructive Bragg interference was used to explain the phenomenon of band gaps. The distance between adjacent scatterers was presented by a lattice constant () and was used to determine the center frequency () of the band gap:
where is an integer determining the reflection order, is the speed of sound in air and is the scattering angle. The main objective of the current effort is to use numerical method to study the effects of shapes, staggering patterns, Helmholtz resonators and array configurations on the acoustical performance of rectangular SCs in order to design an efficient SC window to mitigate the traffic noise level at a room in a student hostel of NUS. SC window would permit natural ventilation compared to conventional glass window. Therefore, they are more suitable for a student residence. The width of the designed SC window is about 1.4 m and was modelled full-scale according to the dimension of the window at a room within a student hostel. Only 3 rows of SCs were incorporated in the final design of the window because the thickness of the wall is about 0.22 m.
Goffaux and Vigneron [2] used a plane-wave method to analyze the band structure of a periodic assembly of hard rods of square section distributed in air. They found that the tuning mechanisms provided a non-destructive method of influencing the phononic structure. Wang et al. [3] studied the photonic band structures of two-dimensional (2D) photonic crystals through numerical methods. They concluded that largest absolute photonic band gap was achieved by selecting a scatterer of the same symmetry. Hu et al. [4] presented a type of SC composed with an array of 2D Helmholtz resonators and they claimed that their SC had a bigger effective magnetic permeability than the convectional rigid-cylinder SC. Martinez-Sala et al. [5] concluded that it was possible to inhibit sound transmission by arranging different types of trees in a periodic lattice through a real field experiment. The performance of the SC noise barriers which composed of infinitely long multi-resonant composite scatterers was investigated by Krynkin et al. [6] through experimental and theoretical methods. They found that the use of the resonating elements in SCs resulted in effective sound mitigation in the low frequency range and the SCs still preserving the existence of the Bragg band gap. The acoustic wave propagation in the woodpile SC with a defect was investigated by Wu and Chen [7] theoretically and experimentally. They concluded that the defect band frequencies were strongly dependent on the width and position of the middle rods.
Van Renterghem et al. [8] used three-dimensional (3D) finite-difference time-domain method to simulate sound propagation through a 15 m deep vegetation belt along a road. They concluded that the vegetation belt could compete with the transmission loss of a classical noise barrier with a height of 1-1.5 m in a non-refracting atmosphere. Taherzadeh et al. [9] investigated sound transmission through arrays of identical cylinders at filling fractions of 13 % and 50 % with their axes perpendicular to the ground by experimental method. They found that for filling fractions between 13 % and 50 %, the deliberate introduction of perturbations in cylinder location could result in a significantly enhanced broadband transmission loss. The acoustic transmission coefficient of a resonant SC made of hollow bamboo rods was studied by Lagarrigue et al. [10] through experimental and theoretical methods. They found that a clear transmission band gap could produce by a SC made from a natural material with some irregularities. In addition, the transmission loss in low frequency region was enhanced by drilling of the bamboo rod between the nods creating Helmholtz resonator. Koussa et al. [11] evaluated the acoustical performance of a noise reducing device which combined SCs with a conventional noise barrier using 2D Boundary Element Method (BEM). Their results showed a significant transmission loss due to the addition of the SC elements for middle and high frequencies of typical road traffic noise. Castineira-Ibanez et al. [12] designed some SCs acoustic screens formed by cylindrical scatterers embedded in air to inhibit the transmission of traffic noise in cities.
Jean and Defrance [13] studied the acoustic efficiencies of artificial cylindrical SCs and thickets placed near road by means of 2D-BEM approach. Their results showed that a 50 m wide barrier could reduce traffic noise by about 10 dB(A) at night, but could also cause an increment in the noise level during day time. A radial SC which consisted of periodic structures in polar coordinate was developed by Gupta et al. [14] to reduce divergent sound source up to 30 dB based on the Webster horn equation. Morandi et al. [15] investigated the sound insulation index (SI) of cylindrical SCs arranged in a square lattice according to EN 1793-6 standard through experimental and numerical methods. They found significant SI value at the first Bragg band gap while negative value of SI was found at the second band gap. Sanchez-Perez et al. [16] tested the performance of a SC acoustic barrier with triangular array of resonant absorbent scatterers. They concluded that their SC acoustic barrier is a good alternative to the current conventional noise barrier. Van der Aa and Forssn [17] introduced the 2.5D Multiple Scattering Theory to solve the problem of 3D sound propagation path through arrays of cylinders oriented parallel to the ground. Sanchez-Perez et al. [18] presented an overlapping comprehensive model to easily design SC acoustic screens based on the tunability concept. The model allowed the design of barriers for specific purposes by assigning each acoustic effect a predetermined range of frequency.
It can be seen that the reported studies on SCs were mostly confined to cylindrical SCs while only limited number of studies were conducted to investigate the acoustical performance of rectangular SCs. These rectangular columns are common features of non-load or load bearing structures. Therefore, numerical studies were performed to design an efficient SC window based on rectangular SCs to mitigate the traffic noise level at a room in a student hostel of NUS. The initial prototype of the SC window was fabricated and tested in a corridor first before the actual installation at student hostel to validate the simulation result.
2. Methodologies
2.1. Numerical methods
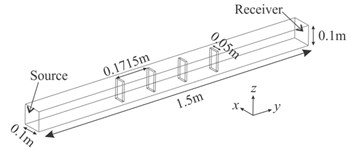
All numerical simulations were conducted with 3D models using time-harmonic analysis. Comsol software [19] was used in the present studies. Four sets of numerical models were created in order to study the effects of shapes, staggering, Helmholtz resonators and array on the acoustical performance of SCs. Fig. 1(a) shows the illustration for first set of 3D model which consists of a 0.1 m (width) × 0.1 m (height) × 1.5 m (depth) rectangular waveguide that represents the computation domain which uses air as sound wave propagation medium. The width of each SC was about 0.05 m and there were four SCs in the model. The distance between adjacent SCs was determined to be 0.1715 m in order to produce of 1000 Hz ( 1 and 90°). SCs with three different shapes: rectangular, diamond and semi-circle were created in the first set of simulation as shown in Fig. 1(b), (c) and (d), respectively.
Fig. 13D numerical models with different shapes
a) Illustration of 3D model

b) Rectangular

c) Diamond

d) Semi-circle
Fig. 23D numerical models with different staggering patterns (top view)

a) Non-staggered

b) 50 % staggered

c) Fully staggered
After that, SCs with three different staggering configurations: non-staggered, 50 % staggered and fully staggered were created in second set of simulation as shown in Fig. 2. The SCs were combination of four rectangular plates and their geometries were the same with those rectangular SCs in first set of simulation. For the third set of simulation, geometries of the rectangular SCs were modified to study the effects of Helmholtz resonator as shown in Fig. 3. The slit size of 0.001 m was estimated to give resonant frequency () of about 551 Hz using Eq. (2) [20]:
where is the cross sectional area of the resonator opening, is the volume of the resonator, is the length of neck and s is the slit size. The size of the rectangular waveguide for second and third sets of simulations were the same with first set of simulation. SCs with three different array configurations: 3 rows ( direction) × 3 columns ( direction), 3 rows × 5 columns and 3 rows × 7 columns were created in fourth set of simulation as shown in Fig. 4. The geometries of the SCs were the same with those SCs in third set of simulation. The SCs were fully staggered for all three configurations. The height of the SCs for second, third and fourth sets of simulations were still remain 0.1 m.
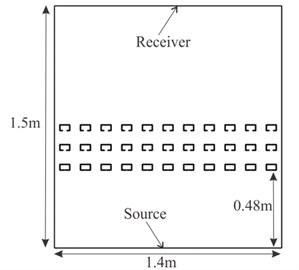
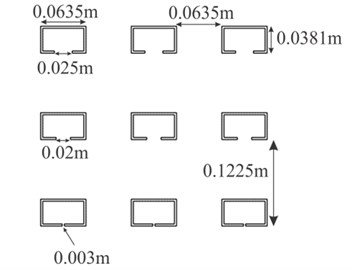
The final design of the SC window consisted of 3 rows and 11 columns of hollow rectangular tubes as shown in Fig. 5(a) and its dimensions are shown in Fig. 5(b).
Fig. 33D numerical model with Helmholtz resonators (top view)

Fig. 43D numerical models with different array configurations (top view)

a) 3 rows × 3 columns

b) 3 rows × 5 columns

c) 3 rows × 7 columns
Fig. 5a) 2D numerical model of the SC window, b) enlarge view of the SC window. Only 3 columns of the SCs are shown for clearer presentation of the model
a)
b)
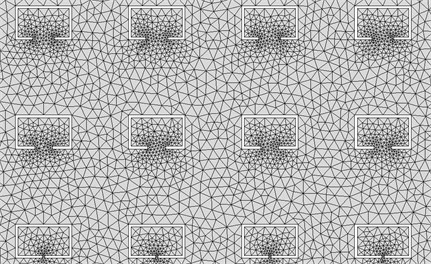
The wall thickness of each tube is 3 mm. The distance between the edges of tubes is 0.1225 m which will produce of 1400 Hz. The slit sizes of the Helmholtz resonators are 0.003 m, 0.02 m and 0.025 m which were estimated to give of about 930 Hz, 1251 Hz and 1270 Hz, respectively. These slit sizes were selected in order to inhibit the transmission of traffic noise at 1000 Hz since the frequency of traffic noise is around 1000 Hz [21]. The SC window was modeled in computational 2D model instead of 3D model due to the limitation of computer capacity where the available workstation in the research group is not able to run complex 3D simulation case. For both 2D and 3D models, both source and receiver surfaces see Fig. 1(a) were defined as radiation boundaries while all other surfaces were defined as sound hard boundaries. Each numerical model consists of about 17000 elements as shown in Fig. 6. An initial planar radiation sound pressure of 1 Pa was applied on the source surface. In this study, the source of the traffic noise comes from the bus at a bus stop which is located about 4 m away from the student hostel. This distance is far enough for the noise source to be assumed as planar source. Boundary integration was applied and was averaged on the receiver surface to determine the final sound pressure level (SPL). For 3D models, the source frequencies were ranging from 300 Hz to 3000 Hz with interval of 100 Hz for frequencies less than 2000 Hz and 500 Hz for frequencies greater than 2000 Hz. For the finalized 2D model, the source frequencies were ranging from 300 Hz to 2000 Hz with interval of 100 Hz since the targeted was less than 2000 Hz. The acoustical performance of the SCs was examined in term of transmission loss and it was defined as the difference between the final and initial SPLs at the receiver surface.
Fig. 6Example of mesh of the numerical model
2.2. Experimental methods
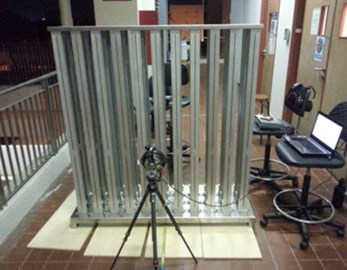
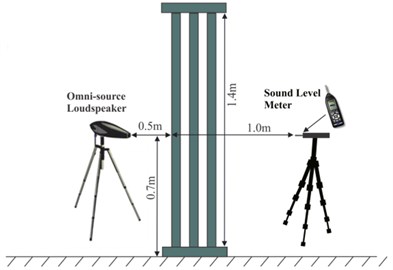
The experiment was consisted of a Bruel & Kjaer (B&K) Omni-source loudspeaker (model 4295), a B&K power amplifier (model 2734) and a B&K sound level meter (model 2238). The experiment was conducted at corridor of NUS building as shown in Fig. 7(a) in order to validate the simulation result. The loudspeaker and sound level meter were positioned 0.7 m from ground and 1.5 m apart from each other where the loudspeaker was positioned 0.5 m away from the SCs as shown in Fig. 7(b). The heights of the SCs are about 1.4 m and white noise was generated by the loudspeaker. All data were recorded using the sound level meter from 300 Hz to 2000 Hz with interval of 100 Hz. The sampling time for each set of data is one minute. SPLs at corridor without the SCs were also measured in order to obtain the transmission loss (TL) which was given by:
Fig. 7a) Experimental set-up of the noise measurement at corridor, b) schematic diagram (side view)
a)
b)
3. Results and discussion
Fig. 8(a) shows the comparison of the transmission loss for SCs with different shapes. For all three shapes, the first and second maximum transmission losses are observed at of 1000 Hz and 1900 Hz, respectively, due to the band gaps of the SCs. The rectangular SCs consistently obtain highest transmission loss followed by diamond SCs and then semi-circle SCs for frequencies ranging from 300 Hz to 3000 Hz. However, the differences between the performances of three shapes are not significant for low frequency range below 800 Hz. The transmission loss obtained by the rectangular SCs is 20 % and 25 % higher than those obtained by diamond and semi-circle SCs at 1000 Hz, respectively. When the frequency increased to 1900 Hz, the transmission loss obtained by the rectangular SCs is 20 % and 41 % higher than those obtained by diamond and semi-circle SCs, respectively. Therefore, rectangular shape was selected and it was used for the rest of simulation cases. In addition, the total acoustic pressure fields for SCs at 1000 Hz with all three shapes are also shown in Fig. 8(b), (c) and (d). Total acoustic pressure at 1000 Hz is selected to be presented in the present study instead of other frequencies because 1000 Hz is the targeted for the four sets of the numerical models. It can be observed that the semi-circle SCs see Fig. 8(d) contain higher acoustic pressure compared to other two shapes especially from 0.6 m to 0.9 m and at 1.4 m. This phenomenon explains why the semi-circle SCs obtain the lowest transmission loss at 1000 Hz among all three shapes.
Fig. 8Comparison of the SCs with different shapes in term of a) transmission loss b) total acoustic pressure at 1000 Hz
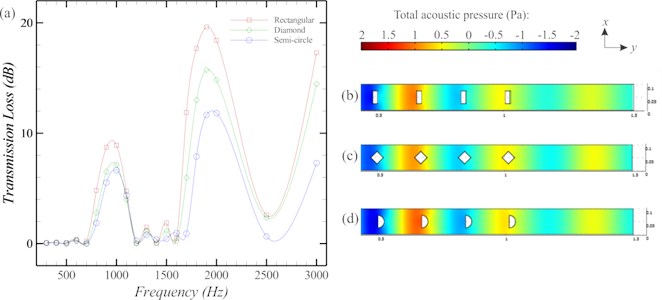
Fig. 9Comparison of the rectangular SCs with different staggering patterns in term of a) transmission loss b) total acoustic pressure at 1000 Hz
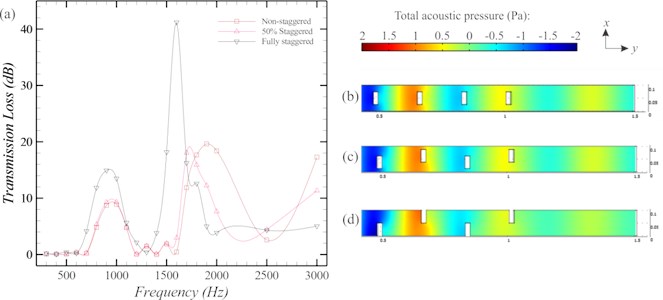
Fig. 9(a) shows the comparison of the transmission loss for rectangular SCs with different staggering patterns. The differences between the performances of three patterns are not significant for low frequency range below 700 Hz. The first maximum transmission losses for non-staggered and 50 % staggered patterns still occur at 1000 Hz due to band gaps but it is shifted to 900 Hz for fully staggered pattern. The second maximum transmission losses for 50 % and fully staggered patterns are shifted to 1700 Hz and 1600 Hz, respectively where fully staggered pattern can obtain 41 dB of transmission loss at 1600 Hz. Staggering tends to shift maximum transmission loss to lower frequency range. Generally, fully staggered pattern performs better than the other two patterns for frequencies below 1700 Hz. However, non-staggered pattern achieves the best performance for frequencies ranging from 1800 Hz to 2500 Hz. From the results obtained, fully staggered pattern is the best pattern to inhibit the transmission of traffic noise. However, ventilation issue should be taken into consideration during the designing process of SC window. The total acoustic pressure fields for SCs at 1000 Hz with all three staggering patterns are shown in Fig. 9(b), (c) and (d).
Fig. 10 shows the transmission loss of rectangular SCs incorporated with Helmholtz resonators. The first maximum transmission loss occurs at 500 Hz due to the effect of Helmholtz resonators where it is able to obtain 53 dB of transmission loss. The effects of band gaps still exist as the second maximum transmission loss is observed at 900 Hz. However, the third and fourth maximum transmission losses which supposed to be occurred at 2000 Hz and 3000 Hz when 2 and 3 are shifted to 1700 Hz and 2500 Hz, respectively. Helmholtz resonators tend to shift the maximum transmission loss to lower frequency range. It can be concluded that Helmholtz resonators are useful for low frequency noise mitigation which might not be able to solve by conventional solid SCs due to the limitation of space. The distances between adjacent SCs need to be as large as possible to obtain low .
Fig. 10Transmission loss of rectangular SCs incorporated with Helmholtz resonators
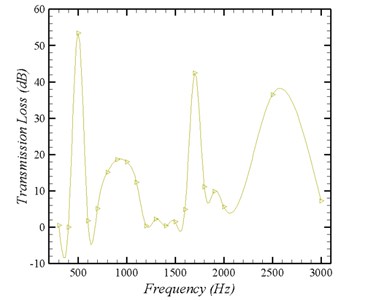
Fig. 11 shows the comparison of the transmission loss for rectangular SCs with different array configurations. Generally, the maximum transmission losses for all three configurations still occur at similar frequencies. The differences between the performances of three configurations are most significant at 500 Hz where the transmission loss obtained by 5 columns and 7 columns arrays are 19 % and 70 % higher than those obtained by 3 columns array, respectively. When frequency increases to 1000 Hz, the transmission loss obtained by 5 columns and 7 columns arrays are similar. It can be concluded that the transmission loss increases with increased SCs in direction which is the direction perpendicular with path of sound. The total acoustic pressure fields for SCs at 1000 Hz with all three array configurations are shown in Fig. 11(b), (c) and (d). It can be observed that the SCs with 7 columns see Fig. 11(d) contain lower acoustic pressure compared to other two configurations at 1 m and 1.4 m. This observation matches with the transmission loss results obtained at 1000 Hz.
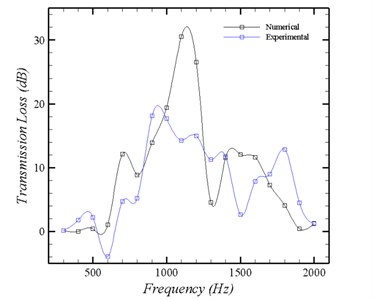
Fig. 12 shows the comparison of the transmission losses for SC window which obtained from numerical and experimental studies. It can be observed that the maximum transmission losses occur at 1100 Hz and 900 Hz due to the effects of Helmholtz resonators where the transmission losses are as high as 31 dB and 18 dB for numerical and experimental studies, respectively. In addition, the average transmission losses at all frequencies obtained by the numerical and experimental studies are 9 dB and 8 dB, respectively. The experiment result shows that the SC window is able to obtain more than 10 dB of transmission loss from 900 Hz to 1400 Hz. Therefore, the Helmholtz resonators are able to mitigate noise at lower frequencies other than the targeted by the band gaps. The effects of band gaps still exist as the SC window is able to inhibit the transmission of sound by 12 dB at 1400 Hz. It can be concluded that the numerical simulation is able to model the experiment and two results generally are in similar trends. Large deviations found at frequencies of 1100 Hz and 1200 Hz might be due to the inconsistence background noise at the corridor.
Fig. 11Comparison of the rectangular SCs with different array configurations in term of a) transmission loss b) total acoustic pressure at 1000 Hz
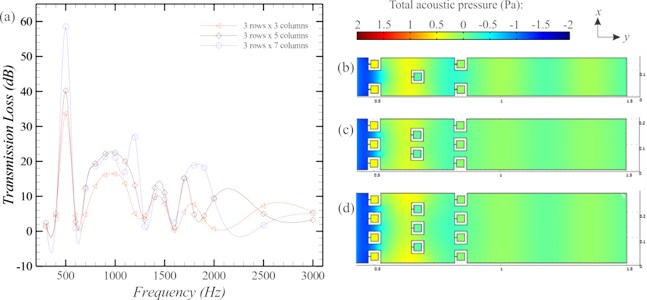
Fig. 12Comparison of the transmission losses for SC window which obtained from numerical and experimental studies (color online)
4. Conclusions
Four sets of numerical models were created to study the effects of shapes, staggering patterns, Helmholtz resonators and array configurations on the acoustical performance of SCs in order to design an efficient SC window to mitigate the traffic noise level at a room in a student hostel at NUS. The prototype of the final designed SC window was fabricated and tested in order to validate the simulation result. The rectangular SCs consistently obtained highest transmission loss for frequencies ranging from 300 Hz to 3000 Hz compared to diamond and semi-circle SCs. Therefore, rectangular shape was selected and it was used for the rest of simulation cases. Fully staggered pattern performed better than non-staggered and 50 % staggered patterns for frequencies below 1700 Hz. Helmholtz resonators were useful for low frequency noise mitigation which might not be able to solve by conventional solid SCs due to the limitation of space. Transmission loss increased with increased SCs in direction. The experiment result shows that the SC window is able to obtain more than 10 dB of transmission loss from 900 Hz to 1400 Hz. The numerical and experimental results generally are in similar trends. We can conclude that the rectangular SC window incorporated with Helmholtz resonators is able to inhibit the transmission of traffic noise effectively.
References
-
Dowling J. MAY 1992. Sonic band-structure in fluids with periodic density variations. Journal of the Acoustical Society of America, Vol. 91, Issue 5, 1992, p. 25392543.
-
Goffaux C., Vigneron J. Theoretical study of a tunable phononic band gap system. Physical Review B, Vol. 64, 2001, p. 075118.
-
Wang R., Wang X., Gu B., Yang G. Effects of shapes and orientations of scatterers and lattice symmetries on the photonic band gap in two-dimensional photonic crystals. Journal of Applied Physics, Vol. 90, Issue 9, 2001, p. 43074313.
-
Hu X., Chan C., Zi J. Two-dimensional sonic crystals with Helmholtz resonators. Physical Review E, Vol. 71, 2005, p. 055601(R).
-
Martinez-Sala R., Rubio C., Garcia-Raffi L., Sanchez-Perez J., Sanchez-Perez E., Llinares J. Control of noise by trees arranged like sonic crystals. Journal of Sound and Vibration, Vol. 291, Issue 1-2, 2006, p. 100-106.
-
Krynkin A., Umnova O., Chong A., Taherzadeh S., Attenborough K. Sonic crystal noise barriers made of resonant elements. Proceedings of 20th International Congress on Acoustics, ICA, Sydney, Australia, 2010.
-
Wu L.-Y., Chen L. W. Propagation of acoustic waves in the woodpile sonic crystal with a defect. Applied Acoustics, Vol. 73, Issue 4, 2012, p. 312-322.
-
Van Renterghem T., Botteldooren D., Verheyen K. Road traffic noise shielding by vegetation belts of limited depth. Journal of Sound and Vibration, Vol. 331, Issue 10, 2012, p. 2404-2425.
-
Taherzadeh S., Bashir I., Attenborough K. Aperiodicity effects on sound transmission through arrays of identical cylinders perpendicular to the ground. Journal of the Acoustical Society of America, Vol. 132, Issue 4, 2012, p. EL323-8.
-
Lagarrigue C., Groby J. P., Tournat V. Sustainable sonic crystal made of resonating bamboo rods. Journal of the Acoustical Society of America, Vol. 133, Issue 1, 2013, p. 247-254.
-
Koussa F., Defrance J., Jean P., Blanc-Benon P. Acoustical efficiency of a sonic crystal assisted noise barrier. Acta Acustica United with Acustica, Vol. 99, Issue 3, 2013, p. 399-409.
-
Castineira-Ibanez S., Rubio C., Vicente Sanchez-Perez J. Environmental noise control during its transmission phase to protect buildings. Design model for acoustic barriers based on arrays of isolated scatterers. Building and Environment, Vol. 93, Issue 2, 2015, p. 179-185.
-
Jean P., Defrance J. Sound propagation in rows of cylinders of infinite extent: application to sonic crystals and thickets along roads. Acta Acustica United with Acustica, Vol. 101, Issue 3, 2015, p. 474-483.
-
Gupta A., Lim K.-M., Chew C. H. Design of radial sonic crystal for sound attenuation from divergent sound source. Wave Motion, Vol. 55, 2015, p. 1-9.
-
Morandi F., Cesaris S. D., Garai M. Experimental evidence of band gaps in periodic structures. Euronoise 2015, 10th European Congress and Exposition on Noise Control Engineering, Maastricht, Netherlands, 2015, p. 2363-2366.
-
Sanchez-Perez J. V., Michavila C. R., Garcia-Raffi L. M., Romero-Garcia V., Castineira-Ibanez S. Noise certification of a sonic crystal acoustic screen designed using a triangular lattice according to the standards EN 1793(-1;-2;-3): 1997. Euronoise 2015, 10th European Congress and Exposition on Noise Control Engineering, Maastricht, Netherlands, 2015, p. 2358-2361.
-
van der Aa B., Forssn J. The 2.5d mst for sound propagation through arrays of cylinders parallel to the ground. Euronoise 2015, 10th European Congress and Exposition on Noise Control Engineering. Maastricht, Netherlands, 2015, p. 16.
-
van der Aa B., Forssn J. Towards the development of a software to design acoustic barriers based on sonic crystals: an overlapping model. Euronoise 2015, 10th European Congress and Exposition on Noise Control Engineering. Maastricht, Netherlands, 2015, p. 2367-2371.
-
Comsol. https://www.comsol.com/, 2016.
-
Everest F. A., Pohlmann K. C. Master Handbook of Acoustics. Fifth edition, Mc Graw Hill, 2009.
-
Sandberg U. The multi-coincidence peak around 1000 hz in tyre/road noise spectra. Euronoise 2003, 5th European Conference on Noise Control and AIA 2003, Naples, Italy, Vol. 498, 2003, p. 18.
About this article
This material is based on research/work supported by the Singapore Ministry of National Development and National Research Foundation under L2 NIC Award No. L2NICCFP1-2013-8.
