Abstract
In this article, an oscillator is considered in which one of its component moves periodically and for which static friction is taken to be time-dependent. The dynamics of the oscillator are analyzed using Poincare map to find shifts between periodic and chaotic motion with the change of the model parameters (amplitude and frequency of velocity of the periodic motion and the coefficient of static friction as a function of the time of stationary contact).
1. Introduction
A. Y. Ishlinskiy and I. V. Kregelskiy [1] presented a hypothesis that the coefficient of static friction is not a constant, but a monotonously increasing function of the time of the contact between two bodies. After a substantial delay, it attracted the attention of scientists working on systems with friction [2-4]. It has been shown, that systems with time-dependent static friction can display different types of dynamic behavior, including complex periodic motion and chaos. Similar systems to the one studied here have also been studied in other works (e.g., [5-7]), but they did not use time-dependent static friction and used the classic model of static friction instead.
1.1. Mathematical model
The model considered in this article is depicted in Fig. 1(a).
Fig. 1Physical model of a vibration system

a)
b)
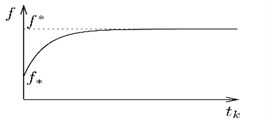
The model consists of a mass m, that rides on a moving belt with dry friction. The belt moves with periodically changing velocity V(t). The mass is attached to inertial space by a spring with stiffness k. The coefficient of static friction, in accordance with the hypothesis of Ishlinskiyi A. Yi., Kragelskiyi I. V. [1], is considered to be a continuous monotonically increasing function of the time tk of stationary contact (stick motion of the mass and the belt) as depicted in Fig. 1(b). The Coulomb model is used for non-static dry friction.
The motion of the mass in the model is described by the Eq. (1), (2):
Eq. (1) describes the slip motion of the mass with non-static dry friction with coefficient f*. Eq. (2) describes the condition for the stick motion. fп(tk) is the coefficient of static friction as a function of the stick motion time tk. Note that when V(t)=const, the Eq. (1) takes the form of the corresponding equation in [4].
With dimensionless time τ=tω0, coordinate ξ=xk/f*P and parameters ω0=√k/m, θ(τ)=V√km/f*P, the Eq. (1), (2) will take the form:
where ε(τk)=(fп(τk)-f*)f*-1 – dimensionless coefficient of static friction).
1.2. Structure of the phase space
Since the system is non-autonomous and can be described by second-order differential equation, its state is a triplet {ξ,˙ξ,τ} (Fig. 2), and its phase space is accordingly 3-dimensional. The phase space is split into 2 half-spaces Φ1(ξ,˙ξ>θ,τ) and Φ2(ξ,˙ξ<θ,τ) by the surface Π(˙ξ=θ(τ)).
The shape of phase trajectories in each half-space is described by the Eq. (5), (6):
It can be shown, that on the surface П there is a strip of stick motions ПC bounded by curves Г1 and Г2:
On the strip ПC a phase trajectory is described by Eq. (8):
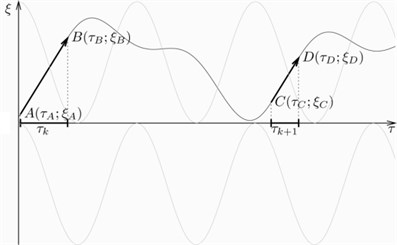
An example of a phase space trajectory with stick motion intervals is shown in Fig. 3.
Fig. 2Phase space S
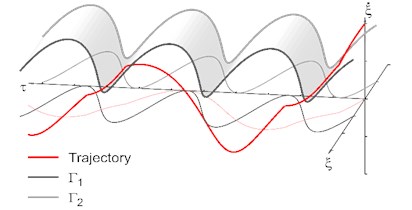
Fig. 3The qualitative form of the phase trajectories
1.3. Dynamics of the system
For the purpose of modeling the dynamics of system Eqs. (1-2), the function for the dimensionless belt speed was taken as follows: θ(τ)=Acos(Ωτ)+B. The function ε(τk) for the dimensionless coefficient of static friction was taken as follows:
Suppose Mi(τi,ξi), i=0,1,..,n – a sequence of point on the surface П, which does not belong to the strip ПC and which is determined by the Eq. (5) for i=2k<n, k= 1, 2,… and Eq. (6) for i=2m+1<n, m=0, 1,…. Suppose as well, that the coordinates of M0 are τ=τ0, ξ=1+ε(τk,c), ˙ξ=θ(τ0). For such sequence, a number n can be found, for which Mn+1(τp,ξp) will belong to the strip ПC and the interval of phase trajectory is described by Eq. (9) until the point determined from condition Eq. (4). Let’s take Τ+ to denote the mapping M2k+1→M2k+2, k=0,1,2,…<n, and Τ- – the mapping M2m→M2m+1, m=1,2,…<n . The mapping M0→Mn+1 can thus be described by Τ1(j,l,n)=((Τ-)j(Τ+)l)[n2], l, j=0, 1,..., n. The connection between two adjacent stick motion intervals τk, τk+1 can be described as follows ψ(τk+1)=φ(τk):
Since the system state trajectory will always end on the sliding surface, they dynamics of the system can be examined using Poincare map of the boundary Г1(Г2) into itself, or using the sequence of durations of stick motions τk, k=1, 2, 3… To study the dynamics of the system, we developed an application allowing to perform calculations of trajectories of the system, the Poincare maps, and bifurcation diagrams, using different values of the system parameters. All calculations are done using double precision floating point arithmetic. When calculating a single trajectory, different points on the trajectory are calculated with progressively increasing time distance from the initial point, until the trajectory reaches a boundary between areas where the system behavior is described by different equations, e.g. when the trajectory reaches the surface Π(˙ξ=θ(τ)). Then the accuracy of the calculated point of the transition to a different area is further improved using bisection method, until the desired accuracy is reached. After that, a new trajectory piece is calculated the same way starting from the calculated transition point as the initial point. Trajectory pieces are calculated until the time or the number of stick motion interval reaches the defined limit.
To build a bifurcation diagram, one of the parameters is selected to be varied and its range is selected. Then for each value in the range its own trajectory is calculated, with all the other parameters having the same values for each trajectory. To build the graph, a certain number (usually 30) of last intervals of stick motion are taken and displayed for each trajectory.
1.4. The results of numerical calculations
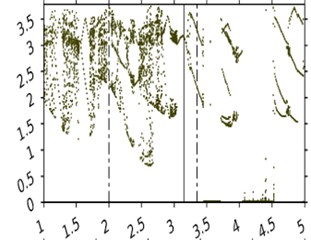
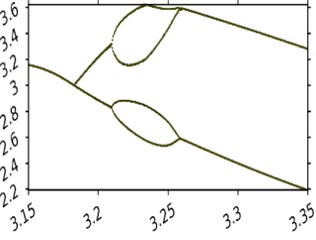
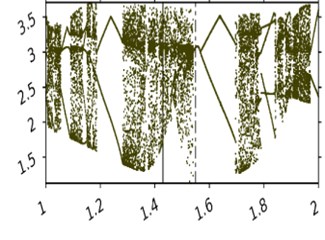
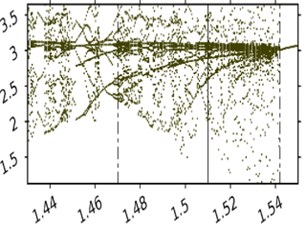
Fig. 4 displays a bifurcation diagram with Ω as the variable parameter. The other parameters’ values are: θ(τ)=0.1cos(Ωτ)+1.41, ε*=3. Fig. 5(a) displays a diagram with parameter Ω range from 1 to 5, the other subfigures show different subintervals of that.
Fig. 4 shows that depending on the frequency of the belt movement, the system can display different types of dynamic behavior, including chaos. It should be noted, that with the increase of the frequency chaos become less frequent.
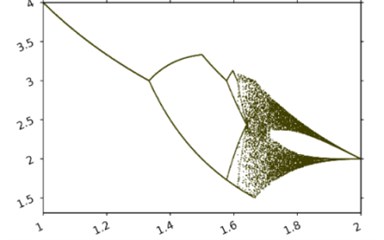
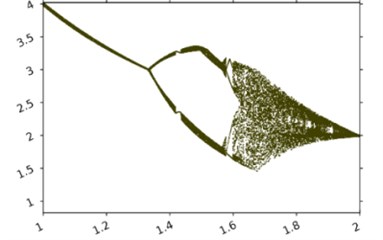
Fig. 5 displays diagrams with A as the variable parameter and θ(τ)=Acos(Ωτ)+1.41, ε*=3. Ω=1.466 on Fig. 5(a) and Ω=3.23 on Fig. 5(b).
Fig. 5 shows the influence of the increase of the amplitude of the belt oscillations on the dynamics of the system. Two conclusions can be made based on it. One, the increase of the amplitude from zero and within a small vicinity of zero changes the dynamics of the system gradually, without sudden qualitative changes.
Fig. 4Bifurcation diagrams in frequency Ω tape oscillation
a)
b)
c)
d)
Fig. 5The bifurcation diagram of the amplitude A fluctuations tape
a)
b)
2. Conclusions
This paper studied the dynamics of a vibration system with hereditary friction. Under the influence of an external periodic force. The obtained bifurcation diagrams of the system revealed the main regimes of periodic and stochastic motions as functions of the governing parameters of the system:
1) As the amplitude of the external force increases, the bifurcation diagrams get “blurred” in relation to the case of no external force. This indicates the appearance of chaos, limited by the amplitude of the external force. As the amplitude of the external force grows further, periodic motions are born with one long stop. In the last case the system behaves as if there was no external force.
2) Increase of the frequency of the external force leads to chaotization of the motions. High frequencies lead to the birth of periodic motions with a finite number of long stops
References
-
Ishlinskiyi A. Yi., Kragelskiyi I. V. About racing in friction. Journal of Technical Physics, Vol. 4/5, Issue 14, 1944, p. 276-282, (in Russian).
-
Kahenevskiyi L. Ia. Stochastic auto-oscillations with dry friction. Inzh-fiz Journal, Vol. 47, Issue 1, 1984, p. 143-147, (in Russian).
-
Vetukov M. M., Dobroslavskiyi S. V., Nagaev R. F. Self-oscillations in a system with dry friction characteristic of hereditary type. Proceedings of the USSR Academy of Solid Mechanics, Vol. 1, 1990, p. 23-28, (in Russian).
-
Metrikin V. S., Nagaev R. F., Stepanova V. V. Periodic and stochastic self-oscillations in a system with dry friction hereditary type. Journal Applied Mathematics and Mechanics, Vol. 5, Issue 60, 1996, p. 859-864, (in Russian).
-
Leine R. I., van Campen D. H., Kraker A. D. E. Stick-slip vibrations induced by alternate friction models. Journal Nonlinear Dynamics, Vol. 16, 1998, p. 41-54.
-
Leine R. I., van Campen D. H., Kraker A. D. E. An approximate analysis of dryfriction-induced stick-slip vibrations by a smoothing procedure. Journal Nonlinear Dynamics, Vol. 19, 1999, p. 157-169.
-
Leine R. I., van Campen D. H. Discontinuous fold bifurcations in mechanical systems. Archive of Applied Mechanics, Vol. 72, 2002, p. 138-146.
-
Feygin M. I. Forced Oscillations of Systems with Discontinuous Nonlinearities. Science, 1994, p. 285, (in Russian).
-
Neymark Iy. I. The Method of Point Mappings in the Theory of Nonlinear Oscillations. Science, 1972, p. 471, (in Russian).
-
Shuster G. Deterministic Chaos. Peace, 1988, p. 237, (in Russian).
About this article
Development of mathematical model is financially supported by Russian Science Foundation, Project No. 16-19-10237. Investigation of numerical results was financed within the framework of the base part of State Task of the Ministry of Education and Science Project, No. 2014/134 2226.
