Abstract
A track-borne energy transducer is a smart device for harvesting energy of trains or rail transportation systems. In this paper, the authors extend this application through introducing two scenarios of energy harvesting from train-induced wind. A Computational Fluid Dynamics (CFD) model considering track-borne energy transducer is constructed and simulated. For rail-borne piezoelectric approach, the voltage and air pressure profile of the piezoelectric transducer are recorded, indicating a peak-peak output voltage of 1 V under condition that the bluff train body (metro line vehicle) travels over the rail-borne device at a speed of 5 m/s. For track-borne wind turbine generator, the simulated results indicate that the optimal position of wind turbine locates at the bottom of (under) the bluff body; whereas it locates at the side for the streamlined train. Wind tunnel tests are conducted for understanding the electric characteristics of the track-borne wind turbine harvester. Different setup configurations are compared by changing the wind turbines’ position, types of blades, and types of train body. For large-scale horizontal-axis wind turbine, an average voltage of 48.8 V and an optimal power of 5 W are achieved at 1:20 scaled model, 10 m/s wind speed, and 470 Ohm resistance. For vertical-axis bottom-mounted wind turbine, an average voltage of 2.48 V and an optimal power of 110 mW are achieved at 1:20 scaled model, 10 m/s wind speed, and 56 Ohm resistance.
1. Introduction
1.1. Motivation
Rail transport, as a means of high levels conveyance of passenger and cargo, plays an important role in our daily life. The building of rail infrastructure has experienced a sustainable growth in the past decade, especially in some developing countries. However, in remote area it is difficult to ensure power supply of rail-side monitoring equipment. It is therefore necessary to develop a new energy strategy to resort to renewable energy sources. Actually, Germany has already engaged in covering more than one-third of its annual twelve billion kilowatt-hour energy requirements for the railway network with renewable sources by 2020 [1].
1.2. Review of the state of the art
With regard to energy harvesters specified for transportation area, piezoelectric energy harvesting technology was widely investigated and application of piezoelectric pavement for highway traffic monitoring had been reported [2, 3]. Nelson et al utilized both an inductive voice coil located near the rail and a piezoelectric device mounted under the rail for power harvesting for track monitor [4]. Wang et al. designed a mechanical power harvester with rack pinion, flywheel, and rotationally electromagnetic generator [5]. Yuan et al. conducted a comprehensive investigation of piezoelectric drum transducer for energy generating on running urban vehicles [6]. The test results showed an rms output power of 0.081 mW under full load condition of shanghai urban. The peak open-circuit voltage could be 50-70 V. Besides track-borne energy harvester, Pasquale et al. designed a bogie-borne energy harvester with magnetic suspensions [7]. The device with package of 150×125×95 mm could generate 100 mW power output tested on a scaled roller rig, which simulated the freight train velocity of 80 km/h. In our previous study, we also investigated the vibration response of a high-speed railway with the piezoelectric and electromagnetic energy transducer [8, 9].
Above mentioned works focus on the energy harvesting of track or vehicle vibration, which is usually depended on the specific construction of track structure, track stiffness, and track irregularity. While there is another approach, by utilizing vortex-induced vibration around bluff body, to realize energy harvesting in railway industry. Lee and Kwon proposed a solution of using small wind turbines for improving the aerodynamic performance of bridge as well as harvesting wind-energy [10]. Hobbs and Hu designed a piezoelectric energy harvester similar to tree trunks swaying in the wind by exploiting vortex-induced vibration generated by downstream cylinders [11]. Inspired by those researches, the authors in this paper develop a track energy harvester for capturing wind-induced vibration energy caused by running vehicles. This technology contributes to resolving the power supply problems of rail-side monitor equipment’s cross remote areas and benefit the developments of smart rail grids.
1.3. Scope of paper
Wind power as renewable, widely distributed, and clean energy has great potential. However, to utilize the train-induced wind, following points must be addressed: 1) the influence of energy harvester to the train aerodynamics; 2) the optimal position to install the energy harvester; and 3) the electric characteristics and power generating capacity of track-borne energy harvester. Section 1 of this paper presents the review of the state-of-the-art of track-borne energy harvester in railway industry, which inspired the author to conduct this study. To address aforementioned points 1) and 2), Section 2 gives the computational fluid dynamics model to analyze the influence of piezoelectric transducers and wind turbine harvesters to the train aerodynamics; Effective Wind Power Density is defined to evaluate the optimal position for the track-borne wind turbine. Information about geometry, train profile, grid independence, turbulence model, solving and accuracy is also described. To address point 3), we designed two scenarios: rail-borne piezoelectric energy harvester and track-borne wind turbine generator. We conducted lab tests, field tests, and wind tunnel tests and related information is introduced in Section 3. Results of both the CFD calculation and tests are revealed in Section 4.
2. Computational fluid dynamics simulation
2.1. Geometry
To study air flow field around train, two typical train profiles are implemented into the CFD (Computational Fluid Dynamics) analysis. Bluff body is represented by a low floor tram model based on the Siemens Combino Supra Budapest NF 12B, which are 53.99 meters long, a world record for passenger trams (only exceeded by the 59.4 m CarGoTram of Dresden). High Speed Train designed by Victor Bonavarte stands for streamlined body with 62.93 meters long (as shown in Fig. 1). Detailed dimensions are illustrated in Fig. 2.
Fig. 1Train body used in CFD analysis
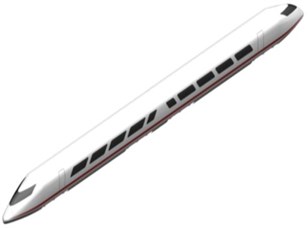
a) Streamlined body
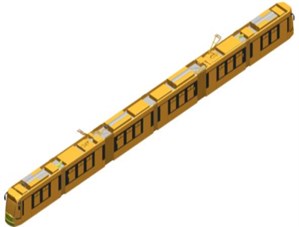
b) Bluff body
Fig. 2Detailed profile dimensions of train head
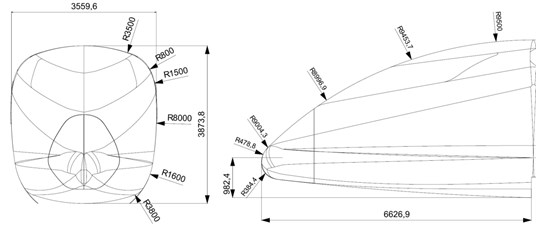
a) Dimension of streamlined train body
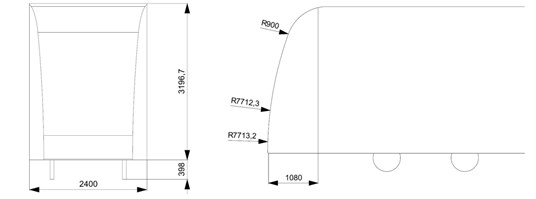
b) Dimension of bluff train body
The complete 3D models of both the streamlined and bluff train are highly-complicated, including many detailed small features. This geometry complexity could result to excessive meshing scale. Therefore, a cleaning-up of the CAD-model is implemented by NX CAD Tools. Detailed features such as pantographs, power connections, and rearview mirrors, etc. are removed.
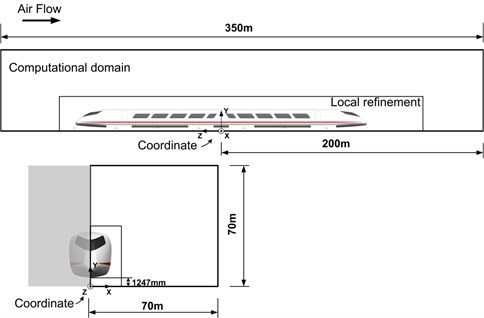
Fig. 3 illustrates the definition of computational domain and coordinate system. The length of the computational domain is 150 m in front of the coordinate system, and 200 m behind the coordinate system to consider the vortex separation at the wake flow zone. The width of the computational domain is 70 m. The height of the computational domain is 70 m. An inner virtual box is necessary for local refinement to guarantee the mesh control near the train body. This virtual box extends 50 m in front of as well as to the sides and to the top of the train, and 100 m in the wake of the train.
Fig. 3Computation domain and coordinate system
2.2. Grid
As a first step, a coarse grid with about 5.5 million mesh cells is utilized for the bluff train body by realizable - turbulence model. To conduct the grid independence analysis, we further use a finer mesh with 11 million cells by realizable - turbulence model. Compared with the higher order turbulence model such as RSM, the realizable - turbulence model consumes less CPU hours and could also achieve acceptable calculation accuracy. Table 1 shows the results for drag coefficient .
The control strategy is used for meshing (either for tetrahedral or hexcore meshing). In this strategy, virtual box is used for local refinement. In addition, several name selections for velocity inlet, pressure outlet, symmetry wall, train body, wheelset, and wind turbines are defined. Surface meshing functions are attached to these name selections. To handle problems caused by geometric details (e.g. narrow gaps and sharp angles), it is important to control the overall mesh quality (skewness). Since layered elements adapt well to the flow near train boundaries, we set mesh elements extruded from the train surface to create a closed O-type grid. Extrusion by a specified value of cell aspect is implemented into all surface prism layers on the train. We use first aspect ratio of 5, geometric growth rate of 1.2, and number of layers of 5 in the CFD model. The rest of the domain is meshed by hexahedral and tetrahedral elements. In this study, the quality of grids is controlled to have the skewness below 0.85 for the whole domain.
Table 1Comparison of CD, ∆CD, CPUhs
Grid size and turbulence model | CPUhs | ||
Wind-tunnel experiment | 0.388 | ||
Coarse mesh (5.5 million cells) realizable - | 0.411 | 6 % | 24 |
Fine mesh (11 million cells) realizable - | 0.396 | 2 % | 70 |
Fine mesh (11 million cells) RSM | 0.390 | 0.5 % | 168 |
2.3. Solving and accuracy
The quality of the turbulence modeling determines the accuracy of CFD calculation for turbulent flow analysis. This is more obvious for the rail transportation vehicle due to the associated salient flow features. Normally, the flow around passing train is characterized by 3D boundary layers with flow separation, strong vortices, and complicated curvature. Thus, the turbulence models for solving flow around rail transportation vehicle must be capable of properly elucidating the anisotropy and non-equilibrium effects.
Based on this experience and practice, it is recommended to use following turbulence models for investigation the flow features of rail transpiration vehicle: Realizable - Model and Reynolds Stress Model (RSM). Industrial applications of realizable - model show that it could achieve good results regards to drag coefficient, lift coefficient, and pressure coefficient, whose accuracy are within 2-5 % [12, 13]. It is very stable and can converge fast; thus, it has suited well for automated calculation processes. By utilizing realizable - model, we could achieve a large mesh-scale calculation in a relatively small time period. Reynolds Stress Model (RSM) takes the anisotropy of turbulence and the transport of all Reynolds Stresses into consideration, whereas it consumes much more computational time (+40 %) and requires higher RAM resources (+20 %) [14].
We utilized - model in our CFD simulation of train-induced air flows. The model introduces two additional transport equations and two dependent variables: the turbulent kinetic energy , and the turbulent dissipation rate . The turbulent viscosity is modeled as :
The transport equation for reads:
The transport equation for reads:
where is the production term, , , , , and are model constant:
where is the density (SI unit: kg/m3), is the velocity vector (SI unit: m/s), is the pressure (SI unit: Pa), is the absolute temperature (SI unit: K), is the dynamic viscosity (SI unit: Pa·s).
We define a monitor point for velocity vortex average at a specified point in the wake region of the train and monitor the lift, drag, and pitching moment of the vehicle to judge the convergence of the CFD model. 500 iterations are requested. The flow field is initialized by hybrid initialization method. We conduct stable state calculation with coupled pressure-velocity coupling scheme. Second order upwind for momentum, second order for pressure, and lease squares cell based for gradient are enabled. We set flow courant number to 50, explicit relaxation factors to 0.25 for both momentum and pressure.
We chose FLUENT software package. It includes non-equilibrium wall functions (NWF), which are very sensitized to pressure gradient effects and thus has advantage over the traditional wall-functions for the prediction of ground-vehicle (rail transportation vehicle) aerodynamics. NWF’s could account for the effects of local thickness variation of the viscous sub layer. By means of desired y plus wall function values, FLUENT calculates an average surface element size. It also decides the grid scales and calculation resolution. Depended on the free flow velocity and requirement of surface resolution, FLUENT users can determine the average element length by literature [15].
2.4. Key identifier for evaluating optimal position to install wind turbines
In order to obtain EWPD (Effective Wind Power Density), the value of wind speed in real cases (i.e. wind induced by passing vehicle) is required. This can be derived through coordinate transform; the moving direction of vehicle is defined as the positive direction:
where is the speed of train-induced wind in the real case, is the vehicle speed in CFD simulation, is the velocity of coordinate transform.
The effective wind power density can be calculated by:
It should be noted that the EWPD will be calculated only when the wind speed is larger than 3 m/s, because we need a threshold speed value to enable the wind turbine. The unit of EWPD is W/m2, indicating the wind power per unit area when the train passes.
3. Material and methods
3.1. Lab and field test of rail-borne piezoelectric energy harvester
We conducted both experimental test and field test. For the experimental lab test, 60 kg/m rail was put onto two rigid blocks with longitudinal spacing of 0.6 m to simulate the concrete sleeper. Rail pads with stiffness of 40 kN/mm were selected, to control the displacement of rail under 40 kN-80 kN load. The loading arm, hanging under gantry frame, was driven by hydraulic system, and the wave profile of the excitation load was editable and could be displayed on workstation and was inputted into control cabinet, which then controlled the hydraulic system for driving the loading arm. Oscilloscope (Tektronix TDS2004C) with voltage probe of 10X attenuation was connected to the piezoelectric transducer. Displacement meter NS-WY02 and accelerometer LC0108(T) were used and connected to data acquisition system imc CS-5008-1(imc Meßsysteme GmbH) to obtain displacement and acceleration value. The sampling data from oscilloscope was recorded and transferred to local computer for analysis afterwards.
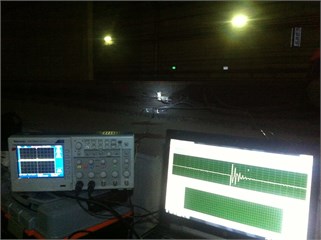
The field testing was carried out at one section of Shengxian Lake Station, Metro line 1, Chengdu, China. The piezoelectric transducer was mounted to the rail foot through a pair of specific-designed clamp. Two differential pressure transmitters (CCY11, Beijing Star Sensor Tech. Co., LTD.) were mounted to the concrete foundation nearby. We chose voltage mode differential pressure transmitter with 0-10VDC output, representing 0-2 kPa pressure difference. Oscilloscope (Tektronix TDS2004C) with voltage probe of 10X attenuation was connected to the anode and cathode of piezoelectric transducer and to the differential pressure transmitters. The oscilloscope served as a data sampling device and was connected to the lab top with Labview Signal Express software. By this way, we can activate the auto trigger/record mode and realize continuous data sampling. The data were stored into Laptop hard drive.
We designed three set-ups for the piezoelectric device. Clamped cantilevered beam with/without tip mass were tested, respectively. The harvester was connected, via rail bottom clamp, to the 60 kg/m UIC rail. As illustrated in Fig. 4, the harvester was comprised of PZT film, copper substrate, Nylon grip block, rail bottom clamp, and screws. Rail bottom clamp was made of Aluminum with anodizing for corrosion protection, the profile of clamp was compatible with rail format of 50 kg/m, 60 kg/m, and 75 kg/m, and thus can serve as an interchangeable part for high-speed and heavy load application.
Fig. 4Field test setup of piezoelectric energy harvesting under train-induced wind
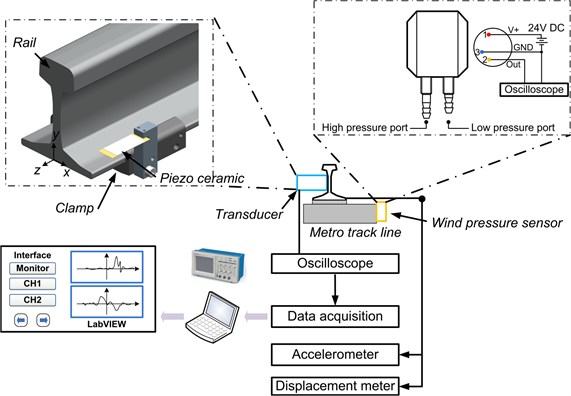
Table 2Material property of PZT ceramic
Property | Units | Symbol | PZT (P-33) |
Electromechanical coupling factor | 0.6 | ||
0.36 | |||
0.70 | |||
0.70 | |||
0.47 | |||
Relative permittivity | 1725 | ||
Vacuum permittivity | 10-12F/m | 8.85 | |
Loss tangent | tan | 0.02 | |
Compliance constant | 10-12m2/N | 15 | |
9 | |||
25 | |||
Piezo strain constant | 10-12m/v or C/N | 160 | |
390 | |||
480 | |||
Mechanical quality factor | 75 | ||
Frequency constant | Hz-m | 1950 | |
1470 | |||
1880 | |||
1130 | |||
2250 | |||
Acoustic speed | m/s | 3000 | |
2940 | |||
3760 | |||
2260 | |||
4500 | |||
Acoustic impedance | 106kg/m2-sec | 30 | |
Curie temperature | °C | 335 |
Table 3Testing setups
Device parameter | Setup 1 | Setup 2 | Setup 3 | Total dimension | Track |
Description | One end clamped, one end free, without tip mass | One end clamped, one end free, with tip mass | One end clamped, one end free, with tip mass | Length 200 mm Width 170 mm Height 80 mm Device dimension: Length 80 mm Width 30 mm Height 15 mm | UIC60, Section Weight 60 kg/m, Rail height 172 mm Head width 72 mm Web thickness 16.5 mm Foot width 150 mm |
Thickness of piezoelectric layer (mm) | 0.3 | 0.3 | 0.3 | ||
Thickness of copper electrode (mm) | 0.3 | 0.3 | 0.3 | ||
Width of beam (mm) | 30 | 30 | 30 | ||
Weight of mass block (g) | 0 | 30 | 60 |
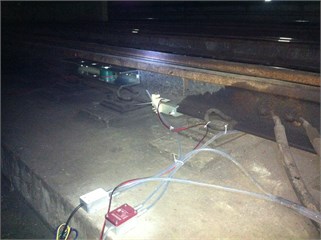
Fig. 5Field test configuration at section of Chengdu metro line
The detailed parameters of PZT and harvester set-ups were listed in Table 2 and Table 3. Three set-ups were configured by variation of cantilever tip mass.
3.2. Wind tunnel tests
To investigate the electric characteristics and evaluate power generating capacity of wind-turbine subjected to the train-induced wind, we conducted wind tunnel tests. As illustrated in Fig. 6, the model scale is 1:20, typical train profiles with bluff and streamlined bodies are custom-made.
Fig. 6Wind tunnel test setup
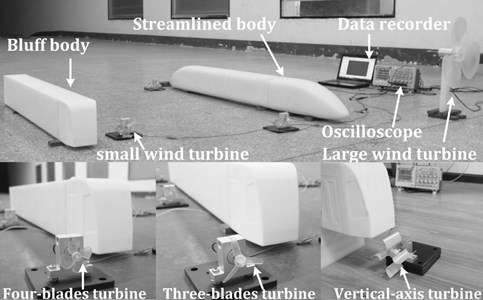
An oscilloscope (Tektronix TDS2004C) with a voltage probe of 10X attenuation was connected to the wind turbine generator. The sampling data from the oscilloscope were recorded and transferred to a local computer for subsequent analysis. The oscilloscope served as a data sampling device and was connected to the laptop with LabVIEW Signal Express software. In this way, we can activate the auto trigger/record mode and realize continuous data sampling. The data were stored on the laptop’s hard drive.
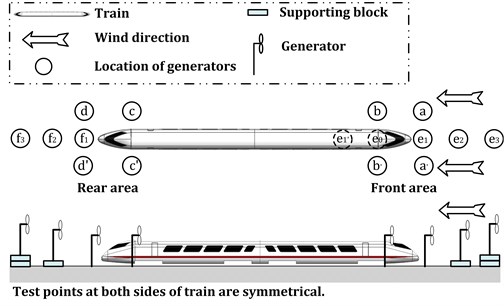
The height of each supporting block equals 15 mm. Each type of train body has 16 testing points; each point has zero or two supporting blocks, corresponding to 0 mm to 30 mm height. Both HAWT (horizontal-axis wind turbine) and VAWT (vertical-axis wind turbine) are tested. And two types of horizontal-axis wind turbine blades, three-blades and four-blades are tested.
Fig. 7Test configurations of wind turbine generator
4. Results and discussion
4.1. Results of rail-borne piezoelectric energy harvester
Pressure coefficient of streamlined and bluff train body in turnout area and in tunnel is illustrated in Fig. 8.
Fig. 8Pressure coefficient of streamlined and bluff train body – CFD simulation
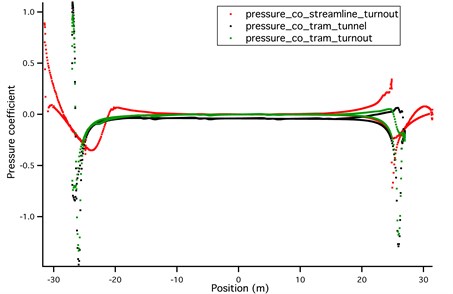
The value of each point is extracted from mesh nodes of train body’s vertical cross cut section ( plane at 0). So, there are two curve profiles, representing upper surface outline and lower surface outline of train body, respectively. It was known that streamlined body and bluff body have different trait. For high Reynolds number flow around streamlined body, it was characterized by wake turbulence without flow separation, while for that of bluff body; it was characterized by wake turbulence with flow separation. The generation and development of wake flow vortex generated vibration wave over PZT film and enabled the piezoelectric transducer for energy harvesting. This vortex-induced vibration wave was caused by the pressure variation over PZT film, which is shown in Fig. 9.
As shown in Fig. 4, the harvester device was mounted to the rail in parallel. The device, besides sustaining wind pressure loads, was also subjected to the vibration generated by the wheelset/track system. In order to distinguish the contribution of wheelset/track interaction-induced vibration from wind flow induced vibration of PZT film, we conducted lab test with different set-ups in Table 3. The voltage profile of lab test is recorded in Fig. 10.
Fig. 9Variation of pressure distributions on piezoelectric ceramic film in vertical plane (ZY plane, X= 0) – CFD simulation
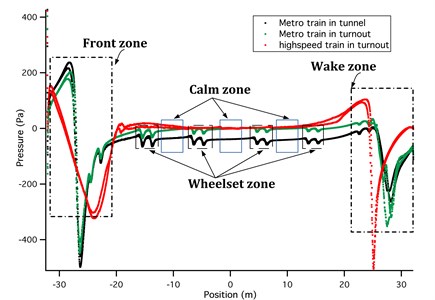
Fig. 10Voltage at 5-7 Hz excitation, 0.2-0.4 mm amplitude railway vibration – Lab test
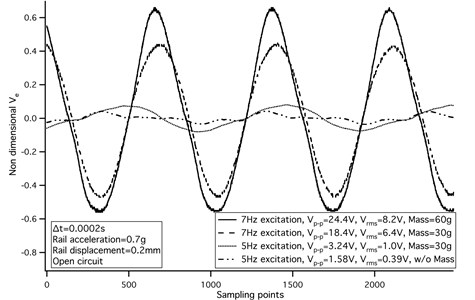
Fig. 11Voltage and wind pressure profile of piezoelectric ceramic film transducer under 5 m/s bluff train body – Field test
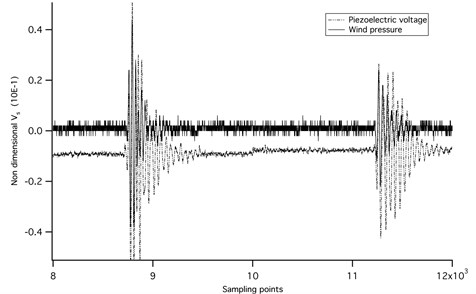
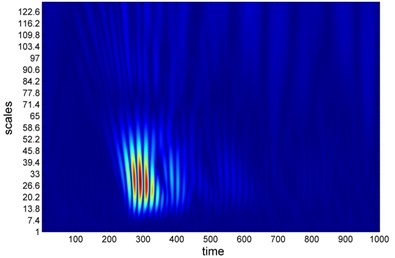
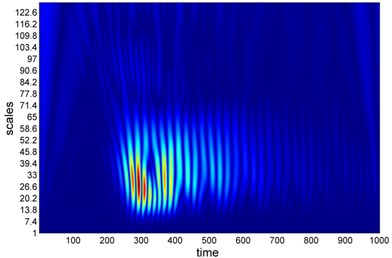
Sampling interval is 0.0002 s, horizontal ordinate represents number of sampling points, and vertical ordinate represents the open circuit voltage. Band width of oscilloscope is 20 MHz. At frequency of 7 Hz, the harvester generated a peak-peak voltage of 24.4 V and a RMS voltage of 8.2 V. The rail acceleration was 0.7 g and the amplitude of rail displacement equaled to 0.2 mm for 7 Hz and 0.4 mm for 5 Hz. With piezoelectric transducer set-up01, we conducted also the field test at turnout area, section of Shengxian Lake Station, Metro line 1, Chengdu, China. Both time-domain voltage and air pressure waveform were recorded for 120 hours and one section of the data pool is illustrated in Fig. 11. Time-frequency transform and wavelet analysis are shown in Fig. 12. The abscissa stands for time position of signals and the ordinate stands for the specified scales of the wavelet. Coefficients represents a matrix with the number of rows equal to the length of scales and number of columns equal to the length of the input signal. The -th row of coefs corresponds to the CWT coefficients for the -th elements in the scales vector. Field test configuration at section of Chengdu Metro line is shown in Fig. 5.
Fig. 12Wavelet transforms of voltage a) and wind pressure b) of bluff train body at speed of 5 m/s b) – field test
a)
b)
4.2. Discussion of rail-borne piezoelectric energy harvester
During the passing of a vehicle, the induced wind pressure over the rail-borne PZT transducer will vary with time. The profile of wind pressure variation over PZT transducer could be characterized by four action zones as shown in Fig. 9: front flow zone, wheelset zone, calm zone, and wake flow zone. It was also obvious that vehicle type and shape have a substantial influence on the pressure distribution and the resultant power output. The simulated results indicated that bluff train body could lead to an enhancement in vortex intensity of train body wake flow and thereby could result in a larger pressure over track-borne piezoelectric, whereas the streamlined train body could mitigate wake flow effect with reduced influence on the transducer system.
In our previous study, we programmed a script in MATLAB for calculating the vibration response of a track subjected to the travelling load of a vehicle. The frequency of the moving load excitation ranged from 1-7 Hz, which depended on the velocity and the gauge of the rolling stocks. To distinguish the influence of wind loads and wheelset loads on energy harvesting, we designed three set-ups for PZT ceramic film transducers and carried out the lab test. The PZT film itself was only sensitive to high frequency excitation; however, an added tip mass will shift the resonance frequency of PZT cantilever structure towards lower frequency brands. It was therefore expected to scavenge piezoelectric energy for tip-mass cantilever structure under wheelset loads. The hydraulic system in lab test was designed for providing up to 140 kN of low-frequency force in regard to the realistic axle load and rail vibration. The voltage output of set-up with 60 g tip mass was greater than that with 30 g tip mass. The voltage output of set-up without tip mass approximated zero.
The vibration of PZT film and the resultant power output are induced by wind flow around train body. Since the frequency of wind pressure around train body was above 100 Hz, whereas the wheelset/track interaction frequency ranged from 1-7 Hz, so the wind energy can be coupled into the PZT film which was sensitive to high frequency excitation. When the wind was generated by passing vehicles, the PZT film was excited to begin a forced oscillation. After the wind field faded away, the vibration of PZT film would still last for a while due to its free oscillation. This phenomenon can be clearly seen in wavelet plot, additional spectrum in piezoelectric voltage signals can be visualized. The wavelet results helped to establish a collection of time-frequency representations of the voltage and wind pressure signals, all with different resolutions.
The peak-peak voltage output of transducer in field test reached 1 V for wheelset zone at metro train speed of 5 m/s. The speed of metro line at this section was limited due to several reasons: 1) Chengdu metro line 1 is an operating line, our testing equipment was mounted on the rail during the skylight time between 1:00 am to 5:00 am; 2) the field test section was a turnout area. We could expect much higher power output at higher speed since the wind forces are proportional to square of velocity. At typical metro train speed of 80 km/h, it is expected to have 20 times more power output. The calculated peak-peak voltage reached 20 V at metro train speed of 80 km/h.
After we viewed the profile of voltage and pressure output in further details, it was interesting to find that the waveform of the signals can also be utilized as a way of monitoring. For example, the time period of wheelset zone was 0.5 s (2500 sampling points at sampling period of 0.0002 s), while the bogie axle spacing was 2.5 m, and thus the train speed can be calculated as 5 m/s, which was exactly the true value of the passing vehicle. It might be possible to deduce more information about vehicle/wheelset/track status through detailed analysis of the output signals, which needs further investigation.
4.3. Results and discussion of track-borne wind turbine
The origin of coordinates and the positive directions of -axis and -axis are shown in Fig. 3 and the forward direction of train is defined as the positive direction of the -axis. Fig. 13 and Fig. 14 show the effective wind power density at selected calculation points for bluff and streamlined bodies.
Fig. 13EWPD and positions of wind turbine generator for bluff train
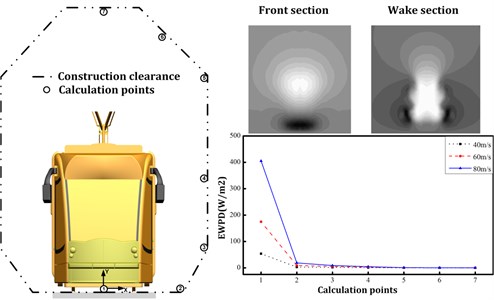
By consideration of the railway structure gauge, 7 points were chosen as illustrated by circle symbols from No. 1 to 7. The CFD model was axisymmetric ally established. We removed speed values that were less than 3 m/s to calculate the effective wind power density (EWPD). The EWPD, as a key parameter, is used as an identifier in this paper to evaluate the available wind power at different calculation points. The results indicated that the EWPD is proportional to the cube of vehicle speed. For bluff train, the maximum EWPD was achieved at No. 1 calculation point; whereas for streamlined train, No. 2 calculation point captured a maximum value of EWPD. Therefore, it is suggested that the wind turbine generators should be mounted under the bottom of the passing vehicle for track line with bluff train; and for high-speed track line with streamlined train, it is better to install the wind turbine generators at either side of the rail track.
Fig. 14EWPD and positions of wind turbine generator for streamlined train
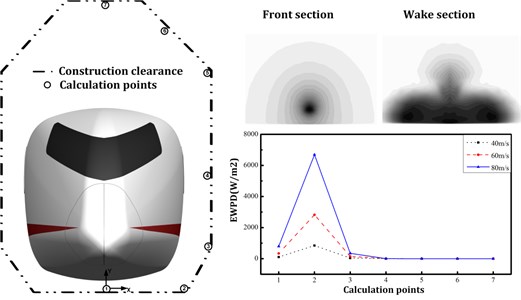
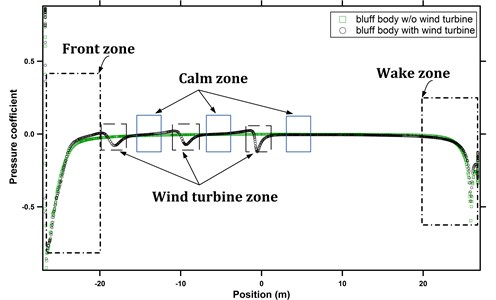
Fig. 15. Comparison of bluff train pressure coefficient
with/without wind turbine ( plane, 0)
Fig. 16Comparison of streamlined train pressure coefficient
with/without wind turbine ( plane, 0)
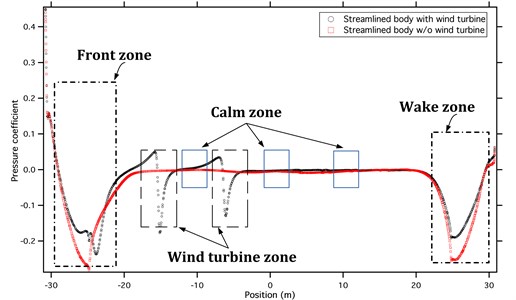
Fig. 15 and Fig. 16 show the pressure coefficient of bluff and streamlined bodies with/without wind turbines.
The origin of coordinate can be seen in Fig. 3. For plane, equals zero (intermediate cross-section of train). The solid circle represents the cases of train-body with side-mounted wind turbines; the green square stands for those of bluff body without wind turbine, and the red square indicates those of streamlined body without wind turbine. It is observed that the side-mounted wind turbines could reduce the pressure coefficient at both front and rear sections. This is more obvious for the streamlined train.
Fig. 17 and Fig. 18 represent the generated peak voltages of horizontal-axis wind turbine in wind tunnel test. stands for the three-blade wind turbine, indicates the four-blade wind turbine, and the values behind and stand for the height value of supporting block (unit: cm).
Fig. 17Voltage output in relation to different configurations of wind turbine for bluff train-body
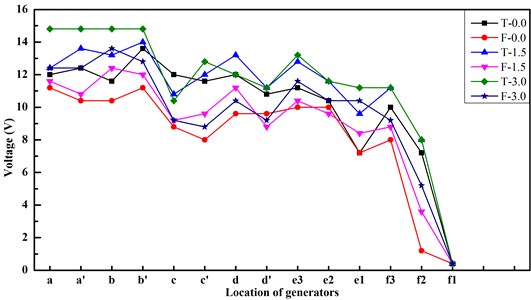
Fig. 18Voltage output in relation to different configurations of wind turbine for streamlined train-body
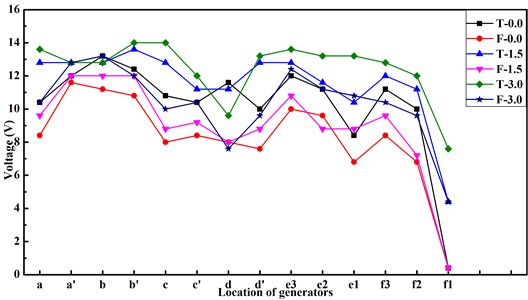
It is observed that the three-blade wind turbine could generate a higher voltage at the same position and height. It is found that for both types of wind turbine, the higher the supporting blocks, the larger the generated voltage. It is due to the stronger boundary effect when the generator is close to the ground. For same wind turbine at fixed height, the peak voltage varied also with the relation position between generators and the train. The maximum value was achieved at position b and b’; the minimum value was observed at position f1. This observation matches with the simulation results. The suddenly change of train section profile will lead to a significant fluctuation of the air flow velocities, and thus the corresponding fluctuation of peak voltage. This fluctuation is obvious in the wake flow section (i.e. f1, f2, and f3). Compared with the results of streamlined train-body, the value of peak voltage changed dramatically in the wake flow area of bluff train-body. This can also be explained by the facts that the streamlined train-body has better aerodynamic trait. Based on the results, we suggest that three-blade wind turbine is preferred for track-borne wind power harvesting. A suitable height of wind turbine is also important to eliminate the boundary effect close to the ground.
Fig. 19 shows the voltage profile of wind turbine generators. The waveform was quite stable with ripple voltage less than 3 V.
In real cases, the train-induced wind might not be stable, depending on the vehicle speed and environmental wind; but a bridge rectifier and DC-DC converter circuit could be used to converse and store the generated electric energy captured from the train-induced wind. Here we have a good base to work on, because the voltage amplitude of wind turbine generator is quite large (10 V to 70 V in our test with small or large horizontal-axis wind turbine; 3 V to 5 V with vertical-axis wind turbine). The internal resistance is also suitable (less than 1 k Ohm); whereas the piezoelectric material is limited by its huge internal resistance (103 k Ohm). For most of rail-side monitoring sensors, the required voltage is 3.3 VDC, 5 VDC, 12 VDC, or 24 VDC. After connecting to a bridge rectifier (a 0.7 V to 1.4 V voltage drop-off), we still have enough voltage and power to enable the DC-DC converter.
Wind turbine generator should be connected to an external load to power other monitoring sensors. The generator has an internal resistance; thus, an optimal power output can be achieved only when the external load resistance matches with the internal one. Fig. 20 shows the voltage and power output in relationship to load resistance.
Fig. 19Voltage profile of track-borne wind turbine
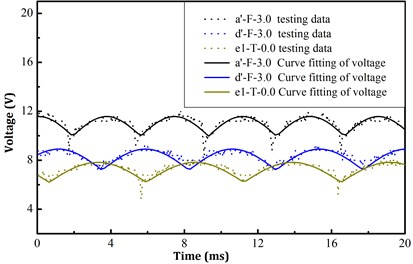
Fig. 20Voltage and power output of wind turbine in relation to load resistance
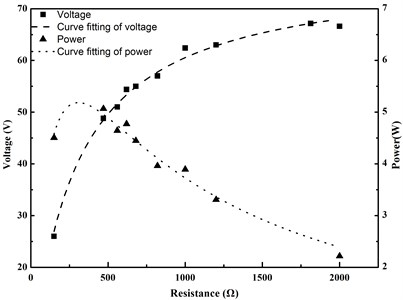
In case the load resistance was very low, a great voltage drop happened across the generator and thus output voltage was limited; on the other hand, when the load resistance approached infinite, the situation was equivalent to the case of open circuit, and therefore a maximum voltage happened. When the load resistance equaled to the internal resistance of wind turbine generator, an optimal power output was generated as expected. The dash line represents the curve-fitted value and the square and triangle marker stand for testing results. For large scale, horizontal-axis wind turbine (as shown in Fig. 6), the power in the tests reached 5 W with voltage of 48.8 V at resistive load of 470 Ohm. For small scale, vertical-axis wind turbine, the power in the tests is 110 mW with voltage of 2.48 V at resistance load of 56 Ohm. The typical power consumption of sensor devices such as accelerometer, displacement meter, inclinometer, strain gauge, and temperature and pressure transducers ranges from 10 mW to 720 mW. Thus, with suitable configurations of several vertical-axis and horizontal-axis wind turbines, enough power supply can be ensured to establish a self-powered sensor node for monitoring the track condition.
5. Conclusions
This paper investigated the possibility of energy generation of track-borne energy harvester by train-induced wind. Wind field of both streamlined train body and bluff train body were analyzed. To realize the calculation of wind pressure, wake flow field, and pressure distribution, a CFD simulation model was developed to calculate the wind pressure variation of the piezoelectric transducers, which was subjected to a travelling vehicle. The k-ε turbulence model was applied on the simulation model to visualize the vector field of wake flow vortices. The results indicated that bluff train body could lead to an enhancement in vortex intensity of train body wake flow and thereby could result in a larger pressure variation over track-borne energy transducers, whereas the streamlined train body could mitigate wake flow effect with reduced influence on the transducer system. The piezoelectric transducers were then mounted to the rail of turnout area at Chengdu metro line 1 for field test. The recorded wind pressure and voltage signals were analyzed by wavelet time-frequency transform. Compared with the normal track line, it is observed that the energy transducer could scavenge energy with peak-peak voltage 1 V at wheelset zone for bluff train body at vehicle speed of 5 m/s. It is expected to have over 20 V voltage output at vehicle speed of 80 km/h. Furthermore, we tested the energy output of PZT film transducers with and without tip mass. Cantilevered PZT film without tip mass was finally utilized in the field test to remove the voltage contribution stemmed from wheelset/track interaction excitation.
The Effective Wind Power Density as an identifier was used to evaluate the optimal position of wind turbine generator on the track. The results indicated that the optimal position of wind turbine locates under the bottom of the bluff train; whereas it locates at the side for the streamlined train. Compared with the normal track line, it was also observed that the track side-mounted wind turbine could improve the train aerodynamics by reducing the drag force and pitching moment. According to the results of wind tunnel tests, for large wind turbine a voltage of 48.8 V and the optimal power of 5 W were achieved at wind speed of 10 m/s. The proposed solution, together with the rail-side monitoring equipment, could also facilitate the research of intelligent monitoring of rail transportation.
References
-
Siemens Online. Rail Electrification, http://www.mobility.siemens.com/mobility/global/en/rail-solutions/, 2016.
-
Guo L. K., Lu Q. Potentials of piezoelectric and thermoelectric methods on energy harvesting pavements. Transportation Research Board 95th Annual Meeting, Transportation Research Board, Washington, D.C., 2016.
-
Chiarelli A., Dawson A., Garcia A. Analysis of the Performance of an Air-Powered Energy-Harvesting Pavement. Transportation Research Record: Journal of the Transportation Research Board, No. 2523, Transportation Research Board of the National Academies, Washington, D.C., 2015, p. 156-163.
-
Nelson C. A., Platt S. R., Albrecht D., Kamarajugadda V., Fateh M. Power harvesting for railroad track health monitoring using piezoelectric and inductive devices. Proceedings of SPIE 6928: Active Passive Smart Structures Integrated Systems, San Diego, California, 2008.
-
Wang J. J., Penamalli G. P., Zuo L. Electromagnetic energy harvesting from train induced railway track vibrations. IEEE/ASME International Conference on Mechatronics Embedded Systems and Applications (MESA), Suzhou, 2012, p. 29-34.
-
Yuan T. C., Yang J., Song R. G., Liu X. W. Vibration energy harvesting system for railroad safety based on running vehicles. Smart Materials and Structures, Vol. 23, Issue 12, 2014, p. 1-14.
-
Pasquale G. D., Soma A., Zampieri N. Design, simulation, and testing of energy harvesters with magnetic suspensions for the generation of electricity from freight train vibrations. ASME Journal of Computational and Nonlinear Dynamics, Vol. 7, Issue 4, 2012, p. 614-620.
-
Gao M. Y., Wang P., Cao Y., Chen R., Liu C. A rail-borne piezoelectric transducer for energy harvesting of railway vibration. Journal of Vibroengineering, Vol. 18, Issue 7, 2016, p. 4647‑4663.
-
Gao M. Y., Wang P., Cao Y., Chen R., Cai D. J. Design and verification of a rail-borne energy harvester for powering wireless sensor networks in the railway industry. IEEE Transactions on Intelligent Transportation Systems, 2016, p. 1-14.
-
Lee S., Kwon S. D. Improvement of aerodynamics performance and energy supply of bridges using small wind turbines. ASCE Journal of Bridge and Engineering, Vol. 20, Issue 10, 2015.
-
Hobbs W. B., Hu D. L. Tree-inspired piezoelectric energy harvesting. Journal of Fluids and Structures, Vol. 28, 2012, p. 103-114.
-
Shih T.-H., Liou W. W., Shabbir A., Yang Z., Zhu J. A new k-ε Eddy viscosity model for high Reynolds number turbulent flows. Computers and Fluids, Vol. 24, Issue 3, 1995, p. 227-238.
-
Gibson M. M., Launder B. E. Ground effects on pressure fluctuations in the atmospheric boundary layer. Journal of Fluid Mechanics, Vol. 86, Issue 3, 1978, p. 491-511.
-
Speziale C. G., Sarkar S., Gatski T. B. Modelling the pressure-strain correlation of turbulence: an invariant dynamical systems approach. Journal of Fluid Mechanics, Vol. 227, 1991, p. 245-272.
-
Lanfrit M. Best Practice Guidelines for Handling Automotive External Aerodynamics with Fluent. Fluent Deutschland GmbH, 2005.
Cited by
About this article
This work was supported by the National Natural Science Foundation under Grant Reference No. 51425804. The authors would like to express gratitude to Prof. Lingkan Yao from Southwest Jiaotong University for helpful discussion. The authors would also like to thank Linda from GE Healthcare for language modification.
