Abstract
Plate-like structures in real mechanical system is always simplified and modeled as an elastically restrained thin plate loaded with stiffness or mass. The dynamic model of the plate distinguished with previous classic model is complex vibrational characteristics and merely proposed by numerical method. Accordingly, identification of harmonic load acting on this plate becomes difficult for hardly obtaining inverse equations or matrix from its response functions directly. To solve this problem, dynamic model of the plate is established by numeric method and combined with particle swarm optimization (PSO) method to reconstruct harmonic load by minimizing total error between vibration responses in identification and test. Then, it is used to deal with acceleration responses tested in an elastically supported plate derived by a harmonic load. Parameters of the harmonic load are identified and found to agree with those of real source by their comparison. Thus, it is concluded that harmonic load driving on the plate linked with elastic boundary and attachment can be identified accurately by proposed numeric model of this paper. Furthermore, acceleration distribution of the plate at modal frequencies and responses at different test point, which are acquired from identification and test, are demonstrated and discussed. It is revealed that the numeric model proposed in this paper identifies parameters of harmonic load mainly through tendency of vibration distribution on the plate, and the accuracies of its reconstruction results at some locations are limited.
1. Introduction
Plate-like structures widely exist and take important parts in mechanical system of spacecraft, ships and vehicles. Harmonic load on those structures cannot be measured or directly tested in some special environments, such as aerodynamic force on wings of flying vehicles. Meanwhile, those loads are often used as input sources for structural dynamic analysis and considered as important parameters in structural design or optimization stage [1-3]. Hence, it is essential to study an approach to identify harmonic load driving on those structures by using known results from vibrational test.
Identification of harmonic load acting on structure belongs to an inverse problem of structural analysis and these topics have been widely studied in recently years [4-6]. All these researches about load identification can be divided into direct methods and optimization methods [6]. The direct methods mainly include inverse method [7-11], regularization method [12, 13] and other numeric method [14, 15]. They are always used to perfectly solve the identification problem, whose model can be modeled by analytic method or described exactly by a mathematic method. When the identification model merely described and established by complex numeric method, calculation efficiency of the direct method will decline greatly and the optimization methods are prefer to be applied to reconstruct load [16-20]. The main idea of the optimization method is using optimizations method to make reconstructed response of the numeric model approaching to response in measurement, in which the process of solution is independent on inverse or regularization expressions of the numeric model. Thus, the more complex the numeric model is, the more advantages the optimization methods have.
The thin plate-like structure in engineering system is often simplified as an elastically restrained thin plate loaded with stiffness and masses [21]. In the model, rational and rotational stiffness linked to boundary of the plate are used to simulate elastic boundary. The stiffness and masses connected on the surface of the plate are applied to model structure fixed on the plate. Because of the complex numeric expression of the model, it is difficult to obtain inverse function of the plate and suitable to apply optimizations method to reconstruct harmonic load working on the plate. Hence, PSO method is introduced and applied to establish numeric model, in which the difference between reconstruction responses of built model and measurement are minimized to identify harmonic load. Then, acceleration response of a thin plate linked with elastic supports are tested and input into the model to reconstruct parameters of driving force. To validate the numeric modal, identification results and values of real load are compared to each other latterly. At last, the acceleration distribution of the plate at modal frequencies and acceleration response at different test point, which are obtained from reconstruction analysis and test, are compared to discuss accuracy of the model.
2. Theory of identifying harmonic load
2.1. Ideas of identification
In the problem of harmonic load identification,the structural parameters are always known or obtained previously. So, the dynamic model of the droved structure can be established by numerical method firstly. And the structural responses are calculated by suppositional input force fx at location (xF, yF) at different frequencies accordingly. Then, these results are compared with the tested results at same positions and frequencies to obtain total error, which is written as follows:
where εx,y is total error between the calculated and tested results in rang of analysis frequencies. A(xi,yi,ω) is acceleration tested at location (xi, yi) with driving force fs(ω), ¯A(xi,yi,ω) is acceleration response calculated from theoretic model with load fx(ω) at same location. At last, the minimum of the total error is obtained by using optimal method and the corresponded parameters of suppositional load in dynamic model are considered as the real load acting on the structure.
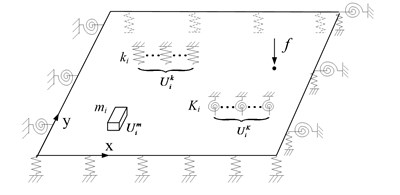
Fig. 1Sketch map of plate with arbitrary boundary and load
2.2. Dynamic theory of the thin plate linked with elastic supports and attachments
In real engineering system, the plate-liked structures are always connected to the other structures’ elastic boundary and jointed with mass or other elastic bodies. This situation can be simplified and shown as Fig. 1, in which harmonic load driving on plate is force fejω0t at location (xF, yF). The governing equation of the plate is written as:
-(ρhω2-∑Nki=1kiUki(x,y)+ω2∑Nmi=1miUmi(x,y))w(x,y)
-∑NKi=1Ki∂(UKi(x,y)w(x,y))∂x=fδ(x-xF,y-yF),
where ki, mi, Ki are the tensional stiffness, mass and torsional stiffness acting on plate separately; Uki(x,y), Umi(x,y), UKi(x,y) are their distribution functions accordingly; D, ρ, h are bending stiffness ,density and thickness of the plate; xF, yF is position of load and f is value of driving force.
The elastic boundary conditions are simplified and built as follows:
where, kx0, Kx0 are the tensional and torsional stiffness at location where x is equal to 0, kxa, Kxa are those parameters at location where x is equal to la; ky0, Ky are the tensional and torsional stiffness locating at y equal to 0; kyb, Kyb are those stiffness locating at y equal to lb; Qx, Qy, Mx, My are shear force and bending moment in x, y direction separately; la, lb are length and width of the plate.
According to reference [21], the numerical solution of the plate constrained with arbitrary conditions and different load is obtained as:
+∑4l=1(ξlb(y)∑∞m=0clmcosλamx+ξla(x)∑∞n=0dlncosλbny)).
The detail definition of the equation can be reached in reference [21]. Substitute the Eq. (4) substituted into Eq. (3) and multiplies ∑∞m=0∑∞n=0cosλamxcosλbny at its both sides. Then, the equation is integrated from 0 to la and 0 to lb with x, y variable at both sides and described in matrix form as:
where, K=¯K+BH-1Q,M=¯M+FH-1Q,Gmi=¯Mmia+Fmip,Gki=¯Mkia+Fkip,GKi=¯MKia+FKip. Ez is MN×MN diagonal matrix and TF is MN×1 matrix. The cell elements in above matrices are written as follows:
¯Mki,(mN+n,iN+j)=∫la0∫lb0Uki(x,y)(cosλamxcosλaix)(cosλbnycosλbjy)dxdy,
{Fki,(nM+m,l)=βln∑Mi=0∑Nj=0∫la0∫lb0Uki(x,y)(cosλamxcosλaix)(cosλbnycosλbjy)dxdy,Fki,(mN+n,l+4)=αlm∑Mi=0∑Nj=0∫la0∫lb0Uki(x,y)(cosλamxcosλaix)(cosλbnycosλbjy)dxdy,
¯Mmi,(mN+n,iN+j)=∫la0∫lb0Umi(x,y)(cosλamxcosλaix)(cosλbnycosλbjy)dxdy,
{Fmi,(nM+m,l)=βln∑Mi=0∑Nj=0∫la0∫lb0Umi(x,y)(cosλamxcosλaix)(cosλbnycosλbjy)dxdy,Fmi,(mN+n,l+4)=αlm∑Mi=0∑Nj=0∫la0∫lb0Umi(x,y)(cosλamxcosλaix)(cosλbnycosλbjy)dxdy,
¯MKi,(mN+n,iN+j)=∫la0∫lb0∂UKi(x,y)∂x(cosλamxcosλaix)(cosλbnycosλbjy)dxdy,
{FKi,(nM+m,lm)=βln∑Mi=0∑Nj=0∫la0∫lb0∂UKi(x,y)∂x(cosλamxcosλaix)(cosλbnycosλbjy)dxdy,FKi,(mN+n,ln)=αlm∑Mi=0∑Nj=0∫la0∫lb0∂UKi(x,y)∂x(cosλamxcosλaix)(cosλbnycosλbjy)dxdy,
TF(mn)=cos(λamxF)cos(λbnyF),
and αlm, βln, ¯K, ¯M, B, F, p, a are the same as those in reference [21].
The harmonic response of the plate at (xl, yl) position can be expressed in matrix form and written as:
where, p1 is 1×MN matrix, p1,κ=cos(λamxl)cos(λbnxl), κ=nM+m.
Set C=Ez(DK-ρhω2M)+∑Nii=1(kiGki)-∑Nmi=1(miω2Gmi)+∑NKi=1(KiGKi), Eq. (6) can be simplified by combing the Eqs. (6) and (7) as:
The corresponding acceleration at (x1, y1) point is:
2.3. Application of particle swarm optimization method
It is obviously seen that the object function of optimization depends on acceleration test results of an elastically supported thin plate by using Eq. (1). While, many uncertain factors, like errors of test system or differences between real and designed test system, could make measurement results having some uncertain properties. Then, the stochastic characteristics are transferred into object function through Eq. (1) and the optimization becomes an uncertain searching problem. Because deterministic optimization algorithm is always used to solve certain optimal problem, it is unsuitable for stochastic optimization in this paper and an evolutionary optimization algorithm should be selected to search minimum value of the object function.
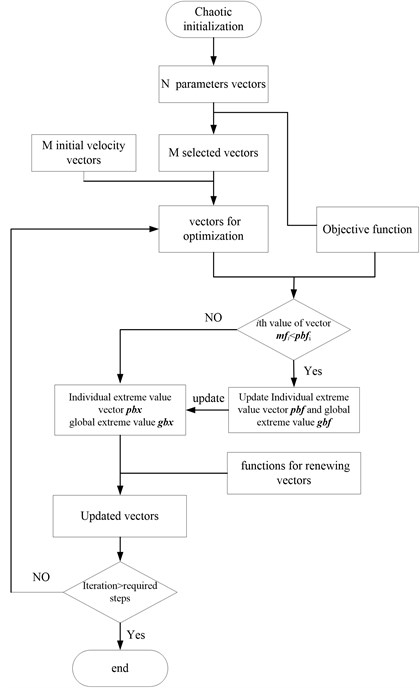
The PSO method is a stochastic evolutionary optimization algorithm and was originally proposed by Kennedy and Eberhart [22], based on the social behavior of collection of animals. It is applied to solve many optimization problems in identification related area with advantages of high efficiency and fast convergence [23-24]. Even for above mentioned applications, it has been reported that the PSO performs better than other evolutionary optimization algorithms in terms of success rate and solution quality [23-25]. In addition, it easiness of implementation makes it more convenient as it does not required specific domain knowledge information, internal transformation of variables or other manipulations to handle constraints. Furthermore, it is a population-based algorithm, so it can be efficiently parallelized to reduce the total computational effort [26]. Thus, the optimal method used to reconstruct parameters of load is selected as PSO technique and introduced into comparison between responses of numerical model and measurement. In this paper, the processes of optimization are executed as follow:
(1) Chaotic initialization. According to a typical chaotic system, each component values in the N-dimensional vector is D1=(d11,d12,…,d1n), in which elements d1n locate between 0 and 1. They are generated by Logistic Mapping iterative formula and shown as:
where i=1, 2,…, N, j=1, 2,…, N. Through solution of Eq. (9), N vectors are obtained and transferred to each parameter vectors of load zi inside their boundary. It can be written as:
where, zij is jth parameters value of load, tj, sj are top and bottom limits of the jth load parameters which are need to be identified. All those parameters are substituted into Eq. (8) to obtain structural acceleration response ¯A(xi,yi,ω) latterly. Then, the total error of every particle can be calculated by comparing analytic results ¯A(xi,yi,ω) with measurement results A(xi,yi,ω) and summarized in a matrix. From those results in the matrix, M solutions which are performed best in minimization of the errors εx,y are chosen as initial vector of location for optimization. Accordingly, M initial velocity vector vi, i=1, 2,…, M are generated randomly.
(2) Assign values of ith parameters vector zi to optimal positions of the individual particles vector pbxi which presents local optimization value of load identification parameters. Then, substitute them into the Eq. (8) to calculate acceleration responses. Through comparing acceleration of calculation and test by Eq. (1), the total errors εx,y are acquired and set as the individual particle extreme value vector pbf. Also, the global extreme value gbf and its corresponding reconstruction results gbx are obtained from particle extreme and position by searching the minimum total error.
(3) The particles move along the search space and exchange information with other particles to renew ith variable and load identification results, in accordance with the following equations:
where i= 1, 2,…, M; k= 1, 2,…, n; τ is weight factor, φ1 and φ2 are search parameters; r1 and r2 are two random numbers with uniform distribution in the range [0, 1]; [vmin, vmax] are the upper and lower limits of the parameter changes in each iteration.
(4) Substitute renewed load parameter ziinto Eq. (8) to obtain structural acceleration response. Then, the total errors between simulation and measurement are calculated with Eq. (1) and transferred into ith value of vector mfi. If mfi<pbfi, load parameters zireplace the optimal position of the individual particles pbxi and value of mfi is assigned to pbfi. Accordingly, all load parameter and errors are updated. Otherwise that of individual particles will not be updated.
(5) The global extreme value gbf is found out by comparing extreme individual particles pbfand its corresponding location gbx, which represents identification parameters of load, is obtained as same time.
(6) In iterations of optimization, repeat steps (3)-(5). The flow chart of optimization procedure is shown as Fig. 2.
Fig. 2Flow chart of optimization procedure
3. Certification experiment and discussions
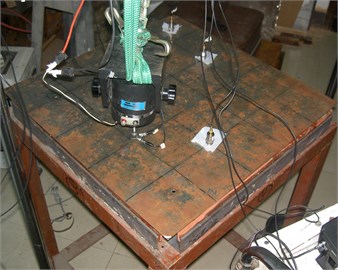
To validate accuracy of the numeric model, a test system is built to measure vibration responses of a thin plate supported by elastic boundary with one harmonic driving load. Length and width of the steel thin plate, which is 2 mm thickness, are 0.5 m and 0.48 m separately. The whole plate is surrounded and supported by four rubber bars to simulate elastic boundary and the vibration exciter is connected to driving point which locates at (0.19 m, 0.07 m) in coordinate system of the plate. For measuring structural vibration distribution, the plate is divided into twenty-five blocks and every center of blocks is test by a B&K4384 accelerator. The origin of coordinate on the plate locates at its bottom left corner and the number of test point is graded in S order around its surface, which is drawn in Fig. 3. With considering the effect of accelerator masses on the test, only three accelerators are used in measurement. Two accelerators move around the plate to test acceleration of every block at different test times and the other one is used to normalize tested results of these two accelerator. At the exaction point, an impedance head is used to connect vibration exciter and the plate to measure input force. The whole experimental sets are shown in Fig. 4.
Fig. 3Numbering of test point on the plate
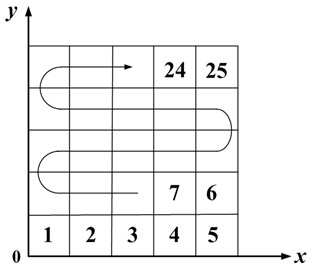
Fig. 4Photo of measuring acceleration response in the plate
The vibration energy of the plate is calculated from accelerations at different point and shown as Fig. 5. It is clearly seen that there are four peaks in the figure at rang of 30 and 230 Hz. Since the vibration energy of structure always reach peak at their modal frequencies, it is found that modal frequencies of the plate are 42, 98, 156, 192 Hz in the scale of test frequency. Loss factor of those modes are also obtained as 0.01, 0.007, 0.0025, 0.002 separately with half-power bandwidth method. Input force is also measured by impedance head and drawn with tested frequencies in Fig. 6.
Fig. 5Vibration energy of steel plate
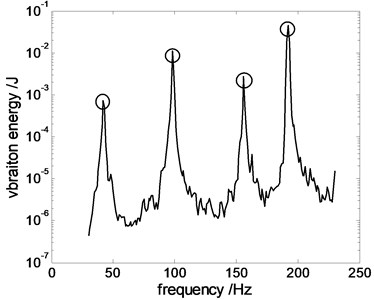
Fig. 6Test and reconstruction results of driving force
In process of the identification, the particle swarm optimization method is selected and used to search information of load and number of variable should be confirmed firstly. In this paper, the two degree locations of load (X, Y) are set as two variables. Because the driving force is varied with frequencies, it is needed to be dispersed into serials points in analyzed frequencies and every point is considered as a variable. Accordingly, the values of force at 51 different frequencies with same iteration, which range from 30 Hz to 230 Hz, are assigned to 51 variables in the optimization. The numbers of variables are added and equal to 53. The quantity of initial vector of chaos system N is set as 20 and the mount of particle M with the best performance is equal to 10. All of φ1, φ2 are equal to 2. The upper and lower limits of the particle velocity are 0.5 and –0.5. Number of iteration is set as 150 and the value of τ declines from 1 to 0.4 in iterating process. The longitudinal stiffness of rubber strip is 1×10⁹ N/m and transfer to the value of boundary stiffness in the numeric model. Also, average value of the modal loss factors in the experiment is used in prediction model.
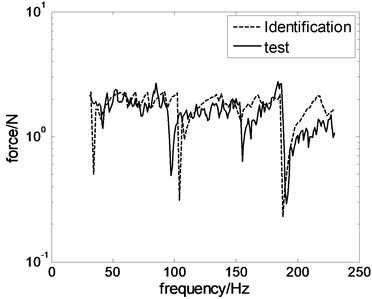
After 150 iterations of calculation in optimal process, location of the deriving force is recognized as (0.2 m, 0.06 m) and the values of deriving force are identified in scale between 0.2 N and 2.3 N. To clarify the differences between forces predicted in optimization and actual value, four characteristic parameters are introduced to comparisons in Table 1, such as mean, standard deviation of force. These values are calculated by using follows equations [27]:
where, ¯f stands for the average value of forces in range of tested frequencies, fω is force at selected frequency, Nω represents number of sampling points in tested frequencies:
where, Sd is standard deviation. Those characteristic parameters obtained from identification and test results are compared and written in Table 1. It is revealed that location and mean value of reconstructed and real force agree with each other. Meanwhile, values of standard deviation, maximum and minimum in reconstruction and actual situation have some differences. Thus, it is concluded that reconstruction results are similar to actual test results at most frequency, and numerical values of actual force fluctuate around average value greater than those in prediction. To demonstrate force’s values varied with frequency, the values of driving force are drawn with corresponding frequencies in Fig. 5. It is seen that the tendency of two curves are the same in Fig. 5. But, some differences exist between curves’ amplitude of identification and test results, especially at frequency ranging from 190 Hz to 230 Hz. In author’s knowledge, those great distinctions are mainly caused by reasons which are detailedly shown as follows:
(1) Reconstructed and tested natural frequency distinguishes with each other greatest at frequency ranging from 190 Hz to 230 Hz, which is clearly shown in Table 2. It would brings clear shift of peak and valley in acceleration and force predicted curve, and leads to obvious distinction between results derived from reconstruction and test at that range of frequency.
(2) Loss factors used in optimization is set as 0.006, which is calculated by averaging the value of test results at every mode. Therefore, the deviation of loss factor in reconstruction and test reach greatest value at natural frequency locating from 190 Hz to 230 Hz. Because amplitude of structural vibrational response is always sensitive to the value of structural loss factor at high frequency, it could lead to forecast smaller amplitude of acceleration response and reconstruct higher values of force at those frequencies by comparing with test data. So, values of predicted forces at those frequencies are seemed to depart obviously from actual values.
Table 1Comparison between identification results and real loads
Condition | Force (N) | Location | ||||
Mean | Standard deviation | Max | Min | X (m) | Y (m) | |
Test | 1.6 | 0.46 | 2.7 | 0.29 | 0.19 | 0.07 |
Identification | 1.7 | 0.31 | 2.3 | 0.23 | 0.2 | 0.06 |
Table 2Comparisons of natural frequency and loss factor in prediction and test
Condition | Natural frequency (Hz) | Loss factor | ||||||
1st mode | 2nd mode | 3rd mode | 4th mode | 1st mode | 2nd mode | 3rd mode | 4th mode | |
Test | 42 | 98 | 156 | 192 | 0.01 | 0.007 | 0.0025 | 0.002 |
Identification | 41 | 99 | 158 | 199 | 0.006 | 0.006 | 0.006 | 0.006 |
From above discussions, it is summarized that reconstructed results which are obtained from optimization process are close to real parameters of harmonic load. Therefore, it is proved that the numeric model proposed in this paper is accurate and can be applied to solve reconstructed problem of harmonic load working on the elastically supported plate. Furthermore, the total errors varied with iteration are drawn as Fig. 7. It is revealed that value of total errors converted to constant value after 80 iteration steps, which demonstrates that the PSO method is suitable for searching the parameters of load with finite iteration steps.
Fig. 7Total error varied with iterative steps
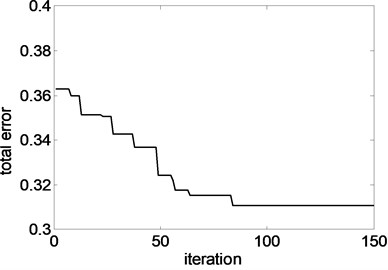
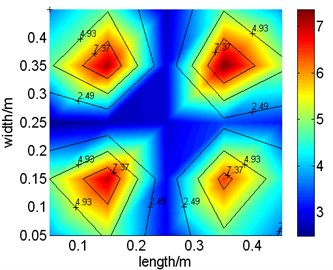
Fig. 8Vibration distributions of test and identification results at 156 Hz
a) Test results
b) Identification results
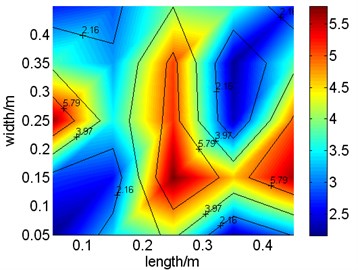
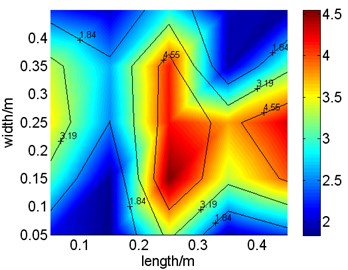
Fig. 9Vibration distributions of test and identification results at 192 Hz
a) Test results
b) Identification results
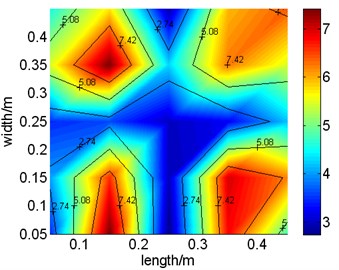
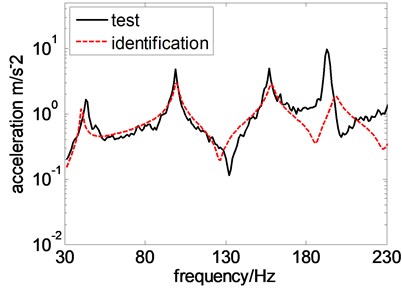
To obtain more information from identification and test results, acceleration distribution of the plate derived from reconstruction and test at the mode of 156 Hz and 192 Hz are drawn in Fig. 8 and Fig. 9 separately. Meanwhile, acceleration response in identification and measurement at 7th and 20th test point is chosen as typical location and compared in Fig. 10. Though comparison between acceleration distribution in reconstruction and test, it is concluded that reconstructed and tested acceleration distribution are similar to each other. Viewed from acceleration response at different test point, it is reveal that acceleration responses at 20th test point in reconstruction and test are almost same and those at 7th test point is extraordinary different at frequencies higher than 130 Hz. In author’s opinion, it is mainly caused by differences between parameters used or elastic boundary modeled in numeric model and that existing in real structure. Also, it partially caused by the system errors in test system, such as error in size measurement of the plate or location test of accelerator linked point. Through above discussions, it is summarized that the model proposed in this paper identifies parameters of load through tendency of vibration distribution on the plate and the accuracies of reconstructed response at some locations are limited.
Fig. 10Test and identification results at different test points
a) 7th test point
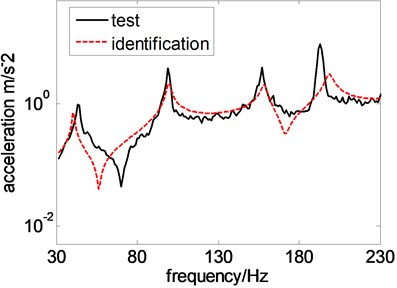
b) 20th test point
4. Conclusions
The idea of load identification in this paper is executed by continuously comparing acceleration responses derived from its numeric model and measurement until differences between them reach the minimum. And the virtual load in numeric model is considered as equaling to real load. To rapidly approach the minimum of the differences, PSO method is introduced in comparing process to identify parameters of load. Based on above considerations, dynamic model of an elastically supported thin plate which carries stiffness or mass is established firstly in this paper. The total errors between results of dynamic model and test are calculated and set as object function of optimization. Then parameters of load, such as location and value of driving force, are confirmed as variables of PSO optimization. Through the process of minimizing the total error between responses in reconstruction and test, parameters of load are identified and compared with those of real source. At last, acceleration distributions of the plate at modal frequencies and responses at different test points, which are derived from identification and test, are compared with each other. From comparisons and discussions, it is concluded that harmonic load acting on an elastically restrained plate linked with attachments can be identified accurately by the proposed numeric model in this paper.
References
-
Granger S., Pertion L. An inverse method for the identification of a distributed random excitation acting on vibrating structure. Part 1: Theory. Mechanical Systems and Signal Processing, Vol. 13, 1999, p. 67-81.
-
Yu Liu, Steve W., Shepard Jr An improved method for the reconstruction of disturbed force acting on a vibrating structure. Journal of Sound and Vibration, Vol. 291, 2006, p. 369-387.
-
Jiang X. Q., Hu H. Y. Reconstruction of distributed dynamic loads on a thin plate via mode-selection and consistent spatial expression. Journal of Sound and Vibration, Vol. 323, 2009, p. 626-644.
-
Huang C. H., Shih C. C., Kim S. An inverse vibration problem in estimating the spatial and temporal-dependent external forces for Cutting tools. Applied Mathematical Modeling, Vol. 33, 2005, p. 793-813.
-
Wang B.-T. Prediction of impact and harmonic force acting on arbitrary structure: theoretical formulation. Mechanical Systems and Signal Processing, Vol. 16, 2002, p. 935-953.
-
Sanchez J., Benaroya H. Review of force reconstruction techniques. Journal of Sound and Vibration, Vol. 333, 2014, p. 2999-3018.
-
Karlsson S. E. S. Identification of external structural loads from measured harmonic responses. Journal of Sound and Vibration, Vol. 196, 1996, p. 59-76.
-
Avitablie P., Piergentili F., Lown K. Identifying dynamic loadings from measured response. Sound and Vibration, Vol. 33, 1999, p. 24-28.
-
Vyas N. S., Wicks A. L. Reconstruction of turbine blade forces from response data. Mechanism and Machine Theory, Vol. 36, 2001, p. 177-188.
-
Fabunmi J. A. Effects of structural modes on vibratory force determination by pesudoinverse techniques. AIAA Journal, Vol. 24, 1986, p. 504-509.
-
Hansen M., Strarkey J. M. On prediction and improving the condition of modal-mode-based indirect force measurement algorithms. Proceeding of the 8th International Modal Analysis Conference, 1990, p. 115-120.
-
Jacquelin E., Bennani Hamlin A. D. Force reconstruction: analysis and regularization of disconsolation problem. Journal of Sound and Vibration, Vol. 265, 2003, p. 81-107.
-
Jiang X. Q., Hu H. Y. Reconstruction of disturbed dynamic loads on a Euler beam via mode-section and consistent spatial expression. Journal of Sound and Vibration, Vol. 316, 2009, p. 626-644.
-
Huang C.-H. A non-linear inverse vibration problem of estimating the external forces for a system with displacement-dependent parameters. Journal of Sound and Vibration, Vol. 248, 2001, p. 789-807.
-
Huang C.-H. A non-linear inverse vibration problem of estimating simultaneously the external forces for a vibration system with displacement-dependent parameters. Journal of Franklin Institute, Vol. 342, 2005, p. 793-813.
-
Wu E., Yeh J. C., Yen C. S. Impact on multiple location on laminated plates: an inverse method. International Journal of Impact Engineering, Vol. 15, 1999, p. 417-433.
-
Doyle J. F. A genetic algorithm for determining the location of structure impacts. Experimental Mechanic, Vol. 34, Issue 1, 1994, p. 37-44.
-
Cao Sugiyama X. Y., Mitsui Y. Application of artificial neural networks to load identification. Computer and Structure, Vol. 69, 1998, p. 63-78.
-
Sofyan E., Trivallo P. M. Solving aerodynamic load inverse problem using a hybrid Fem-artificial intelligence. Proceeding of Australasim Matlab Users Conference, 2000.
-
Trivallo P. M., Can C. L. The inverse determination of aerodynamic loading from structural response data using neural networks. Inverse Problem in Science and Engineering, Vol. 4, 2006, p. 379-395.
-
Li W. L., Daniels M. A Fourier series method for the vibrations of elastically restrained plates arbitrary loaded with springs and masses. Journal of Sound and Vibration, Vol. 252, Issue 4, 2002, p. 768-781.
-
Eberhart R. C., Kennedy J. A new optimizer using particle swarm theory. Proceedings of the Sixth International Symposium on Micromachine and Human Science, Nagoya, Japan, 1995, p. 39-43.
-
Medeiros J., Schirr R. Identification of nuclear power plant transients using the particle swarm optimization algorithm. Annals of Nuclear Energy, Vol. 35, Issue 4, 2009, p. 576-582.
-
Kiranmai D., Jyothirmai A., Murty C. Determination of kinetic parameters in fixed-film bio-reactor: an inverse problem approach. Biochemical Engineering, Vol. 23, Issue 1, 2005, p. 73-83.
-
Mohemmed Ammar W., Sahoo Nirod Chandra, Geok Tan Kim Solving shortest path problem using particle swarm optimization. Applied Soft Computing, Vol. 8, 2008, p. 1643-1653.
-
Perez R. E., Behdinan K. Particle swarm approach for structural design optimization. Computers and Structures, Vol. 85, 2007, p. 1579-1588.
-
Cramer Duncan, Howitt Dennis The SAGE Dictionary of Statistics. SAGE Publications Inc., 2004.

