Abstract
In this research, performance multiple tuned mass dampers (MTMDs) with consideration of the hysteresis behavior and cracking effect of concrete structures under near field earthquake records with high intensity are carefully investigated. Inelastic analysis was performed by employing Takeda hysteresis model, on mathematical model in a state-space form using a program written in Matlab. In the first step, optimum parameter of TMD for single story frame equipped by spectrum TMD is obtained. In the second step, the best place of MTMDs for ten-story frame from two aspects, plastic energy dissipation and maximum lateral displacement, has been studied. And in the last step, the effect of building height in performance of MTMDs is investigated by analysis of a twenty-story resistance frame. Results show that entering the structure into the field of nonlinear behavior and increasing structure height, TMD does not affect the linear behavior of structure. On the other hand, by using the TMD better energy distribution is formed in structure and maximum energy of plastic hinges is reduced. To achieve the best place TMD should multiple target criteria parameters and all potential placement of MTMD simultaneously applied.
1. Introduction
Among various methods of passive control of structures that are available now, TMDs have been used to seismic control efficiency for structural and mechanical systems [1-3]. If vibration frequency of TMD is set to the natural frequency of structure, when the structure is affected under an external vibration, a lot of structural seismic energy is transmitted to the TMD and is wasted by TMD damping. In detuning effect of TMD, its influence on the rate of energy dissipation is reduced. This thread revealed the importance of i) mass, ii) damping and iii) vibration frequency of TMD in the efficacy of TMD. A lot of researches to find the optimum values of these three parameters with measures such as reducing the displacement and the relative acceleration have been done [4-8]. Although TMD performance under basic harmonic excitation and the wind load is determined [9, 10], with further investigation on poor performance of TMD became apparent under earthquake load and it was found that the efficiency of TMD can change under different earthquake records, structural characteristics and soil conditions. To recognize the weakness of the TMD, extensive researches were done. In order to harness and control this sensitivity and suggestions on the use of MTMD with different vibration frequencies instead of TMD were made. Afterwards, researches were done to find MTMDs optimal location [3, 11, 12]. As is clear, numerous studies in the field of linear behavior of structures have been done in order to find optimal parameters of TMD, the optimum place of TMD and the impact of the load type on TMD performance. But all these researches are based on the structural behavior in elastic field and researches conducted in the field of nonlinear behavior of structures are very limited. In 1999, Soto-Brito and Ruiz [13] began to assess the effects of deploying TMD on a 22-floor concrete structure with nonlinear behavior under moderate and large earthquakes. They concluded that in installing TMD at the roof level, the lateral displacement under high-intensity earthquake record does not decrease favorably compared with an earthquake of moderate intensity. Also, they found that increasing the damping of TMD can lead to increased or decreased lateral roof displacement depending on the frequency of the intensity of an earthquake applied. Lukkunaprasit and Wanitkorkul [14], assuming elasto-plastic behavior for structure and assessing two criteria, lateral displacement and plastic energy dissipation, assessed the effects of using TMD under moderate intensity and far field earthquakes and found that using TMD wasted energy due to plastic deformation of the structure is reduced but significant change in the maximum lateral displacement of structure is not observed. Pinkaew et al. [15] equating a 20-floor concrete structure with one degree of freedom structure with nonlinear behavior; found that by using TMD, the energy is dissipated due to plastic deformation of structures under earthquake and basic harmonic excitation decreases. Wong and Johnson [16] investigated the energy changes in the ten-story structure with elasto-plastic behavior under high intensity earthquake and obtained MTMD best place for minimum of energy due to plastic deformation. They reached the conclusion that by using TMD, leading to plastic deformation of the structure, energy is absorbed from the lower floors and released in the upper floors which reduces damages in the lower floors taken to be critical. However, reducing the waste of energy due to plastic deformation is relatively sensitive to the characteristics of seismic earthquakes. Wong and Harris [17] examined the effects of earthquakes in the magnitude of the reduction in energy dissipation due to plastic deformation and concluded that the TMD increases the ability of energy dissipation of structure for low intensity earthquake but for moderate and high intensity earthquake, this ability decreases and can bring about significant period change along with considerable damages in the structure. Sgobba and Marano [18] did a research to find the optimum parameters of TMD and its effects on a single degree of freedom structure with hysteretic Bouc-Wen model behavior. They concluded that TMD is not useful in controlling the structural lateral displacement, but due to a decrease in the amount of plastic energy dissipation, it is advised to be applied. Zhang and Balendra [19] studied adopting TMD in controlling inelastic structures when subjected to long distance earthquake and De Angelis et al. [20] researched large mass ratio TMD effect on structures.
Reviewing the studies, it is understood that there has been no comprehensive research related to concrete structures equipped with TMD using hysterical behavioral model and cracking effects in the concrete and the effect of increasing the height of structures in the field of nonlinear behavior of the TMD performance. Therefore, in this study using four criteria related to structural response and three criteria related to structural damage, we tried to make a realistic evaluation of the TMD performance of concrete structures. In doing this research, on the basis of seismic monitoring of structures, structural dynamics and nonlinear analysis of structures, software is developed in MATLAB environment for nonlinear dynamic analysis of reinforced concrete structures regarding hysteresis Takeda model. In this study, the optimum TMD parameters using a one-floor structure are obtained. Looking locating optimum TMD for a ten-floor structure is used. Finally, to evaluate the effect of structure height on the TMD performance, a twenty-floor structure with TMD was studied.
2. Dynamic equation for a structure with MTMD
The equation of motion of a structural system with n degrees of freedom is shown below:
In the above equation, M, C and K are the mass, damping and stiffness matrices, respectively. X(t),˙X(t) and ¨X(t) are the response displacement, velocity and acceleration vectors, respectively. The ground excitation is shown by ¨Xg(t) and the vector E represents the degree of freedom in which the ground excitation is applied. Eq. (1) can be used to find the elastic response in which the stiffness matrix is constant of all time steps, but if the inelastic response of structure is needed, the stiffness matrix will be a function of time. Shooshtari [21] changed Eq. (1) to Eq. (2):
where:
In Eq. (3) Δt shows the duration of one time step. Eq. (2) can be rewritten in a State-Space form which is shown below:
where Z(t), which is called the state vector; and its derivative, ˙Z(t); contain the structural response as shown in Eq. (5):
And the other parameters in Eq. (4) are defined as:
The solution for Eq. (4) can be expressed as indicated below:
where, ˉT is a matrix whose columns are eigenvectors of matrix ˉA and:
2.1. Element stiffness matrix
When the bending moment at the end of a bending member reaches the yielding moment value, this member will enter the field of nonlinear behavior. As a result, a plastic hinge is formed at the two ends of the members, the properties of which can be described by a bending spring. Fig. 1 indicates that, ka and kb are torsional spring stiffness of the two end members.
Fig. 1Inelastic springs at member ends with degree of freedom

The member yielding causes changing in the local stiffness matrix. In most software of dynamic analysis, such as DRAIN which has been developed by the University of Berkeley, stiffness matrix before and after the yielding of the member is considered the same. The difference is that the effect of the nonlinear behavior of member is considered by adding stiffness matrix representing the springs of member endings and the displacements caused by the elastic and non-elastic behavior of members are added together. But in the process of solving, in the present study, only a local stiffness matrix is used, which changes with the behavior change of member entering the field of non-linear behavior field. Thus, by solving the equation of motion in state-space, a total displacement of one end of member will be achieved instead of considering the elastic and plastic displacement of individual members. Until the member remains in elastic behavior field, the bending spring stiffness of the member end is considered equivalent to infinity. Upon member's entering the field of plastic behavior and member yielding bending spring stiffness reaches a proportional value, non-linear deformation occurs in the member and the member rotates. Fig. 2 shows the angles of rotation at the end of the member.
Fig. 2Flexural rotation angles on both sides of a spring

The relationship between elastic angles and general angles is as follows:
where βa and ˉβa are flexural rotation angles on both sides of the spring, ka is the spring bending stiffness and Ma is the bending moment as shown in Fig. 2. By eliminating ˉβa, Holzer [22] has found the local stiffness matrix as shown in Eq. (11):
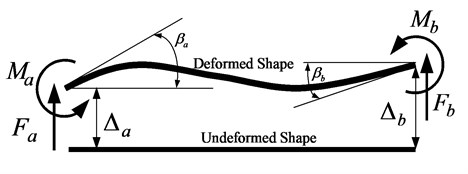
where Δa and Δb are vertical displacements, βa and βb are flexural rotation angles at the ends of an element, Fa and Fb are shear forces and Ma and Mb are bending moments acting on a typical element as shown in Fig. 3. And the other parameters in Eq. (11) are:
Also, if the axial stiffness is considered, stiffness matrix is obtained as follows:
Fig. 3Shear forces and bending moments acting on a typical element
2.2. Structural models with TMD
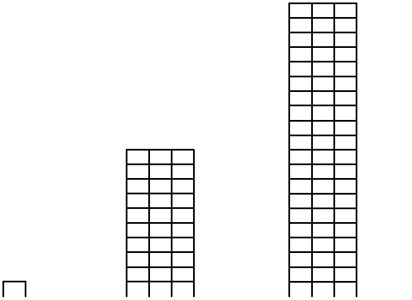
In this research, three concrete frames have been used, i) one, ii) ten and iii) twenty-storey concrete frame as shown in Fig. 4. All these structures are moment bending frames with concrete compressive strength of 30 MPa and bending reinforced yield stress equal to 400 MPa. The element sizes of all frames are presented in Table 1. The 1995 Kobe earthquake record has been chosen as the basic acceleration applied to the structures.
Table 1Element size of concrete frames (cm)
One Storey | Ten Storey | Twenty storey | ||||
Beams | Columns | Beams | Columns | Beams | Columns | |
1st Floor | 30×40 | 40×50 | 30×40 | 40×50 | 30×40 | 40×50 |
2nd-4th Floor | – | – | 30×40 | 40×50 | 30×40 | 40×50 |
5th-10th Floor | – | – | 30×40 | 40×50 | 30×40 | 40×50 |
10th-20th Floor | – | – | – | – | 30×40 | 40×50 |
Fig. 4One-storey frame, ten-storey frame and twenty-storey frame
2.3. Optimum parameter of TMD
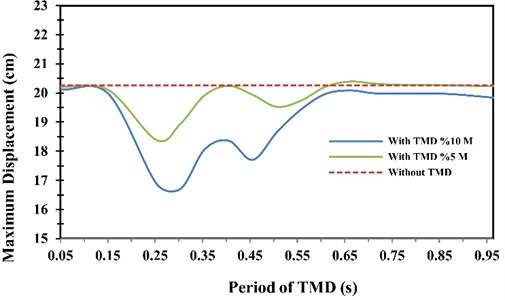
The purpose of determining the optimal parameters of TMD is to specify the values of the vibration period (Td), damping ratio (ζd) and mass (md) of the TMD, so that they have the greatest effect of any one or a number of criteria. Employing a range of TMD is the best way to show the effects of TMD on the dynamic response of structures under a certain earthquake [16]. Therefore, to find the best parameters for optimum TMD, the one-storey frame was equipped with mass damper, as shown in Fig. 5; and was analyzed under the Kobe earthquake record. The amount of mass, md; was 5 % and 10 % of frame mass and damping ratio, ζd; was equal to 5 %. The vibration period, Td, was changed between 0.05 sec and 0.95 sec. In Fig. 5, indexes i and j show the beginning and end joints of element.
Fig. 5Plastic hinge location for one storey frame

The results of analysis are shown in Fig. 6. According to that Figure, the maximum amount of reduction in the maximum lateral displacement for a one-storey frame occurs by installing a tuned mass damper with the following characteristics:
where M and T are the total mass and the period of vibration of the frame, respectively. It should be mentioned that the period of vibration of the frame, T, is equal to 0.51 sec. The maximum reduction in lateral displacement is about 18 % of the maximum lateral displacement of the frame without TMD.
When the mass of damper is equal to 5 % of the frame mass, md=5%M, the greatest decrease in the maximum lateral displacement of the frame will occur in the tuned period equal to half of the vibration period of frame, Td=0.5T, and this reduction will be equal to 9 % of the maximum lateral displacement of the frame without TMD.
Fig. 6Displacement of one-story frame
2.4. Sensitivity study on optimum tuning ratio
To evaluate sensitivity of the vibration period of TMD, Td, to the height of the frame, the ten-storey frame which was introduced in the previous section was analyzed under Kobe earthquake record in two different cases. The difference between those two cases was in the amount of the vibration period of TMD which is introduced in the following equation:
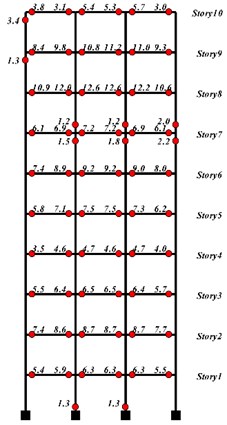
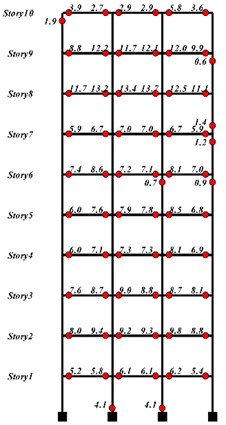
In order to neutralize the effect of TMD location, in both cases; TMD was installed at the top floor. Fig. 7 shows the interstory drift and floor displacement in two described cases as well as in the case without TMD. Fig. 8 and Table 2, show the variation of maximum amount of plastic energy, displacement, relative velocity, relative acceleration, interstory drift and number of plastic joints in the two cases studied.
Fig. 7Interstorey drift and floor displacement in ten-storey frame with and without TMD
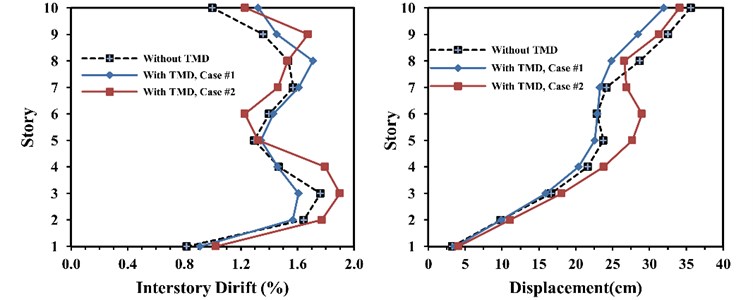
Fig. 8Plastic energy dissipation in sensitivity study
a) Case #1 (Td=0.6T)
b) Case #2 (Td=1.0T)
Table 2Compare all indexes for sensitivity study
Case#1 Td=0.6T | Case#2 Td=1.0T | |
Maximum displacement (cm) | 34.1 | 32.0 |
Maximum velocity (m/s) | 1.41 | 1.41 |
Maximum acceleration (m/s2) | 11.50 | 11.52 |
Maximum drift (%) | 1.90 | 1.71 |
Total plastic energy dissipation (KJ) | 490.6 | 457.1 |
Maximum local plastic energy dissipation (KJ) | 13.74 | 12.62 |
Number plastic joint | 68 | 70 |
2.5. Comparing of hysteresis curves for one-story frame with and without TMD
Comparing the structural hysteresis curves shows a better understanding of the effects of tuned mass damper on the energy changes in the structure. For this purpose, the hysteresis curve of element 1 at node i of the one-storey frame, as shown in Fig. 5, has been studied.
Fig. 9 and Table 3 show the hysteresis curves at the above node with and without TMD cases. As it can be seen, there is a reduction in the rate of energy dissipation for 4 % due to plastic deformation in the frame, while there is a 30 % reduction in the maximum rate of deformation. It can be concluded that using tuned mass damper in structure results in less damaging. This remarkable decrease in the maximum deformation of structure exists in all structural elements of a floor.
Fig. 9Structural hysteresis curve at the joint i of the element #1 of one-storey frame
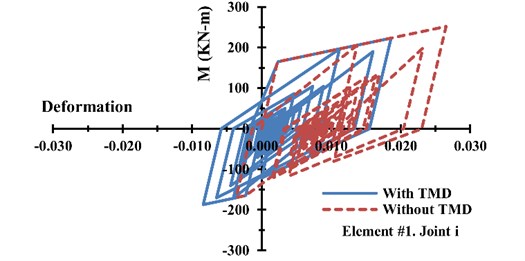
Table 3Amount of maximum deformation and plastic energy of one-storey frame
With TMD | Without TMD | Decrease percentage | |
Maximum deformation | 0.019 | 0.027 | 30 % |
Plastic energy (KJ) | 55.5 | 57.8 | 4 % |
2.6. Optimum location of MTMD in ten-story frame
After the best period of optimally tuned mass damper, to find the installation location of tuned mass damper, the ten-storey frame which was presented in the previous section has been used. In this process, tuned mass damper is set to seven parts by equal mass, damping and stiffness distribution, while the mass of each part is equal to one seventh of total mass. Then, at the first step, the first part was installed at the first floor and the structural analysis was performed under Kobe earthquake record and the maximum roof displacement was found and recorded. Then at the second step, the TMD, which the mass of it is equal one seventh of the total mass; was installed at the second floor and the process was done again. That process was repeated for eight more times when TMD was installed on one floor between the third and the tenth floor. Table 4 shows the maximum roof displacement for each case.
The result in Table 4 indicates that when the first part of TMD was installed at the tenth floor, the best performance of TMD was obtained. For the next step, the process of the structural analysis was done for ten more times; in each time the first part of TMD was installed on the tenth floor and the second part was installed on one floor between the first and the tenth floor and then the best location of the second part of TMD was obtained. That process was repeated for the other part of TMD and the results are shown in Table 5. The best location of each part of TMD has been highlighted in that table.
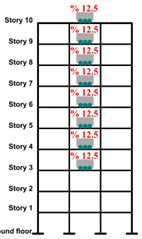
The result shows that if four parts of TMD, in which the summation of their masses is roughly equal to 57 % of total mass, are located at the 10th floor and the rest, which is equal to 43 % of total mass, is located on the fourth floor, then the optimal location of TMD has been found, as shown in Fig. 10. The amount of the plastic energy dissipation for the ten-storey frame with and without TMD is presented in Fig. 11 and the hysteresis curves of the hinge at the Node 5-i are shown in Fig. 12. It should be mentioned that the Node 5-i is located at the first floor, first bay and the left side of the beam. Table 6 shows the comparison between two cases with and without TMD.
Table 4Maximum roof displacement in ten-storey frame for the first part of TMD
TMD Location | 1st Floor | 2nd Floor | 3rd Floor | 4th Floor | 5th Floor | 6th Floor | 7th Floor | 8th Floor | 9th Floor | 10th Floor |
Maximum roof displacement (cm) | 35.7 | 35.7 | 35.3 | 35.2 | 49.3 | 47.1 | 35.1 | 47.4 | 46.8 | 33.7 |
Fig. 10Location of optimum TMD in ten-storey frame
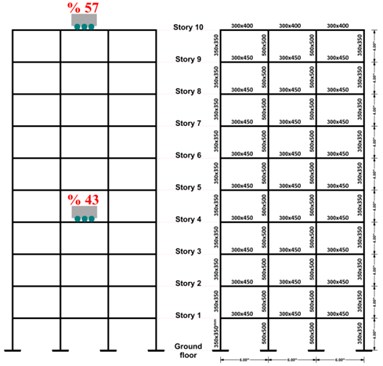
Fig. 11Plastic energy dissipation in optimum placement of TMD
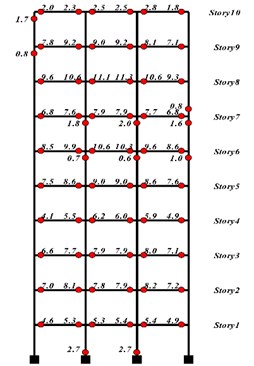
a) With TMD
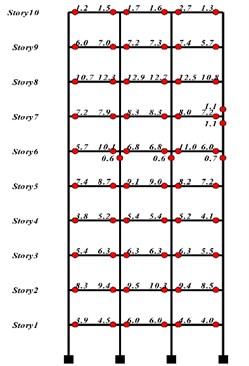
b) Without TMD
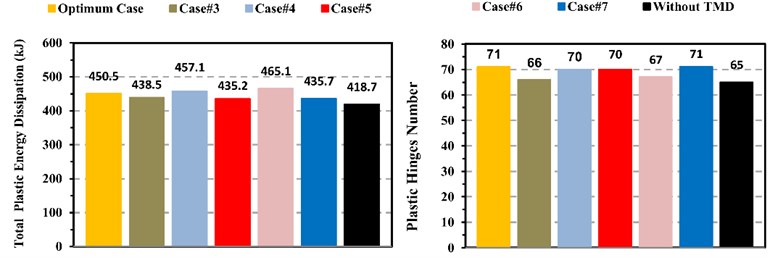
After the best place of the tuned mass damper in previous section was found, in order to control the optimal process of place of the tuned mass damper, five more cases for the tuned mass damper location have been considered. Fig. 13 shows these cases as well as the optimum case which was found in previous section. The results of the analysis of the above cases are presented in Table 7, and Fig. 14 and Fig. 15. It can be mentioned that while the frame element develops the nonlinear behavior, the best case in view of the reduction amount in the roof displacement and the interstorey drift is the second case. It should also be mentioned that the fifth case is the best one in view of the ability in having better performance about the plastic energy dissipation.
Table 5Maximum roof displacement in ten -storey frame for all parts of TMD
Location of TMD | 1st part of TMD | 2nd part of TMD | 3rd part of TMD | 4th part of TMD | 5th part of TMD | 6th part of TMD | 7th part of TMD |
1st Floor | 35.7 | 35.2 | 34.7 | 34.3 | 33.7 | 33.4 | 33.1 |
2nd Floor | 35.7 | 35.3 | 34.9 | 34.4 | 33.9 | 33.5 | 33.1 |
3rd Floor | 35.3 | 34.8 | 34.5 | 34.0 | 33.5 | 33.1 | 32.8 |
4th Floor | 35.2 | 34.7 | 34.3 | 33.9 | 33.4 | 33.0 | 34.1 |
5th Floor | 49.3 | 34.9 | 34.6 | 34.0 | 33.5 | 33.2 | 34.4 |
6th Floor | 47.1 | 47.0 | 34.7 | 34.1 | 33.6 | 33.3 | 32.9 |
7th Floor | 35.1 | 35.0 | 34.6 | 34.1 | 33.6 | 40.9 | 32.9 |
8th Floor | 47.4 | 48.2 | 34.5 | 34.0 | 33.5 | 33.2 | 32.8 |
9th Floor | 46.8 | 47.9 | 34.3 | 33.8 | 33.4 | 33.0 | 32.7 |
10th Floor | 33.7 | 41.3 | 34.2 | 33.7 | 42.3 | 38.5 | 32.4 |
Table 6Other criteria value in optimum location of TMD
With TMD | Without TMD | Increase percentage | Decrease percentage | |
Maximum roof displacement (cm) | 32.4 | 35.6 | – | 9.0 |
Maximum velocity (m/s) | 1.40 | 1.41 | – | 0.7 |
Maximum acceleration (m/s2) | 11.52 | 11.19 | 3.0 | – |
Maximum drift (cm) | 7.36 | 7.05 | 4.4 | – |
†TPED (kJ) | 450.46 | 418.72 | 7.6 | – |
*MLPED (kJ) | 11.34 | 12.88 | – | 12.0 |
Plastic hinges number | 71 | 65 | 9.2 | – |
*Maximum local plastic energy dissipation, † Total plastic energy dissipation | ||||
Fig. 12Structural hysteresis curve in hinge No. 5-i in ten-storey frame
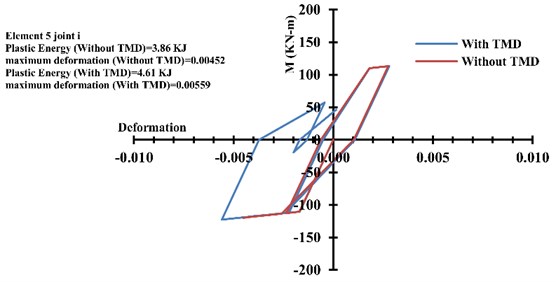
Fig. 13Five more cases of TMDs location in ten storey frame
a) Case #3
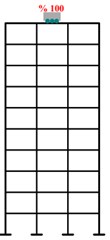
b) Case #4
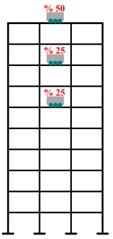
c) Case #5
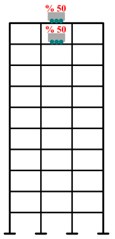
d) Case #6
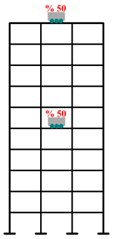
e) Case #7
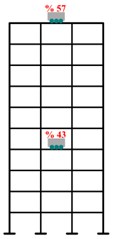
f) Optimum case
Table 7The results of five more cases for ten-storey frame
◊WTMD | Case#3 | Case#4 | Case#5 | Case#6 | Case#7 | ►OCase | Best case | |
Maximum displacement (cm) | 35.6 | 33.8 | 32.0 | 33.3 | 32.7 | 33.2 | 32.4 | Case 4 |
Maximum velocity (m/s) | 1.41 | 1.42 | 1.41 | 1.41 | 1.43 | 1.39 | 1.40 | Case 7 |
Maximum acceleration (m/s2) | 11.1 | 11.4 | 11.5 | 11.4 | 11.5 | 11.3 | 11.5 | ◊WTMD |
Maximum drift (%) | 1.76 | 1.77 | 1.71 | 1.81 | 1.90 | 1.77 | 1.84 | Case 4 |
†TPED (kJ) | 419 | 439 | 457 | 435 | 465 | 435 | 451 | ◊WTMD |
*MLPED (kJ) | 12.9 | 12.9 | 12.6 | 12.5 | 13.3 | 11.0 | 11.3 | Case 7 |
Plastic hinges number | 65 | 66 | 70 | 70 | 67 | 71 | 71 | ◊WTMD |
*Maximum local plastic energy dissipation, † Total plastic energy dissipation ◊ Without TMD, ►Optimum case | ||||||||
Fig. 14Comparison of displacement, velocity, acceleration, interstorey drift and plastic energy dissipation for all cases in ten-storey frame
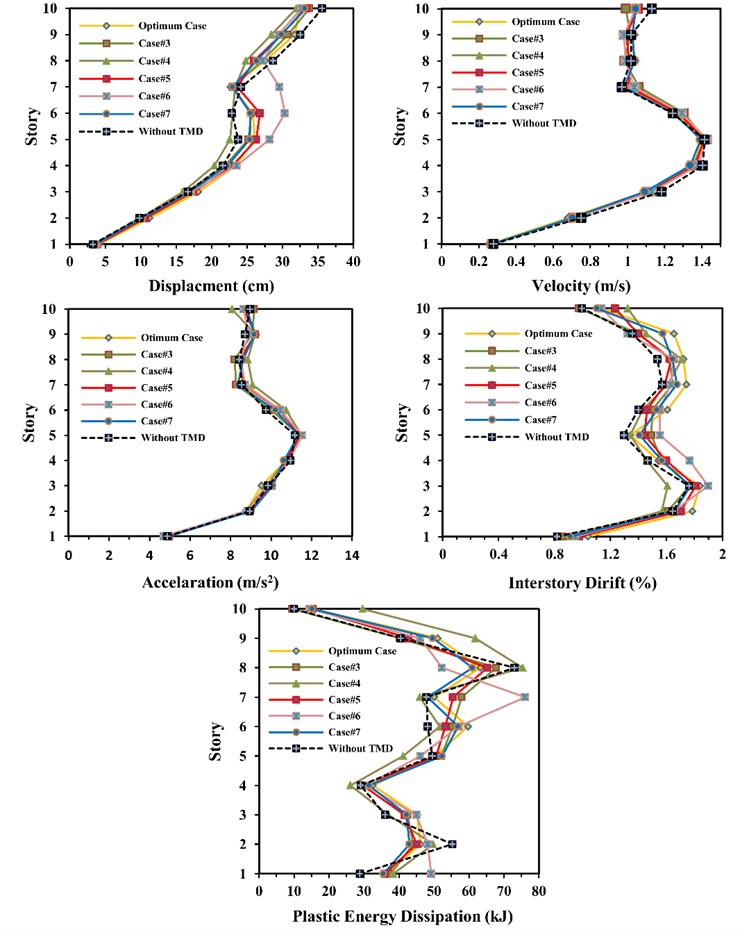
Fig. 15Comparison of total plastic energy dissipation and number of plastic hinges for all cases in
2.7. Height effect of frame on performance of TMDs
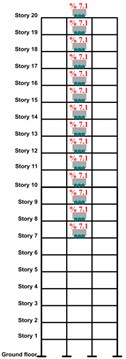
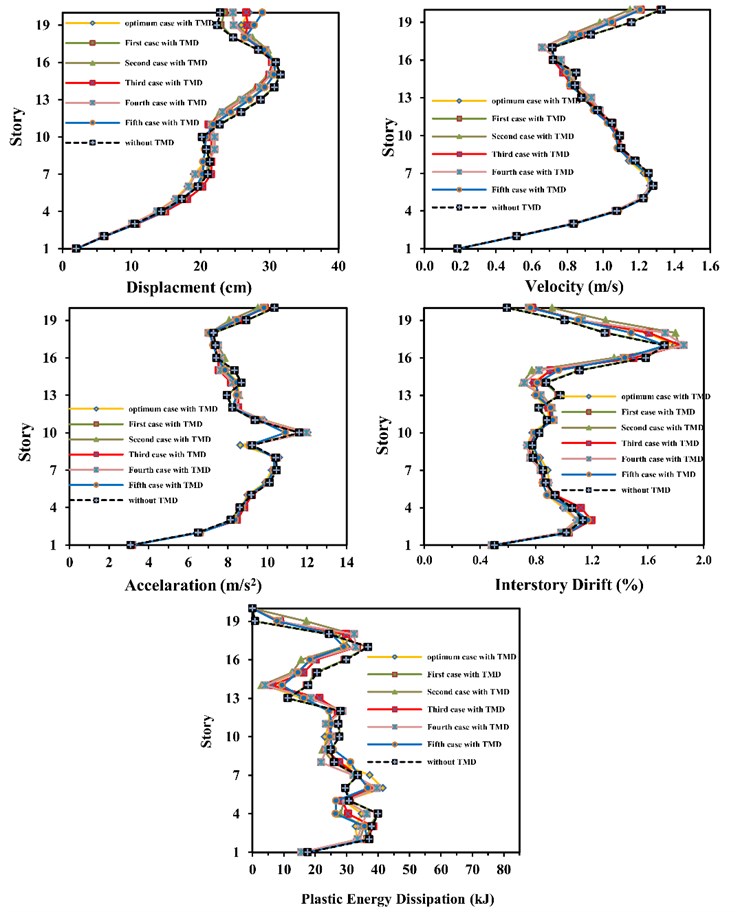
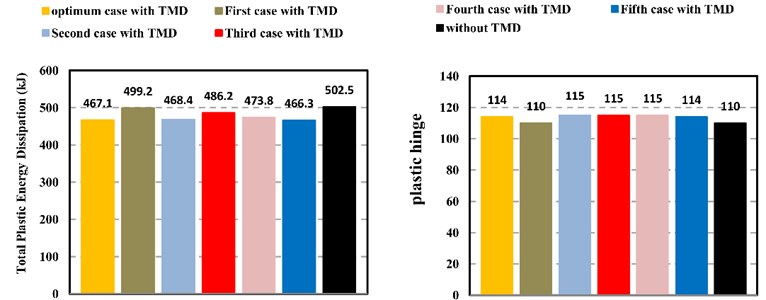
In order to investigate the effect of frame height on the performance of TMDs, the twenty-storey frame whose elements size was presented in Table 1 has been considered. The total mass of that frame is 910,830 kg and its natural period of vibration without TMD is 4.96 second. The same as ten-storey frame, five cases as well as the optimum case for twenty-storey frame were considered as shown in Fig. 16. The only different among all cases is the location of TMDs. The results of the analysis of the above cases are presented in Table 8, Fig. 17 and Fig. 18.
Table 8The results of all cases for twenty-storey frame
◊WTMD | Case 1 | Case 2 | Case 3 | Case 4 | Case 5 | ►OCase | Best case | |
Maximum Displacement (cm) | 31.61 | 31.51 | 30.51 | 30.38 | 30.59 | 30.77 | 30.91 | Case 3 |
Maximum Velocity (m/s) | 1.33 | 1.32 | 1.27 | 1.28 | 1.27 | 1.28 | 1.26 | ►OCase |
Maximum Acceleration (m/s2) | 11.62 | 11.62 | 12.02 | 11.78 | 11.79 | 10.91 | 12.04 | Case 5 |
Maximum Drift (%) | 1.72 | 1.73 | 1.82 | 1.84 | 1.86 | 1.73 | 1.80 | ◊WTMD |
†TPED (kJ) | 502.5 | 499.2 | 468.4 | 486.2 | 473.8 | 466.3 | 467.1 | Case 5 |
*MLPED (kJ) | 6.90 | 6.84 | 6.57 | 6.72 | 6.82 | 6.25 | 7.04 | Case 5 |
Plastic Hinges Number | 110 | 110 | 115 | 115 | 115 | 114 | 114 | Case 1 |
*Maximum local plastic energy dissipation, † Total plastic energy dissipation ◊ Without TMD, ►Optimum case | ||||||||
Fig. 16Location of TMDs for all cases in twenty-storey frame
a) Case #3

b) Case #4

c) Case #5

d) Case #6

e) Case #7

f) Optimum case
The results show that:
1) There cannot be seen any remarkable reduction in the interstory drift in none of cases in comparison to the interstory drift in the case without TMD.
2) The number of the plastic hinges does not change for the first case in comparison to that of the case without TMD but for the other cases, they are almost equal to each other and have been increased in comparison to that of the case without TMD.
3) In twenty-storey frame, TMD cannot reduce the frame displacement and the interstorey drift as much as it can do in ten-storey frame.
4) In a twenty-story frame, the fifth case is the best, whereas the TMD has been divided into two equal parts, one of which is located at the tenth floor and the other part at the roof.
Fig. 17Comparison of velocity, displacement, acceleration, interstorey drift and plastic energy dissipation for all cases in twenty-storey frame
3. Conclusions
The following conclusions can be retrieved from this study:
1) These results were found for the concrete structures under the effect of earthquake in which some elements enter the plastic field.
Fig. 18Comparison of total plastic energy dissipation and number of plastic hinges
2) To find optimal parameters of TMD, a one-story-structure model equipped with a TMD was used. The model was under Kobe earthquake record. Having done the analysis under several damping ratios, we found out that at Td=0.6T the greatest effect could appear.
3) The sensitivity analysis of optimal parameters of TMD for a ten-story structure showed that Td=0.6T is a suitable result for structure entering the nonlinear field.
4) The best place to install TMD in a ten-story structure to minimize maximum displacement in the roof is obtained if 57 % mass is on the roof and 43 % on the fourth floor, resulting in 9 % reduction.
5) It is necessary to determine the purpose of applying the TMD and its impact on other characteristics of structural behavior.
6) To achieve the best place, TMD should multiple target criteria parameters and all potential placement of MTMD simultaneously applied.
7) In comparison of the optimal case obtained with other places obtained from engineering judgment, there is seen to be a reduction in local damage rate at 15 % but in total damage, it is not helpful.
8) In tall structures, parameters such as relative velocity and relative acceleration are of greater effect than those in the ten-story structure.
9) It is highly recommended that practicing engineers work in high earthquake risk zones, to consider SSI influences in dynamic analysis and design of the above mentioned structures to ensure that structures perform safely.
References
-
Connor J. J. Introduction to Structural Motion Control. Prentice Hall Pearson Education, Upper Saddle River, N.J., 2003.
-
Soong T. T., Dargush G. F. Passive Energy Dissipation Systems in Structural Engineering. John Wiley and Sons, Chichester, 1997.
-
Housner G., et al. Structural control: past, present, and future. Journal of Engineering Mechanics, Vol. 123, Issue 9, 1997, p. 897-971.
-
Warburton G. B., Ayorinde E. O. Optimum absorber parameters for simple systems. Earthquake Engineering and Structural Dynamics, Vol. 8, Issue 3, 1980, p. 197-217.
-
Sadek F., et al. A method of estimating the parameters of tuned mass dampers for seismic applications. Earthquake Engineering and Structural Dynamics, Vol. 26, Issue 6, 1997, p. 617-635.
-
Tsai H.-C., Lin G.-C. Optimum tuned-mass dampers for minimizing steady-state response of support-excited and damped systems. Earthquake Engineering and Structural Dynamics, Vol. 22, Issue 11, 1993, p. 957-973.
-
Lee C.-L., et al. Optimal design theories and applications of tuned mass dampers. Engineering Structures, Vol. 28, Issue 1, 2006, p. 43-53, https://doi.org/10.1016/j.engstruct.2005.06.023.
-
Bakre S. V., Jangid R. S. Optimum parameters of tuned mass damper for damped main system. Structural Control and Health Monitoring, Vol. 14, Issue 3, 2007, p. 448-470.
-
Kwok K. C. S., Samali B. Performance of tuned mass dampers under wind loads. Engineering Structures, Vol. 17, Issue 9, 1995, p. 655-667.
-
McNamara R. J. Tuned mass dampers for buildings. Journal of Structural Engineering, Vol. 103, Issue 9, 1977, p. 1785-1798.
-
Chen G., Wu J. Optimal placement of multiple tune mass dampers for seismic structures. Journal of Structural Engineering, Vol. 127, Issue 9, 2001, p. 1054-1062.
-
Yamaguchi H., Harnpornchai N. Fundamental characteristics of multiple tuned mass dampers for suppressing harmonically forced oscillations. Earthquake Engineering and Structural Dynamics, Vol. 22, Issue 1, 1993, p. 51-62.
-
Soto-Brito R., Ruiz S. E. Influence of ground motion intensity on the effectiveness of tuned mass dampers. Earthquake Engineering and Structural Dynamics, Vol. 28, Issue 11, 1999, p. 1255-1271.
-
Lukkunaprasit P., Wanitkorkul A. Inelastic buildings with tuned mass dampers under moderate ground motions from distant earthquakes. Earthquake Engineering and Structural Dynamics, Vol. 30, Issue 4, 2001, p. 537-551.
-
Pinkaew Lukkunaprasit T. P., Chatupote P. Seismic effectiveness of tuned mass dampers for damage reduction of structures. Engineering Structures, Vol. 25, Issue 1, 2003, p. 39-46.
-
Wong K. K. F., Johnson J. Seismic energy dissipation of inelastic structures with multiple tuned mass dampers. Journal of Engineering Mechanics, Vol. 135, Issue 4, 2009, p. 265-275.
-
Wong K. K. F., Harris J. L. Seismic damage and fragility analysis of structures with tuned mass dampers based on plastic energy. The Structural Design of Tall and Special Buildings, Vol. 21, Issue 4, 2012, p. 296-310.
-
Sgobba S., Marano G. C. Optimum design of linear tuned mass dampers for structures with nonlinear behaviour. Mechanical Systems and Signal Processing, Vol. 24, Issue 6, 2010, p. 1739-1755.
-
Zhang Z., Balendra T. Passive control of bilinear hysteretic structures by tuned mass damper for narrow band seismic motions. Engineering Structures, Vol. 54, 2013, p. 103-111.
-
De Angelis M., Perno S., Reggio A. Dynamic response and optimal design of structures with large mass ratio TMD. Earthquake Engineering and Structural Dynamics, Vol. 41, Issue 1, 2012, p. 41-60.
-
Shooshtari M. Active Seismic Control of Reinforced Concrete Structures. Doctoral Dissertation. Civil Engineering Department, Univerisity of Ottawa, Ottawa, Canada, 2005.
-
Holzer S. M. Computer Analysis of Structures Matrix Structural Analysis, Structured Programming. Elsevier Science Ltd., 1985.

