Abstract
Mechanomyography (MMG) signals record and quantify low-frequency lateral oscillations of active skeletal muscles. These oscillations reflect the ‘‘mechanical counterpart’’ of the motor unit activity measured by electromyography (EMG). Accelerometers have been commonly used to measure MMG. However, the accelerometer mass can affect the MMG signal. The purpose of this paper was to investigate the relationship of the accelerometer mass and the MMG signal. Thirty-two normal volunteers conducted the maximum voluntary contraction of leg extension. MMG signals were obtained from the rectus femoris muscle using an accelerometer. For each subject, the accelerometer mass was varied from 3, 8, 13, 18, 23 and 28 g. The signals were measured for three seconds with a sampling rate of 1kHz. Results showed that the MMG signal amplitude increased as the accelerometer mass increased. However, the median frequency (MF) of the MMG signal decreased with the increased accelerometer mass. When the accelerometer mass increased from 8 g to 13 g, the amplitude of the MMG signal increased the most, and the MF of the MMG signal decreased the most. However, for accelerometers heavier than 13 g, no significant change was observed in both the amplitude and MF. Based on the present study, the mass of the accelerometer is recommended to not exceed 13 g to properly measure MMG signals.
1. Introduction
Surface mechanomyography (MMG) records low-frequency lateral oscillations of active skeletal muscle [1, 2]. Barry and Cole [1] and Orizio [2] suggested that these oscillations are attributed to (a) slow bulk movement of the muscle at the initiation of the contraction, and (b) smaller subsequent lateral oscillations occurring at the resonant frequencies of muscle. It has been suggested that the MMG power density spectrum provides qualitative information regarding the global firing rate of unfused activated motor units [1-3].
Electromyography (EMG) has attracted its attention for decades as a reliable tool for the assessment of neuromuscular activation. Many investigators have examined EMG and MMG responses during sustained isometric [4] as well as repeated concentric [5, 6] or eccentric [7], isokinetic muscle actions. Hendrix et al. [4] developed fatigue-thresholds derived from the frequency domains of the EMG and MMG signals during isometric muscle contraction. Ebersole et al. [5] examined the linear changes in torque, EMG amplitude, EMG MPF, MMG amplitude, and MMG MPF across 50 repeated maximal concentric muscle contraction and reported decreases in concentric torque, motor unit discharge rates, muscle fiber conduction velocity. The findings of these studies indicated that analysis of the amplitude and frequency contents of the EMG and MMG signals provide information related to the different motor control strategies [4-7].
Even though EMG is used more often to study muscle properties, MMG has some notable advantages over EMG [8]. First, due to its propagating property through muscle tissue, the placement of MMG sensors does not need to be precise or specific [9]. In particular, the surface EMG is affected by the position of electrodes with respect to the innervation zone and tendons. Secondly, because MMG is a mechanical signal, it is not influenced by changes in skin impedance due to sweating [8, 10]. Finally, electrical noise has no effect on MMG. EMG on the other hand, cannot be used concurrently with functional electrical stimulation (FES) or neuromuscular electrical stimulation (NMES) because EMG is disrupted by electrical noise. Thus, MMG is used to analyze muscle fatigue while using FES or NMES [11]. Furthermore, MMG can be used in conjunction with EMG to examine neuromuscular function [12]. As it can compensate for the weakness of EMG, the application fields of MMG are numerous and increasing. Many studies span from the assessment of muscle function during isometric or dynamic contractions under different physiological conditions, such as fatigue [13], stretching [14], training [15], analyzing the effects of rehabilitation programs [16], the development of prosthesis [8], and/or the use of the MMG as a triggering signal [17].
MMG can be recorded using various sensors, such as hydrophones [2], condenser microphones [2], piezoelectric contact sensors [2], sonomyography [18], accelerometers [19] and goniometers [19] among others. Each sensor has advantages and disadvantages in terms of weight, cost, accuracy, noise and so on. Thanks to recent technological developments, the size of the accelerometer has become very small and the price has become very affordable. Therefore, many research groups have measured MMG signals using accelerometers [19].
Some studies have discussed the effects of accelerometer placement on MMG signals [20, 21]. They reported that the amplitude of the MMG signal changes depending on the position of the accelerometer, and suggested that the signal normalization and the process to determine the optimal accelerometer position was necessary in MMG analysis. However, little research has been conducted regarding the relationship between accelerometer mass and MMG signals. It has been suggested that the amplitude content of the MMG signal is related to motor unit recruitment, whereas MMG frequency is associated with the global firing rate of unfused, activated motor units [3, 22]. The accelerometer mass has an effect on MMG frequency and amplitude. The frequency of the MMG signal is particularly important for patients with FES. In this study, we investigated the changes in the amplitude and frequency of MMG signals by varying the accelerometer mass.
2. Methods
2.1. Participants
This study comprised 32 healthy male volunteers (mean ± SD; age = 23.0±3.0 years; body mass = 65.2±12.8 kg; height = 176.4±7.2 cm). All subjects provided written informed consent before participating in the study. None of the subjects reported any current or ongoing neuromuscular diseases or musculoskeletal injuries that involved the hand, wrist, ankle, knee, or hip joints. All subjects were informed of the purpose, the experimental procedure and the potential risks of this study. Before the actual experiments, three or four voluntary isometric contractions were practiced to familiarize the subjects with the procedures.
2.2. Equipment
A single-axis accelerometer (SCA620, VTI Technologies, Finland) was used to measure MMG signals and vibration signals. The initial mass of the accelerometer was set to 3 g, because the pure weight of the accelerometer was 3 g. Then, the mass of the accelerometer increased by 5 g until 28 g. MMG signals and vibration signals were not measure in the accelerometer mass heavier than 28 g, because the distortion of the signal has occurred. Isometric exercise equipment (Biodex System 3, Biodex Medical Systems, USA) was used to conduct the maximum voluntary contraction (MVC). In addition, a speaker (FS-36055R8N-01, Micro Dynamic Speaker, Korea) was used to produce a constant vibration.
2.3. Vibration measurements
The accelerometer was attached to the vibration plate of the speaker. Using the function generator, 20, 40, 60, 80 and 100 Hz sinusoidal waves were applied to the speaker since the MMG signal frequency range is between 20 and 100 Hz. While each frequency signal was applied, the vibrations were measured using the accelerometer with a sampling rate of 1 kHz (Fig. 1). For each sinusoidal signal, the accelerometer mass was varied from 3 g, 8 g, 13 g, 18 g, 23 g and 28 g.
Fig. 1The measurement of vibration using an accelerometer and a speaker
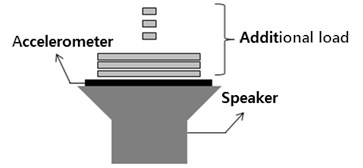
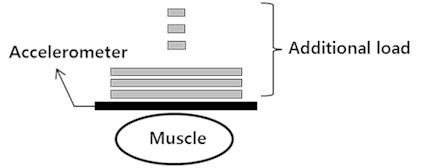
Fig. 2The measurement of MMG signal using an accelerometer
2.4. The measurements of MMG signal that occurred in the muscle
Subjects performed the MVC of leg extension using Biodex System 3. Each subject was stabilized in a chair in the seated position with a hip flexion angle of 80°and a knee flexion angle of 60°. MMG signals were obtained from the rectus femoris muscle using the accelerometer with a sampling rate of 1 kHz. The accelerometer was placed at the midcenter along the line from the anterior spina iliaca superior to the superior part of the patella, based on SENIAM (Surface Electromyography for the Non-Invasive Assessment of Muscles). For each subject, the accelerometer mass was varied from 3 g, 8 g, 13 g, 18 g, 23 g and 28 g (Fig. 2). There was a five-minute rest between each trial to avoid muscle fatigue (Fig. 3).
Fig. 3The MVC Exercise protocol

2.5. Signal processing
Using MATLAB (MathWorks Inc., USA), raw MMG signals were band-pass-filtered at 5-150 Hz (4th order Butterworth). Then, the filtered MMG signals were full-wave rectified and were low-pass-filtered at 4 Hz (4th order Butterworth) for the linear envelope. The amplitude of the MMG signals (MMGAMP) was calculated using a one-second interval signal during the MVC. In addition, frequency analysis was performed using the fast Fourier transform (FFT) and the median frequency (MF) of the MMG signals (MMGMF) was determined.
3. Results
3.1. The vibration occurred in the speaker
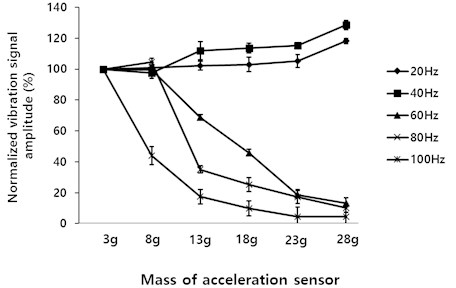
As the accelerometer mass increased, the amplitude of the 60 Hz, 80 Hz and 100 Hz signals measured by the accelerometer decreased. In contrast, the amplitude of the 20 Hz and 40 Hz signals increased (Fig. 4).
Fig. 4Normalized vibration signal for different accelerometer masses
3.2. The MMG signals occurred in the muscle
As the accelerometer mass increased, MMGAMP increased (Fig. 5 and Table 1). When the accelerometer mass increased from 8 g to 13 g, MMGAMP increased the most. However, for accelerometers heavier than 13 g, no significant change in the amplitude was found. When the accelerometer mass increased to 28 g, MMGAMP increased from 0.97±0.28 m/s2 to 4.11±1.61 m/s2 (Table 1).
Fig. 5MMG signals for different accelerometer masses
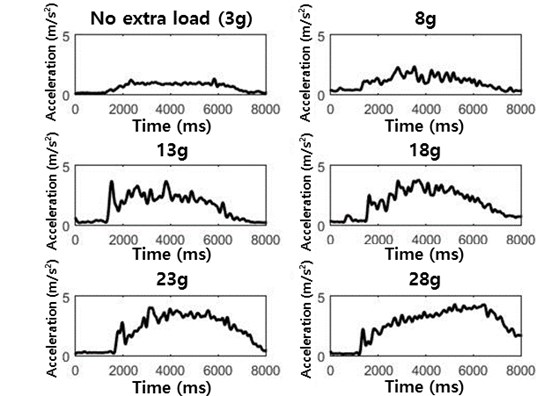
Table 1MMGAMP for different accelerometer masses
Accelerometer mass (g) | Amplitude (m/s2) |
3 | 0.97±0.28 |
8 | 2.07±1.25 |
13 | 3.66±1.39 |
18 | 3.78±1.42 |
23 | 3.94±1.62 |
28 | 4.11±1.61 |
Table 2MMGMF for different accelerometer masses
Accelerometer mass (g) | Amplitude (G) |
3 | 35.7±0.8 |
8 | 31.6±0.9 |
13 | 21.4±0.7 |
18 | 20.1±0.7 |
23 | 20.0±0.8 |
28 | 19.8±0.7 |
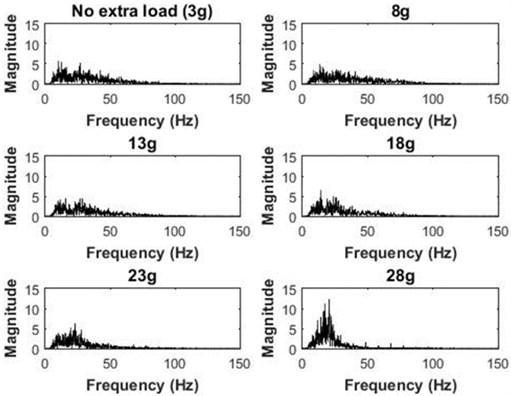
MMGMF decreased with the increased accelerometer mass (Fig. 6 and Table 2). When the accelerometer mass increased from 8 g to 13 g, MMGMF decreased the most. However, for accelerometers heavier than 13 g, no significant change in the MF was observed. When the accelerometer mass was increased to 28 g, MMGMF decreased from 35.7±0.8 Hz to 19.8±0.7 Hz (Table 2).
Fig. 6Power spectrum of MMG signals for different accelerometer masses
4. Conclusions
In this study, we hypothesized that the accelerometer mass would affect MMG frequency and amplitude. Previous studies did not consider the accelerometer mass when investigating the properties of MMG signals. The present study showed that these properties vary with different accelerometer masses. As the accelerometer mass increased, MMGAMP increased and MMGMF decreased.
A speaker was used to investigate the effect of accelerometer mass in the vibration signal with a given oscillation frequency. When the accelerometer mass increased, signals over 50 Hz decreased by the inertia force, since they exist in the relatively high frequency region in MMG. However, signals below 50 Hz showed no significant difference. In other words, MMGMF decreases with an increasing accelerometer mass.
We also investigated the MMG signal with different accelerometer masses. When the accelerometer mass increased, MMGAMP increased and MMGMF decreased. It is known that MMGAMP is usually associated with muscle force [23-25]. Therefore, the accelerometer mass is very important in the study of MMG and muscle force. The decrease in MMGMF can be explained by the simple spring-mass model. According to this model, the natural frequency is inversely proportional to the mass of the spring. Furthermore, MMGMF is associated with muscle fatigue [4, 26-28]. It is known that muscle fatigue decreases the MMGMF [26, 27]. When the accelerometer mass increases, the reduction in MMGMF can be incorrectly perceived as muscle fatigue. Therefore, accelerometer mass should especially be considered in measuring muscle fatigue during FES or NMES.
Only a single type of accelerometer was used in this study. The effect of the accelerometer mass on the MMG signal would not be different for other types of sensors. MMGAMP changed the most when the accelerometer mass increased from 3 g to 8 g but MMGMF changed the most when the accelerometer mass increased from 8 g to 13 g. Even though changes in amplitude can be overcome through the normalization process, large changes in the frequency domain can be misinterpreted. Therefore, due to a large change in the frequency domain, we recommend that the accelerometer mass does not exceed 13 g.
References
-
Barry D. T., Cole N. M. Muscle sounds are emitted at the resonant frequencies of skeletal muscle. IEEE Transactions on Biomedical Engineering, Vol. 37, Issue 5, 1990, p. 525-531.
-
Orizio C. Muscle sound: base for the introduction of a mechanomyographic signal in muscle studies. Critical Reviews in Biomedical Engineering, Vol. 21, Issue 3, 1993, p. 201-243.
-
Orizio C., Liberati D., Locatelli C., De Grandis D., Veicsteinas A. Surface mechanomyogram reflects muscle fibres twitches summation. Journal of Biomechanics, Vol. 29, Issue 4, 1996, p. 475-481.
-
Hendrix C. R., Housh T. J., Camic C. L., Zuniga J. M., Johnson G. O. Comparing electromyographic and mechanomyographic frequency-based fatigue thresholds to critical torque during isometric forearm flexion. Journal of Neuroscience Methods, Vol. 194, Issue 1, 2010, p. 64-72.
-
Ebersole K. T., O’Connor K. M., Wier A. P. Mechanomyographic and electromyographic responses to repeated concentric muscle actions of the quadriceps femoris. Journal of Electromyography and Kinesiology, Vol. 16, Issue 2, 2006, p. 149-157.
-
Perry-Rana S. R., Housh T. J., Johnson G. O., Bull A. J., Berning Jm, Cramer J. T. MMG and EMG responses during fatiguing isokinetic muscle contractions at different velocities. Muscle and Nerve, Vol. 26, Issue 3, 2002, p. 67-73.
-
Perry-Rana S. R., Housh T. J., Johnson G. O., Bull A. J., Cramer J. T. MMG and EMG responses during 25 maximal, eccentric, isokinetic muscle actions. Medicine and Science in Sports and Exercise, Vol. 35, Issue 12, 2003, p. 2048-2054.
-
Xie H. B., Zheng Y. P., Guo J. Y. Classification of the mechanomyogram signal using a wavelet pocket transform and singular value decomposition for multifunction prosthesis control. Physiological Measurement, Vol. 30, Issue 5, 2009, p. 441-457.
-
Alves N., Chau T. Stationarity distributions of mechanomyogram signals from isometric contractions of extrinsic hand muscles during functional grasping. Journal of Electromyography and Kinesiology, Vol. 18, Issue 3, 2008, p. 509-515.
-
Martin M. MMG Sensor for Muscle Activity Detection-Low Cost Design, Implementation and Experimentation. Master’s Dissertation, Massey University, 2009.
-
Lilian F., Guilherme N., Vera B., Percy N. Muscle fatigue assessment by mechanomyography during application of NMES protocol. Brazilian Journal of Physical Therapy, Vol. 13, Issue 5, 2009, p. 422-429.
-
Malek M. H., Coburn J. W. The utility of electromyography and mechanomyography for assessing neuromuscular function: a noninvasive approach. Physical Medicine and Rehabilitation Clinics of North America, Vol. 23, Issue 1, 2012, p. 23-32.
-
Cè E., Rampichini S., Limonta E., Esposito, F. Torque and mechanomyogram correlations during muscle relaxation: effects of fatigue and time-course of recovery. Journal of Electromyography and Kinesiology, Vol. 23, Issue 6, 2013, p. 1295-1303.
-
Esposito F., Limonta E., Cè E. Time course of stretching-induced changes in mechanomyogram and force characteristics. Journal of Electromyography and Kinesiology, Vol. 21, Issue 5, 2011, p. 795-802.
-
Cramer J. T., Housh T. J., Weir J. P., Johnson G. O., Berning J. M., Perry S. R., Bull A. J. Gender, muscle, and velocity comparisons of mechanomyographic and electromyographic responses during isokinetic muscle actions. Scandinavian Journal of Medicine and Science in Sports, Vol. 14, Issue 2, 2004, p. 116-127.
-
Tian S. L., Liu Y., Li L., Fu W. J., Peng C. H. Mechanomyography is more sensitive than EMG in detecting age-related sarcopenia. Journal of Biomechanics, Vol. 43, Issue 3, 2010, p. 551-556.
-
Nolan Y., Depaor A. The mechanomyogram as a channel of communication and control for the disabled. Annual International Conference of the IEEE Engineering in Medicine and Biology Society, Vol. 2, 2004, p. 4928-4931.
-
Djordjevic S., Tomazic S., Zupancic G., Pisot R., Dahmane R. The influence of different elbow angles on the twitch response of the biceps brachii muscle between intermittent electrical stimulations. Applied Biological Engineering – Principles and Practice, 2012, p. 283-296.
-
Mamghani N. K., Shimomura Y., Iwanaga K., Katsuur T. Mechanomyogram and electromyogram responses of upper limb during sustained isometric fatigue with varying shoulder and elbow postures. Journal of Physiological Anthropology, Vol. 21, Issue 1, 2002, p. 29-43.
-
Zuniga J. M., Housh T. J., Camic C. L., Hendrix C. R., Mielke M. The effects of accelerometer placement on mechanomyographic amplitude and mean power frequency during cycle ergometry. Journal of Electromyography and Kinesiology, Vol. 20, Issue 4, 2010, p. 719-725.
-
Alves N., Sejdic E., Sahota B., Chau T. The effect of accelerometer location on the classification of single-site forearm mechanomyograms. Biomedical Engineering Online, Vol. 9, Issue 23, 2010.
-
Orizio C., Gobbo M., Diemont B., Esposito F., Veicsteinas A. The surface mechanomyogram as a tool to describe the influence of fatigue on biceps brachii motor unit activation strategy. Historical basis and novel evidence. European Journal of Applied Physiology, Vol. 90, Issue 3, 2003, p. 326-36.
-
Ryan E. D., Cramer J. T., Housh T. J., Beck T. W., Herda T. J. Interindividual variability in the torque-related patterns of responses for mechanomyographic amplitude and mean power frequency. Journal of Neuroscience Methods, Vol. 161, Issue 2, 2007, p. 212-219.
-
Matta T. T., Perini T. A., Oliveira G. Ld, Ornellas Jd S., Louzada A. A. Interpretation of the mechanisms related to the muscular strength gradation through accelerometry. Revista Brasileira de Medicina do Esporte, Vol. 11, Issue 5, 2005, p. 306-310.
-
Marek S. M., Cramer J. T., Fincher A. L., Massey L. L., Dangelmaier S. M. Acute effects of static and proprioceptive neuromuscular facilitation stretching on muscle strength and power output. Journal of Athletic Training, Vol. 40, Issue 2, 2005, p. 94-103.
-
Kimura T., Fujibayashi M., Tanaka S., Moritani T. Mechanomyographic responses in quadriceps muscles during fatigue by continuous cycle exercise. European Journal of Applied Physiology, Vol. 104, Issue 4, 2008, p. 651-656.
-
Madeleine P., Ge H., Jaskolska A., Farina D., Jaskolski A. Spectral moments of mechanomyographic signals recorded with accelerometer and microphone during sustained fatiguing contractions. Medical and Biological Engineering and Computing, Vol. 44, Issue 4, 2006, p. 290-297.
-
Armstrong J. W., McGregor S. J., Yaggie J. A., Bailey J. J., Johnson S. M. Reliability of mechanomyography and triaxial accelerometry in the assessment of balance. Journal of Electromyography and Kinesiology, Vol. 20, Issue 4, 2010, p. 726-731.
Cited by
About this article
This research was supported by The Leading Human Resource Training Program of Regional Neo industry through the National Research Foundation of Korea(NRF) funded by the Ministry of Science, ICT and future Planning, Grant Number (NRF-2016H1D5A1909760) and was also supported by the “Leaders Industry-University Cooperation Project of the Ministry of Education”.
