Abstract
The noise attenuation and ventilation performances of the glass louver window were investigated using experimental and numerical methods in order to improve the understanding of this common feature in noise mitigation issue. Sound pressure levels (SPLs) data were measured for frequencies ranging from 100 Hz to 6000 Hz for a room fitted with a louver window. It was found that the louver window was able to attenuate 1.4 %, 5.5 % and 12.0 % of the noise when the panels were partially and fully closed at 30°, 60° and 90°, respectively. For frequencies below 3000 Hz, the best attenuation occurred around 1700 Hz to 2000 Hz for all panel angles. The insertion loss (IL) is similar for frequencies ranging from 3000 Hz to 6000 Hz when the louver window was fully closed at 90°. The velocity magnitude of the air passed through the louver panels increased with increased panel angle. The reduction of the mass flow rate for air passed through the louver window when the panels were partially closed at 30° and 60° are 7.7 % and 46.2 %, respectively.
1. Introduction
Louver windows are used in a wide variety of buildings such as schools, factories and commercial buildings for enhancing of natural ventilation and daylighting. The direction of air flow and also the distribution of daylight in the building can be controlled by adjusting the angle of the louver panels. Louver window also can be fully closed to guard against rain or thunderstorm. However, sound is still able to pass through the louver panel even when it is fully closed. In accordance with increasing awareness about the issue of environmental noise pollution, more and more attention is being paid to the noise pollution control or preventing strategies.
Several reported studies were related to the general performance of louver window, for example, heat transfer capability, daylight distribution, ventilation and sound attenuation performances. Marrero and Oliveira [1] investigated the effects of louver shading devices on different facades of a building through simulations. Their results showed that the integration of louver shading devices in the building leads to indoor comfortable thermal condition. Therefore, the devices lead to significant energy savings when compared to a building without louver shading devices. By using experimental and numerical methods, Hashemi [2] evaluated the effectiveness of an automated retrofitted thermal louvers system when acting as sunshade, light shelf, reflective sill and reflective louver under overcast, sunny and clear sky conditions. He concluded that the system significantly improved daylight distribution and reduced the need for artificial lighting by 60 %. Park et al. [3] demonstrated a system which integrated a thin cast transparent polydimethylsiloxane based deformable array of louvers and waveguide within a millimeter-scale fluidic channel system. This system can be dynamically tuned to the different sun and climates positions to control daylight distribution and quality in the interior space. Freewan et al. [4] studied the impact of ceiling geometries on the daylighting performance of louvers using Radiance simulations and physical model experiments. They found that the performance of the louvers can be improved by changing the ceiling geometry and the best ceiling shape was to be the one that is chamfered in the rear and front of the room.
Liu et al. [5] used commercial fluid dynamic code to evaluate the windcatcher’s performance in term of ventilation and indoor particle dispersion using different numbers of louvers and louver lengths. They concluded that the flow rate of air induced into the windcatcher increased with the number of louver layers and the highest ventilation rate was reached when the louver length equates with the reference length. Sakamoto et al. [6] conducted an experimental study on a sound reduction structure where thin Helmholtz resonator was integrated into each louver element in the structure by varying three parameters of the resonator, they are: internal thickness of the cavity, number of necks and holes. Their results showed that sound attenuation increased significantly for 2 mm internal thickness of cavity. They also found that sound attenuation increased when holes diameter is equal to the internal thickness of the cavity. In addition, when cavities were created on the end face of the louvers as acoustics tubes, a significant reduction in the sound attenuation peak frequency was achieved.
It can be seen that the reported studies on louver window were mostly confined to daylighting issues while only limited number of studies were conducted to investigate the noise attenuation performance of the louver window. Therefore, the main objective of the current effort is to use experimental method to investigate the noise attenuation performance of the louver window which located at the NUS student hostel (Raffles Hall) gym room. In addition, the ventilation performance of the louver window was studied using commercial computational fluid dynamic software.
2. Methodologies
2.1. Experimental methods
The experiment consisted of a Bruel & Kjaer (B&K) Omni-source loudspeaker (model 4295), power amplifier (model 2734) and a Larson & Davis sound level meter (model 831 class 1). Before the experiment, the sound level meter was calibrated by using B&K sound level calibrator (model 4231) in order to ensure the accuracy of the equipment. The loudspeaker was placed at the corridor and the sound level meter was located inside the room as shown in Fig. 1(a). The louver window was located at the center between these two equipment. The loudspeaker and sound level meter were positioned 1.40 m from ground and 1.5 m apart from each other where the loudspeaker was positioned 0.5 m away from the louver window (see Fig. 1(b)). The louver window is consisted of 60 glass louver panels (12 rows × 5 columns). Each louver panel has the length of 0.56 m, width (w) of 0.15 m and thickness of 0.01 m as shown in Fig. 2.
Fig. 1Experimental set-up of noise measurement: a) actual room (front view), b) schematic diagram (side view)

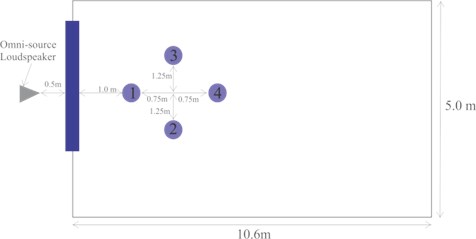
Initially, a set of ambient data was collected without the loudspeaker when the angle of the louver panels was adjusted to 0° (fully opened). However, the SPLs obtained at this angle were very small at high frequency range. Therefore, another four sets of data were collected with the loudspeaker when the angles of the louver panels were adjusted to 0°, 30°, 60° and 90° (fully closed). The measurements were repeated where the sound level meter was placed at other 3 positions inside the room as shown in Fig. 3 (position 1 is the original position) to investigate the effects of the possible standing waves in the room on SPLs. All data were recorded from 100 Hz to 6000 Hz with interval of 50 Hz. The noise attenuation performance of the louver window was examined in term of acoustics performance (A) and IL which were given by:
and:
where LAeq is the equivalent SPL. A-weighting was applied for all data and the sampling time for each set of data is 1 minute.
Fig. 2Dimensions and angles of glass louver panels (side view)
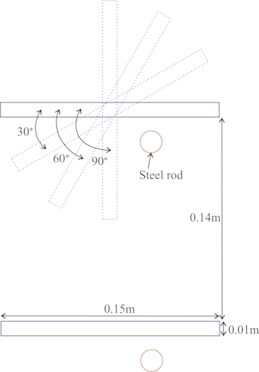
Fig. 3Positions of the sound level meter in the room (top view)
2.2. Numerical methods
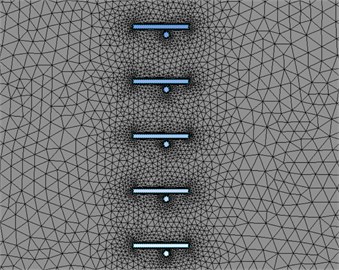
Numerical method was used to investigate the ventilation performance of the louver window instead of experimental method because the experimental flow visualization method such as Particle Image Velocimetry system cannot be used at open air environment. Therefore, simulation was used to study the flow field passes through the louver window and room in addition of ventilation performance. The computational domain was extended about 10w in length from inlet to the louver window along x direction as shown in Fig. 4 where w is the width of the louver panel (0.15 m). In addition, the domain was extended about 66w along y direction in order to simulate the far field atmosphere condition. A steady and uniform velocity with magnitude of 1 m/s in x direction was applied at the inlet. 1 m/s was used in the present study because this is the measured average wind speed outside the gym room. Constant atmospheric pressure distribution with gauge pressure of 0 Pa was applied at the outlets. The turbulence conditions at the inlet and outlets were defined such that the turbulent intensity and turbulent viscosity ratio were defined as 5 % and 10, respectively. Smooth surface was applied on the louver panels with no slip wall boundary configuration and roughness constant of 0.5. Tetrahedron grids were generated using ANSYS software as shown in Fig. 5. There were about 1.49 million cells in the domain. The average element quality is about 0.76 where 0 and 1 correspond to lowest and highest qualities, respectively. The SST-kω turbulence model in ANSYS software [7] was used in the simulation. The ventilation performance of the louver window was examined in term of reduction of mass flow rate (q) at pressure outlet 2 which was given by:
where Qo and Qa are the mass flow rates when the louver window is fully open (0°) and when the louver window is not fully open (30° and 60°), respectively.
Fig. 4Computational domain and boundaries conditions of the numerical model. All non-labeled boundaries are walls
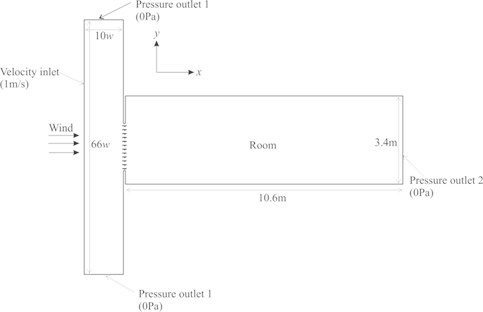
Fig. 5Grids of the numerical model
3. Results and discussion
3.1. Experimental results
Fig. 6 shows the SPLs at different panel angles at room position 1 when the frequencies are ranging from 100 Hz to 6000 Hz with interval of 50 Hz. As expected, the SPLs decrease with increased panel angles and they are lowest when the louver panels are fully closed at 90°. The SPL is as high as 69 dBA at 3650 Hz when the louver panels are fully opened at 0° and the second highest SPLs can be found at 2200 Hz for all panel angles. The room has the lowest SPLs at 3900 Hz for all panel angles. The acoustics performance of the louver window at different panel angles is shown in Table 1. The louver window is able to attenuate 12.0 % of the noise when the panels are fully closed.
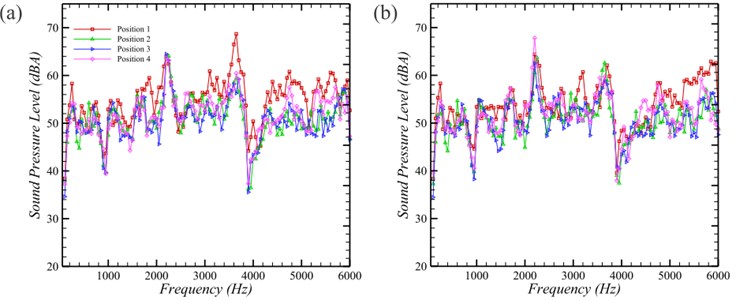
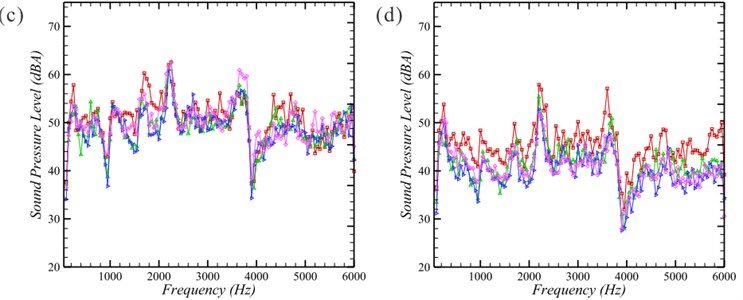
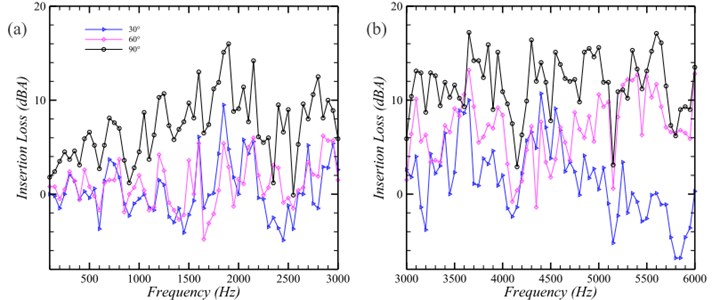
Fig. 7 shows the comparison of the SPLs at different room positions and panel angles. The SPLs measured at all 4 positions at all panel angles are similar and therefore, standing waves do not have significant effect on the data. Fig. 8 shows the comparison of the IL at different panel angles where higher IL would imply better noise attenuation performance. For frequencies below 3000 Hz, the best attenuation occurs around 1700 Hz to 2000 Hz for all panel angles. For example, the attenuation peaks for panel angels of 30° and 90° occur at 1850 Hz which are about 9.5 dBA and 15.1 dBA, respectively. If the angle of the louver panel is adjusted to 60° or 90°, the louver window is able to attenuate traffic noise by 2 dBA and 4.5 dBA, respectively, at 1000 Hz where traffic noise is centralized at 1000 Hz [8].
Fig. 6Sound pressure levels at different panel angles at room position 1 when the frequencies are ranging from 100 Hz to 6000 Hz with interval of 50 Hz
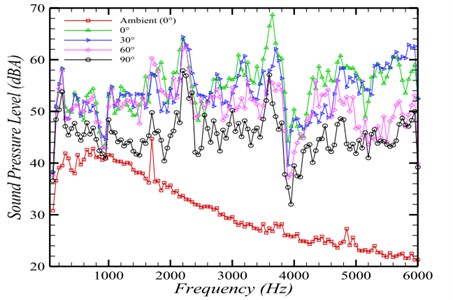
Fig. 7Comparison of the sound pressure levels at different room positions when the panel angle is equal to a) 0°, b) 30°, c) 60°, d) 90°
Generally, the trends of the IL for three panel angles are similar for frequencies below 3000 Hz where the IL increases smoothly from 50 Hz to frequencies between 1500 Hz and 2000 Hz before it decreases after 200 0Hz. When the louver window is partially closed at 30° and 60°, the highest IL for frequencies above 3000 Hz can be found at 4400 Hz and 3650 Hz, respectively. The level of IL is similar for frequencies ranging from 3000 Hz to 6000 Hz when the louver window is fully closed at 90°. The louver window has little noise attenuation effect at around 4150 Hz and 5150 Hz for all panel angles. The noise attenuation performance is poor for frequencies ranging from 4600 Hz to 6000 Hz when the louver window is partially closed at 30°.
Table 1Acoustics and ventilation performances of the louver window at different panel angles.
Panel angle (°) | LAeq | Acoustics performance (%) | Mass flow rate (Kg/s) | Ventilation performance (%) |
0 | 84.36 | 0.52 | ||
30 | 83.22 | 1.4 | 0.48 | 7.7 |
60 | 79.74 | 5.5 | 0.28 | 46.2 |
90 | 74.25 | 12.0 |
Fig. 8Comparison of the insertion loss at different panel angles when the frequencies are ranging from a) 100 Hz to 3000 Hz, b) 3000 Hz to 6000 Hz
3.2. Numerical results
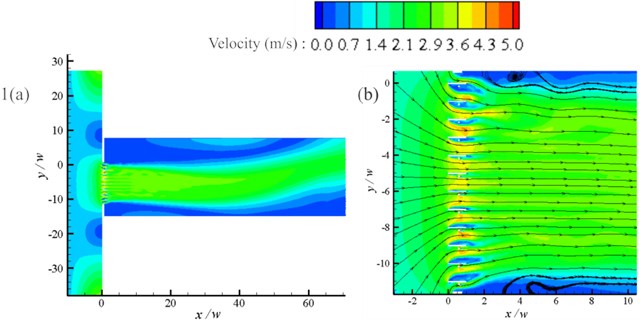
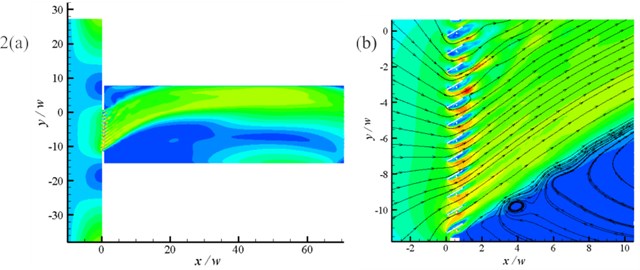
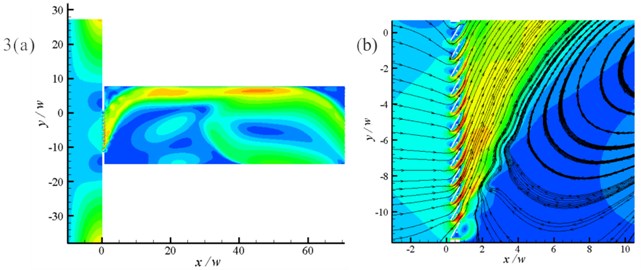
Fig. 9 shows the velocity fields over the louver window and room at different panel angles. The streamlines are also imposed on the velocity contours for figures in (b) for better illustration of the flow fields near the louver panels. It can be observed that the air is diverted by the louver panels and flows to the ceiling of the room when the angle of the louver panels increases from 0° to 60°. The velocity magnitude of the air near the ceiling of the room increases significantly when the louver panels are partially closed at 60°. Fig. 9(b) clearly illustrates that the velocity magnitude of the air passes through the louver panels increases with the increasing of the panel angle. Massive recirculation flow was also found at the back of the louver panels and this recirculation flow becomes stronger with increased panel angle. The size of the vortex at the back of the louver window (see Fig. 9.3(b)) becomes very large such that its length is longer than half of the window height when the panel angle is equal to 60°. The reduction of the mass flow rate at outlet 2 when the panels are partially closed at 30° and 60° are 7.7 % and 46.2 %, respectively, as shown in Table 1. The mass flow rate is equal to density of air × (flow velocity × cross sectional area). Therefore, the mass flow rate at outlet 2 when the panel angle is equal to 60° is still lower than that of 30° even the flow velocity is higher at 60° because the reduction of the cross sectional area is more than the increment of the flow velocity. If the louver window is partially closed at 60°, it is able to attenuate traffic noise by 2 dBA while the best attenuation could be obtained at 3650 Hz for about 13.2 dBA with the flow reduction of 46.2 %. The louver window is able to attenuate noise by 10 dBA at 3650 Hz with the flow reduction of 7.7 % when the louver window is partially closed at 30°.
Fig. 9(Color) Velocity fields over the louver window and room at different panel angles. 1) 0°, 2) 30°, 3) 60°. For figures in b), the contours and streamlines illustrate the enlarge velocity fields near the louver panels. The flow direction is from left to right
4. Conclusions
The noise attenuation performance of the louver window which located at the NUS student hostel (Raffles Hall) gym room for frequencies ranging from 100 Hz to 6000 Hz was investigated using experimental method in order to improve the understanding of this common feature in noise mitigation. The ventilation performance and flow passed through the louver window were also studied by using ANSYS software. The louver window was able to attenuate 1.4 %, 5.5 % and 12.0 % of the noise when panels were partially and fully closed at 30°, 60° and 90°, respectively. It can be concluded that the standing waves do not have significant effect on the data since the SPLs measured at all 4 room positions at all panel angles were similar. For frequencies below 3000 Hz, the best attenuation occurred around 1700 Hz to 2000 Hz for all panel angles. The IL is similar for frequencies ranging from 3000 Hz to 6000 Hz when the louver window was fully closed at 90°. The air was diverted by the louver panels and flowed to the ceiling of the room when the angle of the louver panels increased from 0° to 60°. The velocity magnitude of the air passed through the louver panels increased with the increasing of the panel angle. The reduction of mass flow rate at outlet 2 when panels were partially closed at 30° and 60° are 7.7 % and 46.2 %, respectively.
References
-
Palmero-Marrero A. I., Oliveira A. C. Effect of louver shading devices on building energy requirements. Applied Energy, Vol. 87, Issue 6, 2010, p. 2040-2049.
-
Hashemi A. Daylighting and solar shading performances of an innovative automated reflective louvre system. Energy and Buildings, Vol. 82, 2014, p. 607-620.
-
Park D., Kim P., Alvarenga J., Jin K., Aizenberg J., Bechthold M. Dynamic daylight control system implementing thin cast arrays of polydimethylsiloxane-based millimeter-scale transparent louvers. Building and Environment, Vol. 82, 2014, p. 87-96.
-
Freewan A. A., Shao L., Riffat S. Interactions between louvers and ceiling geometry for maximum daylighting performance. Renewable Energy, Vol. 34, Issue 1, 2009, p. 223-232.
-
Liu S., Mak C. M., Niu J. Numerical evaluation of louver configuration and ventilation strategies for the windcatcher system. Building and Environment, Vol. 46, Issue 8, 2011, p. 1600-1616.
-
Sakamoto S., Sugahara R., Nagumo T., Nakano A., Kawase H. Theoretical analysis and measurement of sound transmission loss in louver elements with a sound attenuating function using a Helmholtz resonator array. Journal of Advanced Mechanical Design Systems and Manufacturing, https://www.doi.org/10.1299/jamdsm.2014jamdsm0022, Vol. 8, Issue 3, 2014.
-
ANSYS. http://www.ansys.com/
-
Sandberg U. The multi-coincidence peak around 1000 Hz in tyre/road noise spectra. Euronoise, 5th European Conference on Noise Control and AIA, Naples, Italy, Vol. 498, 2003, p. 1-8.
About this article
This material is based on research/work supported by the Singapore Ministry of National Development and National Research Foundation under L2 NIC Award No L2NICCFP1-2013-8.

