Abstract
To eliminate the influence of the interference acoustic source behind the array on the source identification performance, some modifications on the traditional single-layer beamforming microphone array are made, a new array with acoustic insulation baffle in the microphone plane is given out to suppress the influence of interference acoustic source. Simulation and verification results show that, with the presence of the interference acoustic source in the rear of traditional planar array, the acoustic source position and amplitude deviations are larger and it indicates that the interference acoustic source seriously affects the identification performance of target acoustic source. Compared to the performance of traditional planar array, the new microphone array with acoustic insulation baffle can effectively eliminate the influence of interference acoustic source behind the array and improve the accuracy of the location and amplitude of the target acoustic source. The experiment verifies the correctness of the simulation conclusions and the applicability of the modified microphone array in the cabin of automotive and aircraft and other narrow space.
1. Introduction
The planar microphone array measurement technology with beamforming algorithm has been widely used over the last few decades in acoustic source identification of some fields such as aviation aircraft, trains and automobiles because of its advantages of fast measuring speed, high calculation efficiency, good spatial resolution in middle and high frequency, and easy of arrangement [1-6]. The requirements of the acoustic source identification are that the source should be located in the front side of the microphone array and the rear of the array should be anechoic. However, in practical engineering application, for the narrow space, automobile and aircraft cockpit, it is difficult to meet such a requirement. The condition, to a great extent, limits the using of traditional planar microphone array in the practical engineering application. For non-free-field measurement environment, microphones on the array receive not only the sound signals radiated by the target acoustic source but also signals coming from the outside interference acoustic source, which inevitably reduce the accuracy and applicability of the microphone array in acoustic source identification [7, 8].
Attenuating the impact of the interference acoustic source and improving the precision and practicability of microphone array have an important research and application value. Some clear deconvolution methods can effectively eliminate the side-lobe interference, but they are not suitable in anechoic measurement environment with the presence of interference source for that they can only remove the side-lobe information other than the main-lobe of the disturb acoustic source [9-11]. In order to effectively eliminate the influence of interference acoustic source, foreign and domestic scholars have made a lot of efforts. First, the “Reflection Canceller” technique, proposed by Guidati et al., is discussed, in which the mirror source determined by the reflection number of the acoustic source is added to the transmission model according to the mirror image principle, modified steering vectors are achieved to attenuate the impact of reflection [12]. A correction technique similar to the inverse method of Nelson is discussed, that keep the steering vector of the acoustic sources invariant and minimize the array output from the mirror source direction, so as to improve the sound source identification ability [13, 14]. A mirror-ground beamforming method of Chu has been given to attenuate the ground reflection influence and improve the acoustic source identification accuracy. It attenuates the influence of the ground reflection signals by means of doubling the microphone number and adding a virtual mirror array under the ground which is symmetrical with the real array [15]. The reflection acoustic source discussed by above thesis are all located in front of the microphone array using the traditional single-layer microphone array. And traditional single-layer microphone array is not suitable in acoustic measurement when sources exist behind the array in practical engineering application such as automobile and aircraft cabin, engine compartment and other narrow space. Pascal et al. [16] use the SOAP (Statistically Optimal Array Processing) beamforming method and Cho et al. [17] apply acoustical holography method to distinguish acoustic sources which are located on both sides of microphone array in the reverberant environment, respectively. Both of them use a double-layer microphone array to separate the sound pressure and particle velocity in the measurement. With intensity vector reconstructions technique, Takashima, etc. use a rigid spherical microphone array to locate and quantify acoustic sources in the vehicle cabin [18]. However, SOAP beamforming method and acoustical holography method discussed above are only applicable for low range frequency below 2000 Hz, and acoustic source identification results are poor for high frequency. Compared to single-layer microphone array, the double-layer array requires twice the number of microphones and so that it costs more in hardware facility. In addition, the rigid spherical microphone array has some shortcomings such as low spatial resolution, narrow application range and so on. Therefore, in order to reduce the influence of the interference acoustic source behind the array and improve the acoustic source identification frequency range, some modifications on the traditional single-layer microphone array are made. Based on beamforming method, a new array with acoustic insulation baffle in the microphone plane is given out to suppress the interference acoustic source.
The remainder of this paper is organized as followed: in Section 2, principle of beamforming based on spherical wave assumption is presented, and propagation paths of acoustic source in practical measurement environment is depicted. Thereafter, in Section 3, based on simulations of some given acoustic sources, performance comparisons of different conditions are demonstrated. Subsequently, in Section 4, the verification experiment is conducted to validate effectiveness of eliminating the interference acoustic source in the rear of the array and applicability of the modified microphone array in some complex sound field such as the cabin of automotive and aircraft. Finally, conclusions are summarized in Section 5.
2. Beamforming
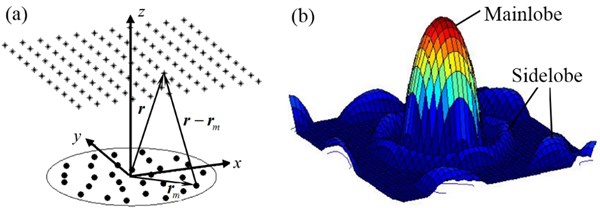
Beamforming involves sampling the sound pressure signals with spatially distributed microphones and post-processing the data by an algorithm that scans the scene of interest for acoustic sources. The main lobe is formed at the real acoustic source position where the output of the focus point is strengthened; the side lobes are formed at other places where the output of the focus point is attenuated. So the acoustic source can be identified effectively. Fig. 1(a) shows the layout of beamforming measurement. Vector indicates the position of a scanning point. Vector rm indicates the position of the mth microphone, where rm(m=1,2,…,M) is the serial number of the microphones. Cross-spectral imaging function is the commonly used near field beamforming algorithm, which is achieved by assuming a model where the recorded field is generated by a distribution of monopole point sources, forming an error function between measured and modeled cross-spectra, and minimizing this error function. The resulting imaging function is [3, 13, 16, 17]:
where ω is the signal circular frequency, C is the M by M cross-spectral matrix of the sound pressure signals sampled by array microphones, 1 is a M by M unity matrix with all elements equal to 1, v(r)=[v1(r),v2(r),…vm(r),…vM(r)]T is the steering column vector and w(r)≡[|v1(r)|2,|v2(r)|2,…|vm(r)|2…|vM(r)|2]T. The superscript “T” and “*” represent the transposition and the conjugation respectively. Element vM(r) is defined by:
where k=2πf/c is the wave number, f is the frequency and c is the propagation speed of sound. On one hand, when r is equal to the real source position, J2(ω,r) is strengthened, forming the main lobe, on the other hand, when r differs from the real source position, J2(ω,r) is attenuated to produce side-lobes. Consequently, it can identify the acoustic source effectively. Fig. 1(b) shows the identification result.
Fig. 1Beamforming source identification principle: a) layout of acoustic source identification; b) result of acoustic source identification
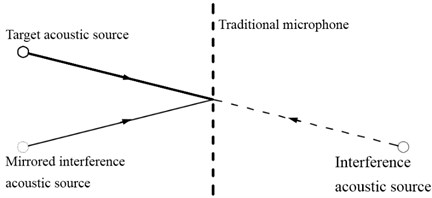
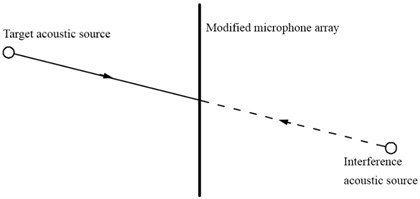
In practical measurement, the measurement is not the ideal free field, as a result, signals received by the microphones on the array not only come from the target acoustic source but also from the interference acoustic source. Propagation paths of the acoustic signals radiated by acoustic sources is shown in Fig. 2 when interference source exist behind the array. Heavy solid line represents the propagation path of the target acoustic source signal and dotted line represents the propagation path of the interference acoustic source signal. By default, all the acoustic source signals received by the array are treated as coming from the front of the array. In accordance with the principle of the mirror, the interference source signal behind the array is identified as the false acoustic source in the front of the array, and thin lines as shown in the figure represents the interference source behind the array mapped as a mirrored interference acoustic source in the imaging plane. In this case, the acoustic signal received by each of the microphone on the array is the superposition of the target and interference acoustic sources, so that the identification accuracy of the target acoustic source which is in front of the array is seriously affected by the interference acoustic source behind the array.
3. Simulation
To explore the influence of interference acoustic source to the target acoustic source, based on the beam forming theory of cross spectral imaging function, simulations are conducted. Firstly, the scene of interest is built to cover an area of size 0.2 m×0.2 m with 41×41 scanning points, where some true source distributions are assumed. The grid spaces of x axis and y axis are 0.01 m, respectively. A 30-element Sector Wheel Array with a diameter of 0.35 m is considered, whose geometrical setup is shown in Fig. 1(a). The distance between array plane and observation plane is 0.35 m. Secondly, the acoustic source signal received by the microphone on the array can be calculated based on the acoustic principle. With the absence of the interference acoustic source, acoustic pressure signal received by the microphones comes from the target acoustic source. When the interference acoustic source exists, acoustic pressure signal received can be regarded as the sum of the acoustic source signal in the front of the array and interference acoustic source behind the array, and then their cross-spectra are calculated. Next, the imaging result can be achieved by scanning each point in the scene of interest backwardly based on the beamforming method. Finally, the output is calculated and converted to sound pressure level to form the contour plot.
Fig. 2Propagation paths schematic of traditional microphone array
Taking the array center as the coordinate origin and the array plane as x-y plane, setting the horizontal direction, vertical direction and the direction which is perpendicular to the array plane as x axis, y axis and z axis, respectively. Assuming the point source located in the central position, namely (-0.1, 0, 1) m, the simulations of the acoustic source identification are shown in Table 1. Maps in the table from second column to the fifth column depict the results of frequency at 1500 Hz, 2500 Hz, 3500 Hz, 5500 Hz, respectively. Maps in row 2 illustrate the target acoustic source simulation results of beamforming method with the absence of interference source. Simulation results of interference acoustic source at (0.1, 0, –1) m and (–0.05, 0, –1) m are shown in row 3 and 4, respectively. In maps in row 5, the interference acoustic source located at (–0.1, 0, –1) m, which is symmetrical to the target acoustic source about the array plane. The display dynamic range of figures shown in the table is 10 dB. As can be seen in the simulation results, the higher the frequency, the narrower the acoustic center, and it is consistent with the high frequency and high resolution characteristics of beamforming. Compared the results of each frequency in row 2, with the absence of the interference acoustic source, the acoustic center appeared at (–0.1, 0, 1) m with a peak value 100 dB indicates that the traditional array with beamforming method has the ability to identify the position and amplitude of acoustic source accurately. Maps of the results with interference acoustic source behind the array in row 3 show that the target and interference acoustic sources are integrating together, which indicate that the spatial resolution of beamforming is poor at low frequency like 1500 Hz, 2500 Hz and 3500 Hz. For the reason of equal strength, result of 1500 frequency located at (0, 0, 1) m shows that the acoustic center locates at the middle position of target and interference acoustic source and the position deviation of the acoustic source is large. The target and interference acoustic sources begin to separated gradually with the increase of frequency. And at frequency of 2500 Hz, 3500 Hz, 5500 Hz, the interference acoustic source in the rear of the array, emerged in (0.1, 0, 1) m position, disturbs the identification effect of the target acoustic source which is located at (–0.1, 0, 1) m. By the comparison of the results in row 4, for the limitation of the array resolution, the target and interference acoustic sources are intermingling together when the projection distance in the acoustic source plane is close, which leads to the acoustic center position and the amplitude to be inaccurate. The inaccuracy of amplitude decreases with the increase of the frequency and be close to the exact value. Maps in row 5 depict the results that the interference acoustic source located at the position which is symmetrical to the target acoustic source about the array plane. For the reason that the interference acoustic source is covered by the target acoustic source in the mapping plane, maps in row 5 is similar with the results in row 2 which is without the disturbance of the interference acoustic source. At this time, the error of amplitude reaches to a maximum value.
In summary, the effects of identification results are seriously worse with a false acoustic source appeared in the imaging results when the interference acoustic source is in the rear of the array. The position and the amplitude of the acoustic source exist some deviation when projection distance of the target and interference acoustic source is close. The amplitude deviation reaches the maximum when the interference acoustic source is obscured by the target one.
Table 1Simulation results without and with interference acoustic source using the traditional microphone array
1500 Hz | 2500 Hz | 3500 Hz | 5500 Hz | |
Without interference source | 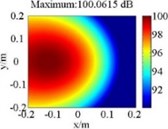 | 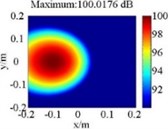 | 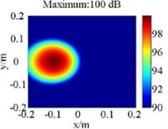 | 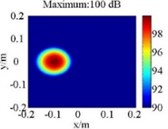 |
Interference source at position 1 | 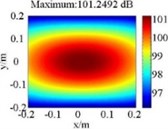 | 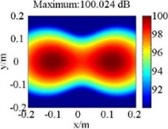 | 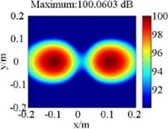 | 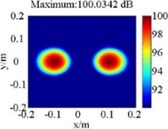 |
Interference source at position 2 | 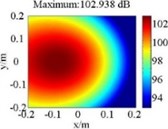 | 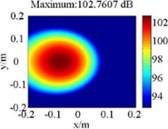 | 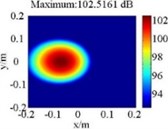 | 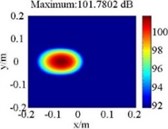 |
Interference source at position 3 | 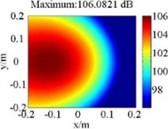 | 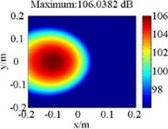 | 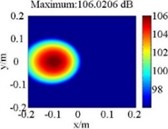 | 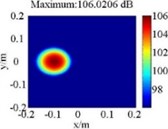 |
To eliminate the influence of interference source in the rear of the array on the acoustic source identification, some modifications have been made on the traditional microphone array. For the traditional microphone array is the palisade structure as shown in Fig. 3(a), that signals of interference can be received by the microphones on the array through the gap of palisade. As shown in Fig. 3(b), the modified microphone array with acoustic insulation baffle can suppress the interference acoustic source in the rear of the array to pass through the array directly. To avoid the impact of sound diffraction for the attachment of the baffle, the radius of acoustic insulation baffle is 5 cm larger than that of the array and there are no any microphones located on the boundary of the baffle. Fig. 4 describes the acoustic source propagation paths of the modified array. The path of the interference acoustic source in rear of the array shown as the dotted line is effectively suppressed by the acoustic insulation baffle in the microphone plane. As a hard reflecting surface, insulation baffle in the microphone plane will reflect the acoustic source coming from the front of the array, sound field will be changed accordingly. For the microphone array, the measured amplitude value of the pressure will be doubled with the unchanged phase, that is, the sound pressure level will increase 6 dB according to the formula of 20×log210=6. Therefore, in the acoustic source identification, additional information will not change except for the acoustic source intensity.
Fig. 3The structure of the pseudo random microphone array: a) the traditional microphone array; b) the modified microphone array
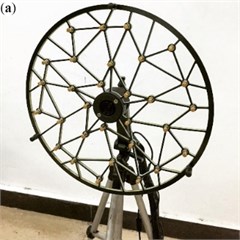
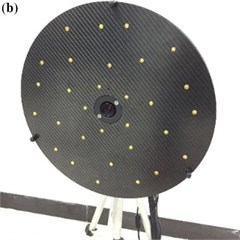
Fig. 4Propagation paths schematic of modified microphone array
4. Identification experiment
In order to validate the correctness of the simulation results and the effectiveness of the modified array with insulation baffle in practical application, experiments with the known single frequency point source are conducted. Measurements are taken with the 30-element Sector Wheel Array at 0.35 m distance from the loudspeakers, the arrangement of example test is shown in Fig. 5. The array has a diameter of 0.35 m and utilizes Brüel&Kjær Type 4958 microphones. Sound pressure signals sampled by microphones are acquired simultaneously by Brüel&Kjær 30-channel PULSE Type 3660C Data Acquisition System and then are transferred to Brüel&Kjær Pulse LabShop Software, where their cross-spectra are achieved. Eventually, the cross-spectral imaging function beamforming is applied to map the sound field and reconstruct the distribution of source strengths by MATLAB programming.
Fig. 5Device arrangement of the experiment: a) arrangement of traditional microphone array; b) arrangement of modified microphone array
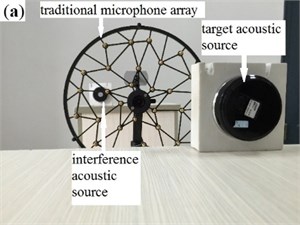
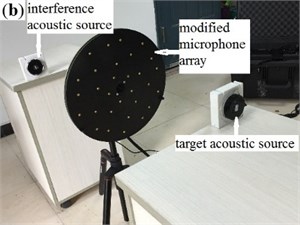
The acoustic source identification results at the frequency of 1500 Hz, 2500 Hz, 3500 Hz, 5500 Hz are shown in Table 2. Maps in the row 2 and row 3 depict the experiment results with the absence of the interference acoustic source and with the presence of interference acoustic source using the traditional microphone array, respectively. Maps in row 4 illustrate the identification results of the modified array when the interference acoustic source is present. By comparing the identification results of different frequency in row 2, the accurate location of the source indicates that the traditional array can effectively identify the target acoustic source with the absence of the interference acoustic source. From the comparison of each map in row 3, in the presence of the interference acoustic source, the shift of the acoustic source position indicates that identification result using traditional microphone array at 1500 Hz frequency is not accurate. For the limitation of spatial resolution at low frequency, the influence of the interference acoustic source in the rear of the array cannot be eliminated by the traditional array. The target and interference acoustic sources are merging together and the acoustic center appears in their connection position, which is consistent with the simulation results of low frequency. Two acoustic source centers emerged in the imaging map at the frequency of 2500 Hz, 3500 Hz and 5500 Hz indicate that the interference acoustic source in the rear of the array is mapped to the identification area and gets the wrong acoustic source identification result. In row 4, the identification results have the similar performance with that in row 2, which indicates that the modified array with acoustic insulation baffle can effectively eliminate the influence of the interference acoustic source in the rear of the array. The accurate acoustic source position demonstrates the fine identification effect of the modified array. However, due to the attachment of the acoustic insulation baffle in the microphone plane, the signal from the front is doubled by the reflection and the sound pressure signal measured by the microphones is increased approximately 6 dB. The consistency between the experiment and the simulation results indicates that, with the present of the interference acoustic source, the modified array with the acoustic insulation baffle can identify the target acoustic source more accurately and effectively.
Table 2Identification results without and with interference acoustic source using traditional and modified microphone array
1500 Hz | 2500 Hz | 3500 Hz | 5500 Hz | |
Traditional array without interference source | 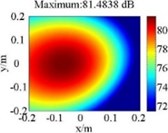 | 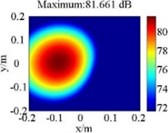 | 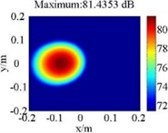 | 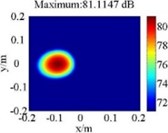 |
Traditional array with interference source | 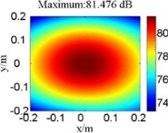 | 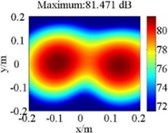 | 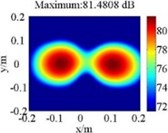 | 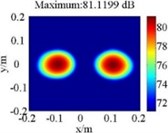 |
Modified array with interference source | 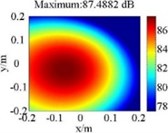 | 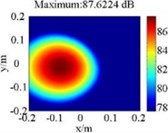 | 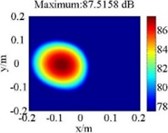 | 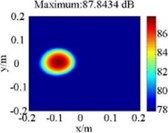 |
5. Conclusions
Based on near-field spherical wave assumption and the cross spectral matrix beamforming acoustic source identification method, some modifications are made on the traditional microphone array to eliminate the influence of the interference acoustic source in the rear of the array. Some conclusions have been drawn from our study:
1) The identification results of the traditional microphone array are awful when interference acoustic source exists in the rear of the array, the false acoustic source emerges in the identification maps when the interference is mirrored from the rear to the front.
2) The closer the distance between the false acoustic source which is mirrored from the back to the front and target acoustic source, the bigger deviation of the target acoustic source position and the amplitude.
3) The modified microphone array with acoustic insulation baffle can effectively the eliminate the interference acoustic source in the rear of the array, and suppress the false acoustic source emerging in the imaging plane. At the same time, for the attachment of the acoustic insulation baffle, the intensity of the acoustic source is increased 6 dB.
References
-
Chu Zhigang, Yang Yang, Jiang Zhonghan Study on the beamforming performance of microphones array. Chinese Journal of Sensors and Actuators, Vol. 24, Issue 5, 2011, p. 665-670.
-
Qiao Weiyang, Ulf Michel A study on landing aircraft noise based on the fly-over measurements with a planar microphone array. ACTA Acustica, Vol. 26, Issue 2, 2001, p. 161-168.
-
Yang Yang, Chu Zhigang, Ni Jiming, et al. Research on algorithm of sound source identification based on cross-spectral beamforming with the exclusion of auto-spectra. Noise and Vibration Control, Vol. 31, Issue 4, 2011, p. 145-148.
-
Ginn K. B., Haddad K. Noise source identification techniques: simple to advanced applications. Proceedings of the Acoustics Nantes Conference, Nantes, France, 2012, p. 1781-1786.
-
Si Chundi, Chen Enli, Yang Shaopu, et al. Experimental study on noise sources identification of vehicle based on microphone array technology. Journal of Vibration and Shock, Vol. 28, Issue 6, 2009, p. 171-174.
-
Chu Zhigang, Yang Yang, Wang Weidong, et al. Identification of truck noise sources under pass-by condition based on wave beamforming method. Journal of Vibration and Shock, Vol. 31, Issue 7, 2012, p. 66-70.
-
Guidati S., Guidati G., Wagner S. A modification of the classical beamforming algorithm for reverberating environments. 7th International Congress on Sound and Vibration, Garmisch-Partenkirchen, Germany, 2000.
-
Guidati S., Guidati G., Wagner S. Beamforming in a reverberating environment with the use of measured steering vectors. 7th AIAA/CEAS Aero Acoustics Conference, Maastricht, Netherlands, 2001.
-
Brooks T. F., Humphreys J. W. M. A deconvolution approach for the mapping of acoustic sources (DAMAS) determined from phased microphone arrays. 10th AIAA/CEAS Aeroacoustics Conference, Monterey, CA, United States, 2005.
-
Dougherty R. P. Extensions of DAMAS and benefits and limitations of deconvolution in beamforming. 11th AIAA/CEAS Aeroacoustics Conference, Monterey, CA, 2005.
-
Ehrenfried K., Koop L. Comparison of iterative deconvolution algorithms for the mapping of acoustic sources. AIAA Journal, Vol. 45, Issue 7, 2007, p. 1584-1595.
-
Guidati S., Brauer C., Wagner S. The reflection canceller-phased array measurements in a reverberating environment. 8th AIAA/CEAS Aero-acoustics Conference and Exhibit, Breckenridge, Colorado, 2002.
-
Nelson P. A., Yoon S. H. Estimation of acoustic source strength by inverse methods. Part 1: conditioning of the inverse problem. Journal of Sound and Vibration, Vol. 233, Issue 4, 2000, p. 643-668.
-
Yoon S. H., Nelson P. A. Estimation of acoustic source strength by inverse methods. Part 2: experimental investigation of methods for choosing regularization parameters. Journal of Sound and Vibration, Vol. 233, Issue 4, 2000, p. 669-705.
-
Chu Zhigang, Shen Linbang, Yang Yang Mirror-ground beamforming method of acoustic source identification. Journal of Basic Science and Engineering, Vol. 23, Issue 1, 2015, p. 162-171.
-
Pascal J. C., Li J. F. Use of double layer beamforming antenna to identify and locate noise sources in cabins. 6th European Conference on Noise Control: Advanced Solutions for Noise Control, EURONOISE, Tampere, Finland, 2006.
-
Cho Y. T., Roan M. J., Bolton J. S. Dual surface beamforming and acoustical holography for sound field visualization in reverberant environments. Proceedings of the Institution of Mechanical Engineers, Part C: Journal of Mechanical Engineering Science, Vol. 224, Issue 1, 2010, p. 55-70.
-
Takashima K., Nakagawa H., Williams E. G. Vector intensity measurement with a rigid spherical microphone array in a vehicle cabin. Journal of the Acoustical Society of America, Vol. 123, Issue 5, 2008, p. 1779-1782.
About this article
This work was supported by the Chongqing Significant Application and Development Planning Project (No. cstc2015yykfc60003).

