Abstract
The analysis of vibration signals is major technique for condition monitoring of bearing in machine components. Vibration based signal analysis is used for the detection of bearing fault. The present work emphasizes the comparison of some vibration parameters to characterize the distributed defects in the bearing, RMS, Peak and peak to peak which are used in the detection defects in the bearing. These parameters are measured at various load and speeds with simulated defect on bearing parts. This paper also shows the sensitivity of kurtosis in condition monitoring of ball bearing. It has been shown that vibration based monitoring is an effective method for detecting the faults in the bearing.
1. Introduction
Ball bearings are the most commonly used in a wide range of industrial rotating machinery. The robustness and reliability of ball bearing are essential for the machine health. Bearing failure is one of the prime causes of breakdown in rotating machinery, resulting in expensive systems downtime. The damage of rolling element bearings subjected to unexpected problems leads to an increase in operation and maintenance cost as well as the possibility of incurable failure. Therefore, the fault detection of rolling element bearing has been the subject of extensive research prepared by Howard [1]. Bearing defects may be classified as local and distributed faults. The local faults include pits, spalls, and cracks on rolling elements caused by fatigue on the rolling surface. The distributed faults encompass surface roughness, waviness, and misaligned races and off size balls. These defects may be due to manufacturing errors and operating conditions [2]. The vibration amplitudes are also obtained theoretically by Mcfadden [3] and Choudhari [4] by assuming defect size and defect location on various bearing elements. However, Singh et al. [5] have noticed that, bearing frequently develops localized defects in the raceway. They had also reported that, during cyclic operation of rolling element the leading and trailing edge of localized fault wears and causing it to spread the defect size. In addition to this, because of variable loading such local defects grow along the periphery of raceway generally considered as extended raceway defect. Moreover, the presence of bearing fault such as local, distributed defects and their location can be identified by time and frequency domain analysis of vibration signal [6]. But in contrast to fault detection of local and distributed defects, extended defects have received very less attention. Therefore, the present work has been attempted in the feature extraction of extended defects using time domain analysis.
A machine could be seriously damaged if defects occur in the bearings during service. Early detection of these defects is necessary for preventing damage of other of parts of the machine. Various condition monitoring techniques have been proposed by earlier researchers for the detection fault in the bearing. An extensive review [7] related to detection of defects using the vibration signal in the rolling element bearing reveals that, vibration signature analysis has been recognized as more frequent and reliable method of analysis. This paper also reviews techniques for the detection of local and distributed faults concludes that, it is possible to detect the location of the defect using frequency domain (FFT) in vibration measurement. Apart from this other technique have also been adopted by few researchers for bearing fault detection. High frequency resonance technique [8], localised current method, sound measurement technique and acoustic emission technique are some of important methods used for failure analysis of the bearing.
In a time domain analysis, Tondon [9, 10] had measured some of the parameters such as overall RMS, power, crest factor, spectrum etc. It was found that the defect detectability of overall power is best followed by peak and RMS measurements. Kurtosis is another important parameter to identify the health of bearing. Dyer and Stewart [11] first proposed the use of kurtosis for bearing defect detection. Moreover, Heng [12] suggested that RMS, Peak, standard deviation, skewness and kurtosis can be used as statistical parameters to analyze the signal. However, RMS, crest factor is suitable for steady state signals. Recently, Praphakar et.al. [13] have also shown effectiveness of kurtosis in multiple bearing defect detection in simulated condition. Earlier study in the bearing fault detection with small size localized defect, distributed type waviness, have been carried out successfully, however, there is necessity to correlate the spectral component from the bearing with extended defects for diagnosis purpose. The objective of present work is comparison of some of vibration parameters such RMS amplitude, peak amplitude and kurtosis with simulated defects on inner and outer race of bearing. The amplitudes of vibration are measured by varying speed as well as load. However considerable increase in the amplitude is noted with variation in speed than variation in load.
2. Bearing characteristic frequencies
The occurrence of resonating frequencies resulted from the defects in the bearings are called characteristic bearing defect frequencies. Each bearing has its own characteristic frequency which depends on rotating speed and size rolling element bearing. When a ball interacts with faults, impulses are generated periodically according bearing defect frequency. The components of ball bearing such as outer race, inner race whose characteristic defect frequencies calculated by using Harris [14] equations:
Ball pass frequency of outer race (BPFO):
Ball pass frequency of inner race (BPFO):
The characteristic defect frequencies for DFM-85 single row deep groove ball bearing at 900 rpm are calculated from above Eqs. (1) and (2). The values are 36.55 Hz and 68.44 Hz for outer race defect and inner race defect respectively.
3. Experimentation
To fully utilize the production capacity and to reduce machinery downtime in the industry, it is necessary to predict the degradation of bearing working condition before it reaches to hazardous failure. In present experimental investigation, the faults are introduced in the inner and outer race of the ball bearing by artificially creating extended distributed fault. A sketch of the test rig on which the experiments have been conducted is shown in Fig. 1. It consists of a shaft supported on healthy bearings and driven by a variable speed motor. Different speeds were obtained using the control panel of the DC motor. The special purpose bearings DFM-85 is used as test bearing normally used in four wheeler engines. It was mounted in bearing housing on the shaft and loaded by turn buckle in radial direction.
Fig. 1Experimental test rig
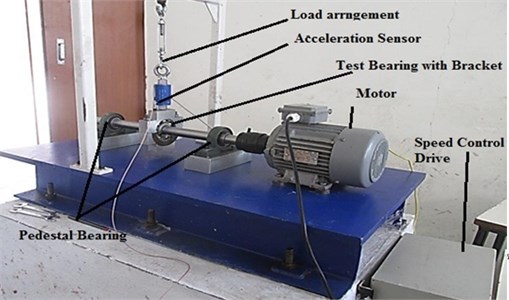
A piezoelectric accelerometer with a magnetic sensitivity of 10 mV per-m/s2 is used to measure the vibrations. It is mounted closer to the housing of the test bearing. For easy mounting and dismounting split type of aluminum housing is designed. The accelerometer is connected to the DEWOSOFT 8- channel FFT analyzer, the output of which is connected to a computer. The relevant hardware and the software are required to acquire the data, store it. The stored data is displayed in the time domain signal that are installed in the computer used for this work. Electric discharge machine was used to create the defect on bearing race. Load cell of capacity 2000 N is used for load measurements. The constant radial load is applied on outer support of bearing varies from 50 N to 200 N as required. The defected bearings are prepared by creating artificial defects in the outer and inner ring respectively as indicated in Table 1. In entire experimental work, the healthy support bearings are used. Signals are acquired in frequency domain and interpreted in proper format.
3.1. Measurement condition
Vibration data from the bearing was acquired at different speeds such as 300, 600, 900, 1200 and 1500 rpm. The load on the bearing was varied in steps on defect free bearing. It is observed that with variation of load on bearing, the amplitude of the vibration changes. Hence it was decided to keep radial on bearing constant as 100 N for all healthy as well as defective bearings. The defects were created by electro discharge machining on inner race, outer race of bearing surface. The defects sizes of Ra=4.6 micron amplitude and width of 15 degree rough surface are measured with the help of stylus instrument. For the bearing with outer race defect is fixed while in case of inner race the defect rotates continuously which gives impulses when strikes with mating surface. All the test bearings are mounted on the test rig one after another by applying equal amount of grease. Proper cleaning of bearings has been carried out before application of grease to make them free from contaminants.
4. Results and discussion
Before measuring levels of the vibrations amplitude of defective bearing, healthy bearings without defect are tested for RMS, peak and peak to peak values. These values are plotted for various speed and load as shown in Fig. 2(a) and 2(b). The values of peak to peak amplitude for healthy bearing are observed to be at higher end than other two parameters. It has also been observed that peak to peak amplitudes for healthy bearing are not far differing with respect to load at any constant speed but there is considerable change in the amplitude with respect to speed at constant load.
Fig. 2Amplitudes of healthy bearing a) at 900 rpm, b) 100 N radial load
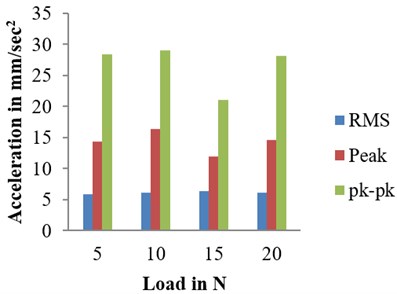
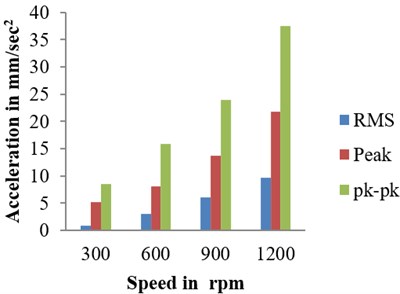
From Fig. 2 it is clear that peak to peak amplitude gives better detectability. When defected bearing are used as test bearing, peaks are observed at respective defect frequencies which are depicted at lower amplitude in the spectra of healthy bearings. The following section shows the frequency domain and time domain transformation for the measurement conditions mentioned in Section 3.1.
4.1. Frequency domain approach
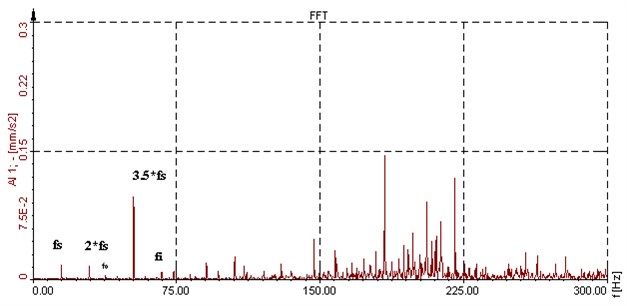
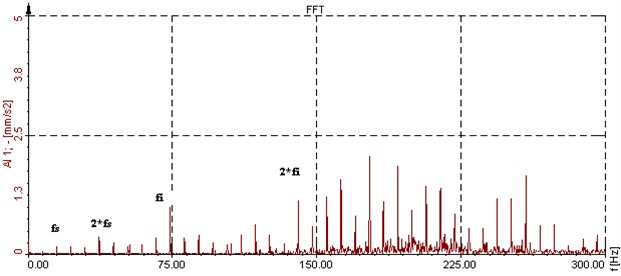
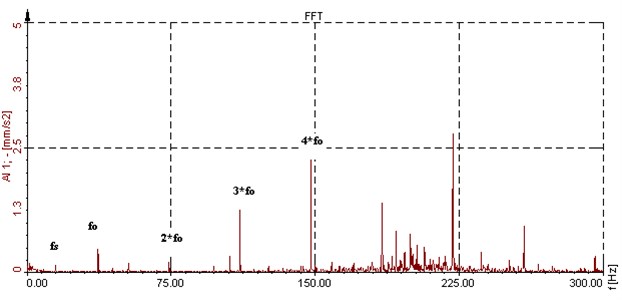
Fig. 3 show peak to peak amplitudes at defect frequencies and its multiples. It is observed that the spectrum clearly shows the presence of fault on the outer race and the inner race. The theoretical frequency 36.55 Hz and 68.44 Hz, obtained by equations mentioned in Section 2 closely matches with the fault frequencies. Hence the frequency domain approach gives precise estimation of location of defects.
The best results are given by the bearing with outer race defect in which the position of defect with respect to sensor is fixed as outer race of the bearing is stationary. Hence amplitude of vibration depends upon the defect position in the load zone.
4.2. Time domain approach
In this section four different well known time domain parameters RMS, peak, peak to peak and kurtosis are used to determine sensitivity of defect. The parameters are defined for discrete signal.
4.2.1. Effect of speed
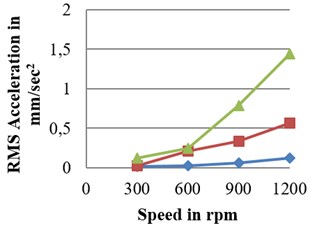
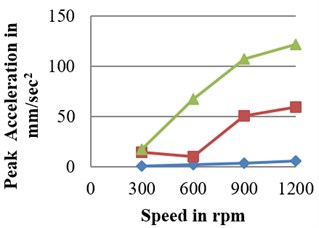
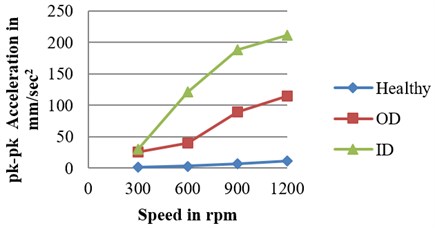
Good delectability is observed at higher load in this case. As compared with it, speed is very important and controlling factor for defect detection as shown in Fig. 4. Increase in level of vibration amplitude is more with increase in speed than increase in load. However, in comparison with outer race defected bearing inner race defective bearings give higher levels of amplitudes for all vibration parameters.
Fig. 3a) Frequency spectrum of healthy bearing at 900 rpm under100 N radial load; b) frequency spectrum of inner race defect at 900 rpm under 100 N radial load, c) Frequency spectrum of outer race defect at 900 rpm under 100 N radial load
a)
b)
c)
4.2.2. Effect of load
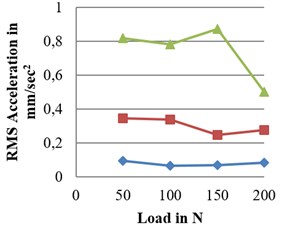
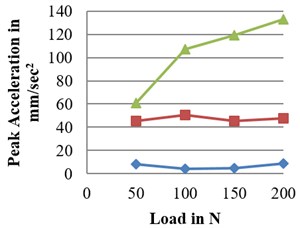
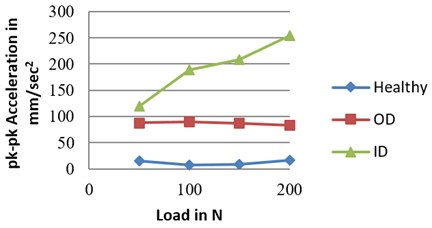
The values of peak and RMS amplitude for all types of bearing are showing considerable change with respect to load at any constant speed. Fig. 5(a) to 5(c) shows amplitudes of healthy, outer race defected bearing and inner race defected bearing at 900 rpm and at different loads. From Fig. 5, it is clear that vibration amplitude levels of bearings with inner race defect are higher than amplitude level of bearing with outer race defect. This is because of the extended defect on inner race is moving in and out of load zone which give strong vibration response in the load zone whereas more vibration is to be transferred from shaft to inner race.
Fig. 4Amplitude vs speed at 100 N load for defected bearings: a) RMS b) peak c) peak to peak
c)
b)
c)
Fig. 5Amplitude vs load at 900 rpm for defected bearings: a) RMS, b) peak, c) pk-pk
a)
b)
c)
The better results are given by bearing with outer race defect in which position of defect with respect to sensor is fixed as outer race of bearing is stationary. However, vibration response of healthy bearings is observed to be less as compared to defective bearings.
4.2.3. Kurtosis
As discussed in Section 2, kurtosis is one of the important statistical indicators for fault detection in rolling bearings. Figs. 6 and 7 shows the variation of kurtosis with increase in speed and the radial load. It is particularly useful in the detection of bearing failure which compromise measurement between the insensitive lower moments and the over-sensitive higher moments.
It compares the distribution data with Gaussian type of distribution given by:
where xi is vibration amplitude in time history, μ is average, σ is standard deviation, N is test numbers.
It is seen that the value of kurtosis for good bearing is close to 4 which indicate the fault free state of the bearing. However, for defects on the inner race, outer race the value of kurtosis lies between 5 and 25. This is the clear indication of the defects in the bearing.
Fig. 6Kurtosis vs speed for healthy and defected bearings
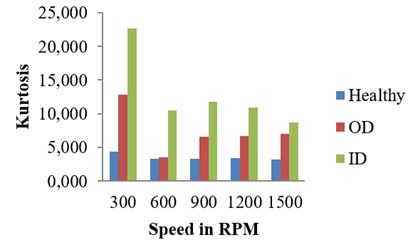
Fig. 7Kurtosis values for different bearings running at radial load of 100 and 200 N
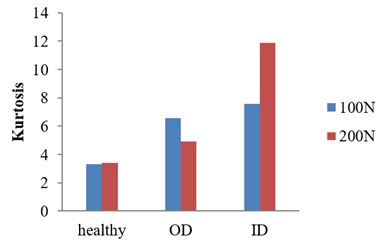
For inner and outer race defects the kurtosis value exceeds 6, which shows larger indication of damage on inner and outer race ways. Hence kurtosis value shows the state of the bearing. Overall comparison of bearing conditions for all vibration parameters shows that Peak to peak amplitudes gives better defect delectability than other parameters for healthy, bearing with outer race defect and bearing with inner race defect. However, in comparison with outer race defected bearing inner race defected bearing shows higher amplitude for all vibration parameters.
5. Conclusions
The comparison of parameters of vibration acceleration signal for differently defected bearings is emphasized in the present work and following conclusions are made:
1) Based on the studies carried out on vibration monitoring of bearings, it can be concluded that FFT spectrum indicate the location of the fault.
2) Defect detectability with outer and inner race defect is successfully obtained using statistical analysis. However, inner race defect severity of amplitude shows at higher end due to resonance generated instability in the bearing on account of movable defect.
3) Inner race defect gives better response to speed variation. However, outer race defect gives better response at high load.
4) For defected bearings peak to peak amplitude response gives better results followed by peak amplitude and RMS amplitude.
5) Kurtosis has shown good sensitivity in the fault detection of bearing. However, it gives low severity towards healthy bearing.
References
-
Howard I. A Review of Rolling Element Vibration: Detection, Diagnosis and Prognosis. Technical Report DSTO-RR-0013, Defense Science and Technology Organization, Australia, 1994.
-
Tondon N., Choudhary A. A review of vibration and acoustic measurement methods for the detection of defects in rolling element bearings. Tribology International, Vol. 32, 1999, p. 469-480.
-
McFadden P. D., Smith J. D. Model for the vibration produced by a single point defect in a rolling element bearing. Journal of Sound and Vibration, Vol. 96, 1984, p. 69-82.
-
Choudhary A., Tondon N. Vibration response rolling element bearings in a rotor bearing system to a local defect under radial load. Journal of Tribology, Vol. 128, Issue 2, 2006, p. 252-61.
-
Singh Sarbjeet, Howard C. An Extensive review of vibration modeling of rolling element bearings with localized and extended defects. Journal of Sound and Vibration, Vol. 357, 2015, p. 300-330.
-
Tondon N., Choudhury A. Theoretical model to predict the vibration response of rolling bearings in a rotor bearing system to distributed defects under radial load. Journal of Tribology, Vol. 122, Issue 3, 2000, p. 609-615.
-
Shah Dipen, Patel Vinod A review of dynamic modeling and fault identifications method for rolling element bearing. Procedia Technology, Vol. 14, 2014, p. 447-456.
-
McFadden P. D., Smith J. D. Vibration monitoring of rolling element bearings by high frequency resonance technique – a review. Tribology International, Vol. 17, Issue 1, 1984, p. 3-10.
-
Tondon N. A comparison vibration parameters of the condition monitoring of rolling element bearing. Measurement, Vol. 12, 1994, p. 285-289.
-
Utpat Abhay, Ingle R., Nandgaonkar M. Response of various vibration parameters to the condition monitoring of ball bearing used in centrifugal pumps. Noise and Vibration Worldwide, Vol. 42, Issue 6, 2011, p. 34-40.
-
Dyer D., Stewart R. M. Detection of rolling element bearing damage by statistical vibration analysis. ASME, 1977, p. 26-30.
-
Heng R. B. W., Nor M. J. Statistical analysis of sound and vibration signals for monitoring rolling element bearing condition. Applied Acoustics, Vol. 53, Issues 1-3, 1998, p. 211-296.
-
Prabhakar S., Mohanty A. R., Sekhar A. S. Application of discrete wavelet transform for detection of ball bearing race faults. Tribology International, Vol. 35, 2002, p. 793-800.
-
Harris T. A. Rolling Bearing Analysis. 4th edition, John Wiley, New York, 2001.
