Abstract
Most of the published researches on the vibration isolation performance of the commercial vehicle focus on the suspension system and the power-train system, and few of them focus on the cabin. Moreover, the researches on the cabin mostly focus on how to reduce the interior noise, and the interior vibration characteristics have not received adequate attention. Therefore, this paper tries to research the vibration characteristics of the commercial-vehicle cabin in order to improve ride comfort. Firstly, the vibration characteristic of the cabin was tested on the actual road. Then, the rigid-flexible coupling dynamic model of the commercial vehicle was built, and the computational results were compared with the experimental results. It was found that the results were consistent with each other, which showed that the computational model was reliable. Finally, based on the verified computation model, some parameters that influenced the vibration characteristic of the cabin were explored. As a result, the influencing tendency of each parameter to the cabin vibration under each working condition was obtained, but influencing levels of each parameter cannot be analyzed quantitatively. In order to research the contribution degree of each parameter to the vibration in cabin, DOE (Design of Experiment) method was used for the analysis to provide references for the optimal matching of a cabin suspension system. Then, the vibration in the cabin was optimized based on genetic algorithm to obtain the optimal performance. This research can provide a reference for the other researches on the reduction vibration for the cabin.
1. Introduction
In recent years, commercial vehicles are making rapid development, with their production and sales climbing year by year. Meanwhile, the market has proposed higher requirements for the performance, especially in terms of ride comfort for commercial vehicles. Due to the complex working conditions for commercial vehicles and the long duration of driving in long-distance transportation, the commercial vehicle drivers can easily suffer fatigue, which will bring serious impact on their health and may even cause traffic accidents. Therefore, the improvement of the ride comfort for commercial vehicles has become a hot topic of the research in the automotive industry. Most of the published researches on the vibration isolation performance for commercial vehicles focus on in the suspension system and the powertrain system, and few of them focus on the cabin. Moreover, the researches on the cabin mostly focus on how to reduce the interior noise [1-4], and the vibration characteristics of the cabin have not received adequate attention. Since the cabin mount system can simultaneously reduce the excitation from both the powertrain and the road, the research on the cabin mount system can effectively reduce the vibration in the cabin. And considering that vibration is the reason generating noise, the damping of vibration can lead to reduced noise.
By simplifying the commercial vehicle to a 12-degree-of-freedom system, Li analyzed the vibration isolation performance of the cabin mount system, and proposed an improved design. But this research process was not verified by experiment, thus the reliability of the results could not be guaranteed [5]. Through building the multi-body dynamic model of the commercial vehicle, Huh analyzed the influence of the gear mechanism for commercial vehicle’s gear box on vibration characteristics, and proposed two optimization strategies, namely, the active one and the passive one [6]. Wang built the model of the mount of the power-train system for the commercial vehicle, and also researched the vibration modal characteristics. However, the power-train was regarded as an independent object, the coupled analysis of the power-train and the whole vehicle was not conducted, thus the results were of little significance [7].
In this paper, the vibration characteristic of the cabin was firstly tested through road experiment. Then, the rigid-flexible coupling dynamic model of the commercial vehicle was built, and the simulation results were compared with the experimental results. It was found that the results were consistent with each other, which indicated that the simulation model was reliable. Finally, based on the verified simulation model, some parameters that influence the vibration characteristic of the cabin were explored. As a result, the influencing tendency of each parameter to the cabin vibration under each working condition was obtained, but influencing levels of each factor cannot be analyzed quantitatively. In order to research the contribution degree of each factor to the vibration in cabin, DOE (Design of Experiment) method was used for the analysis to provide references for the optimal matching of a cabin suspension system. Then, the vibration in the cabin was optimized based on genetic algorithm to obtain the optimal performance. This research can provide a reference for the other researches on the reduction vibration for the cabin.
2. Road experiment for the commercial vehicle
Using PCB three-axis acceleration sensor and DEWETRON data collection system, this test was conducted in a straight road. And the experimental road can be regarded as B-level road. Wind velocity is less than 5 m/s and outdoor temperature is 25 °C. As for the working condition in the test, the vehicle made uniform linear motion at the speed of 30 km/h, 40 km/h, 50 km/h, 60 km/h and 70 km/h, respectively. The experimental data were obtained by the data collection system, and the sampling frequency was set to 3000 Hz. Each experiment was carried out for three times. The average value of three experiment results was taken as the final result. As shown in Fig. 1, the accelerations of the cabin seats, the steering system and the top of the commercial vehicle were measured, respectively. Through processing and analyzing the collected data, the vibration acceleration and power spectral density at each measured point were obtained, as shown in Fig. 2-4.
Fig. 1The position of the acceleration sensors for the commercial vehicle
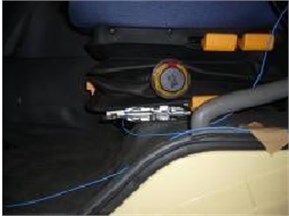
a) The acceleration sensor at the seat
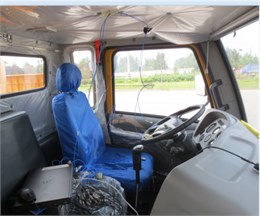
b) The acceleration sensor in the steering system
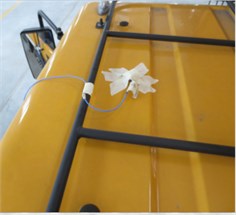
c) The acceleration sensor at the cabin top
According to Fig. 2-4, the peak frequencies of the power spectral densities in the seat and the cabin top were mainly distributed at 1 Hz-3 Hz, while that of the steering room was 6.4 Hz. Moreover, the power spectral density of the steering system was obviously larger than those of the seat and the cabin top, mainly because the steering system was directly connected to the power-train system and its vibration was not reduced by the other transmission paths. As can be seen from Fig. 2(a), the maximum and minimum values of seat vibration acceleration were 0.25 m/s2 and 0.30 m/s2 respectively. Maximum and minimum values of steering system vibration acceleration were 0.45 m/s2 and –0.4 m/s2 respectively. Maximum and minimum values of cabin vibration acceleration were 0.38 m/s2 and –0.4 m/s2 respectively. In addition, the power spectral density of seat vibration acceleration only had one obvious peak value, while the vibration acceleration power spectral densities of steering system and cabin had a lot of peaks.
Fig. 2The measurement results of the seat acceleration in the seat
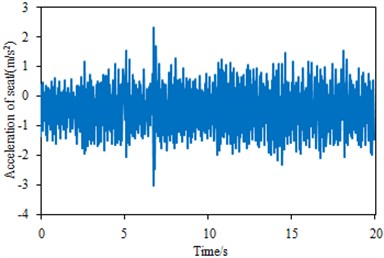
a) The vertical acceleration in the seat
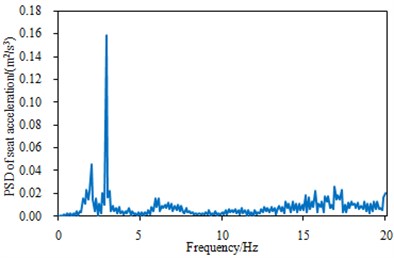
b) The power spectral density of the vertical acceleration in the seat
Fig. 3The measurement results of the vertical acceleration in the steering system
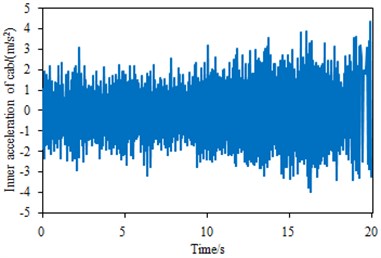
a) The vertical acceleration in the steering system
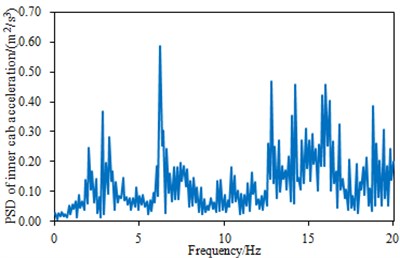
b) The power spectrum density of the vertical acceleration in the steering system
Fig. 4The measurement results of the vertical acceleration in the cabin top
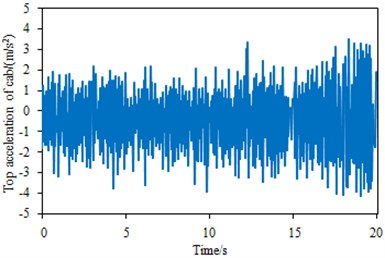
a) The vertical acceleration in the cabin top
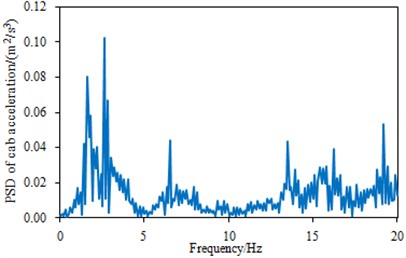
b) The power spectral density of the vertical acceleration in the cabin top
3. The multi-body dynamic simulation
3.1. The multi-body dynamic model of the commercial vehicle
The vehicle system is a multi-degree-of-freedom vibration system, are mutually different in mass, damping and stiffness properties. In different working conditions and the road surface, the vibration of the vehicle system is complex, and the vibration of all the subsystems can be easily coupled, thus the vibration in the cabin is intensified. Through building the multi-body dynamic model of the whole vehicle, the vibration response within the cabin and the vibration isolation performance of the cabin mount system can be analyzed and evaluated with considering various factors, so as to enable more faithful, accurate analysis and evaluation of the cabin mount system as well as the accurate optimization and configuration of the cabin mount system. The multi-body dynamic models [8-10] of the moving system (frame, axle, tire and suspension), the steering system, the power-train system and the suspension system were separately built using ADAMS, before all the subsystems were fit together according to their topological relationships in the whole vehicle, and the rigid-flexible coupling model of the assembled is finally obtained. In the multi-body dynamic model of the whole vehicle, the modes of the cabin and the frame can be computed and analyzed, as shown in Fig. 5.
Fig. 5The mode distributions of the frame and the cabin
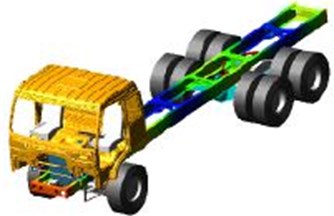
a) The flexible-body mode of the frame
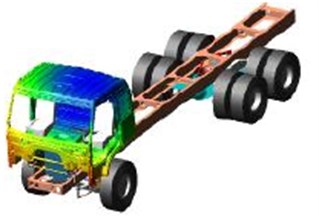
b) The flexible-body mode of the cabin
3.2. The random road profile
As the main excitation source during the driving process of the vehicle, the road profile might be directly affected the accuracy of its simulation result due to the consistency between it and actual road profile.
The fluctuation of road profile is generally expressed by road roughness. Under the effect of road roughness, the vibration excitation might be acted on tires and transmitted to the cabin through the suspension, frame and cabin mounts. Road roughness is usually described by the stationary random process theory, which usually measures and analyzes large numbers of road roughness data to obtain power spectral density and other statistical data.
Road profile method is recommended among all classification standards of road levels. Without road phase in road profile, the reconstruction of road profile can be applied to form the road roughness, so as to simulate the road profile. The road surface model is usually divided into the time domain and frequency domain, and the commonly used construction methods include harmonic superposition method, AR model method, white noise shaping filter method and ARMR model method [11-13]. The harmonic superposition method is mainly employed in the paper to build the necessary road profile model for simulation, which constructs a pavement through superimposing harmonics functions with different phases and different frequencies. The displacement power spectral density of road roughness can be expressed as the following equation:
wherein: Gq(n) is the power spectral density of road roughness, with the unit of m3. Gq(n0) is the road roughness factor under the reference spatial frequency, with the unit of m3. n is the spatial frequency, with the unit of m-1. n0 is the reference spatial frequency, n0=0.1m-1. ω is the frequency coefficient, generally ω= 2, which determines the frequency structure of the road spectrum.
In the spatial frequency n1<n<n2, the road roughness variance σ2z can be expressed as the following equation:
If the spatial frequency is dispersed into n small sections in the section from n1 to n2, the corresponding spectral density Gq(nmid-i) of center frequency nmid-i in each section is chosen as the section value, and then the Eq. (2) can be expressed as below:
The sine function, with the expression of2√Gq(nmid-i)*Δni*sin(2πnmid-ix+θi), of center frequency nmid-i corresponding to each section is established, whose standard deviation is √Gq(nmid-i)*Δni. If the sine function of each section is made superimposing sum, the spatial profile of a random road profile can be obtained:
where: θ is the sine function phase, which is randomly distributed within [0,2π]. x is the length of the road.
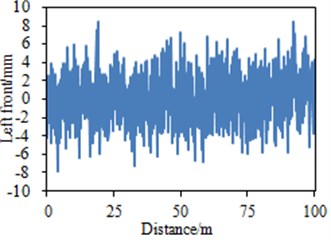
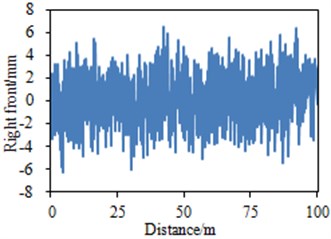
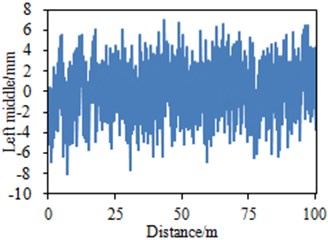
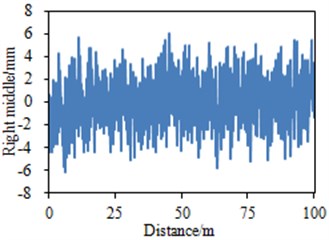
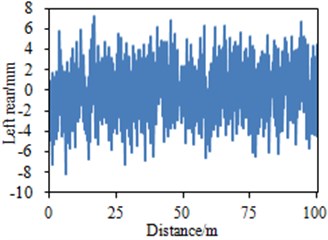
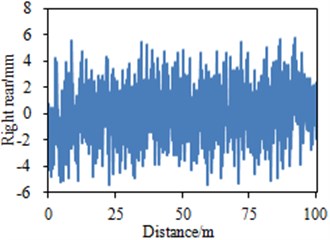
According to the simulation, the harmonic superposition method is applied to construct the model of B-level roads. The Gq(n0) value of B-level roads is 64×10-6 m3, and Gq(nmid-i) value within each section is determined by the mean value of displacement power spectral density corresponding to 1/3 octave center frequency of B-level roads. Finally, the road profile of each tire can be obtained as shown in Fig. 6.
Based on Fig. 6, the simulation of the whole vehicle model was conducted at the speed velocities of 30 km/h, 40 km/h, 50 km/h, 60 km/h and 70 km/h, respectively. Then, the root mean square (RMS) values of the accelerations for all the conditions between the simulation and the experiment were compared to verify the accuracy of the simulation model, and the comparison results are shown in Table 1, Table 2 and Table 3. It can be seen that the relative errors between the experimental values and the simulation values were below 6 % [14], which is acceptable in engineering. Thus the rigid-flexible coupling dynamic model built here is reliable.
Table 1The experimental and simulation values of the acceleration RMS in the seat
Velocity (m/s) | Experimental value (m/s2) | Simulation value (m/s2) | Relative error |
30 | 0.5205 | 0.5067 | 2.6 % |
40 | 0.6328 | 0.6098 | 3.5 % |
50 | 0.6936 | 0.6613 | 4.6 % |
60 | 0.7752 | 0.7496 | 3.3 % |
70 | 0.9583 | 0.9263 | 3.3 % |
Table 2The experimental and simulation values of the acceleration RMS in the steering system
Velocity (m/s) | Experimental value (m/s2) | Simulation value (m/s2) | Relative error |
30 | 0.7182 | 0.6924 | 3.6 % |
40 | 0.8334 | 0.7995 | 4.1 % |
50 | 0.9437 | 0.8939 | 5.3 % |
60 | 1.0032 | 0.9792 | 2.4 % |
70 | 1.1057 | 1.0576 | 4.3 % |
Table 3The experimental and simulation values of the acceleration RMS in the cabin-top
Velocity (m/s) | Test value (m/s2) | Simulation value (m/s2) | Relative error |
30 | 0.3892 | 0.3721 | 4.1 % |
40 | 0.4466 | 0.4297 | 3.7 % |
50 | 0.5008 | 0.4804 | 4.0 % |
60 | 0.5527 | 0.5263 | 4.8 % |
70 | 0.6009 | 0.5684 | 5.4 % |
Fig. 6The random road profiles of B-level road for the commercial vehicle
4. The impact of the vehicle parameters on the cabin vibration characteristics
The interior vibration of the cabin mainly comes from two transmission paths, namely, “road→tire→axle→suspension→frame→cabin mount→cabin” and the other path is as follows, “power-train→power-train suspension→frame→cabin mount→cabin”. In two paths, the parameters that influence the vibration of the cabin are mainly the stiffness of the front and rear mounts, the damping of the front and rear suspension, the stiffness of the power-train mount, and the stiffness and damping of the cabin suspension system.
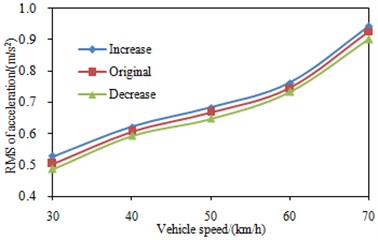
Through changing these parameters while maintaining the vehicle velocity and vehicle working conditions, the root mean square value of the acceleration in the seat was investigated, in order to research the effect of the changes of these parameters on the external vibration.
4.1. The impact of the stiffness for the front and rear mount springs of the cabin
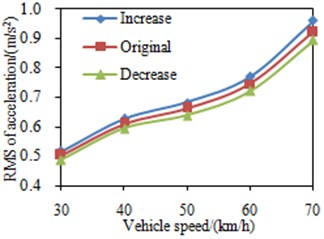
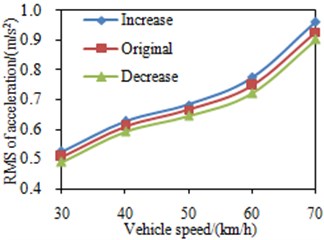
At each vehicle velocity, the stiffness of the front and rear suspension coil springs in the cabin was changed by ±20 %. Fig. 7 shows the impact of the changes in the stiffness of the front and rear suspension coil springs. According to the simulation results, RMS value of the acceleration in the seat increases with the stiffness of the front and rear cabin mounts increases, and drops with the latter decreases. The main reason is that the excitation frequency for the cabin mount system is mostly higher than the intrinsic frequency of the system, and with the increase of the stiffness, the intrinsic frequency of the cabin mount system rises and gets close to the excitation frequency, thus the vibration enlarges; on the other hand, reducing the stiffness can alleviate the vibration at the slide.
Fig. 7RMS values of the seat accelerations under different mount stiffness
a) The front mounts
b) The rear mounts
4.2. The impact of the damping for the front and rear mounts of the cabin
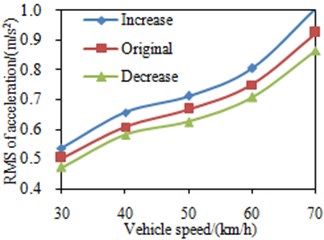
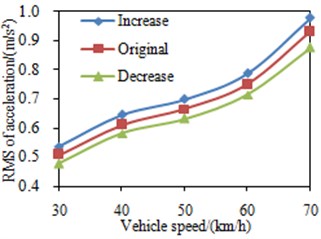
At each vehicle velocity, the damping coefficients of the front and rear cabin mounts were changed by ±20 %. RMS values of the accelerations in the seat are shown in Fig. 8. RMS value of the accelerations in the seat increases with the increase of the damping coefficient, and drops with the decrease of the damping coefficient. In the steady working condition, the excitation for the cabin mount system is mainly from the excitation that is higher than its own natural frequency, thus increasing the damping will lead to larger vibration transmissibility of the cabin mount system and therefore larger vibration transmitted to the cabin.
4.3. The impact of the suspension stiffness
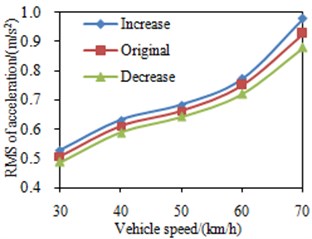
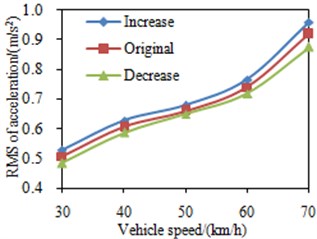
At each vehicle velocity, simulation was conducted through changing the stiffness of the front suspension and the balanced suspension by ±20 %. Fig. 9(a) shows the impact of the change of the front suspension’s stiffness on RMS values of the seat accelerations. According to the simulation results, the vibration increases with the increase of the suspension’s stiffness, and decreases with the decrease of the stiffness. The natural frequency of the sprung mass was 2.73 Hz, thus reducing the suspension stiffness could expand the suspension system’s damping of above 2.73 Hz vibration, thereby lowing the vibration within the cabin; on the other hand, increasing the suspension stiffness will strengthen the vibration within the cabin. The impact of the change of the balanced suspension’s stiffness on RMS values of the seat accelerations is shown in Fig. 9(b), and it can be seen that the curve is basically identical with that of the impact of the change in the front suspension’s stiffness.
Fig. 8RMS value of the seat acceleration under different mount damping
a) The front mounts
b) The rear mounts
Fig. 9RMS values of the seat accelerations under different suspension stiffness
a) The front mounts
b) The rear mounts
4.4. The impact of the suspension damping
At different vehicle velocity, the simulation was conducted by changing the damping coefficient of the front suspension by ±20 %, and the results were as shown in Fig. 10. The simulation curve indicates that the seat vibration decreases with the increase of the suspension damping, and increases with the decrease of the suspension damping. The main reason is as follows: the natural frequency of the sprung mass of the suspension was close to that of the cabin mount system, and the resonance phenomenon occurred when the vehicle was moving; consequently, increasing the damping could reduce amplitude of the natural-frequency vibration of the sprung mass of the suspension, thus the vibration transmitted to the cabin was decreased.
4.5. The influence of the power-train mount’s stiffness
At different vehicle velocity, the influence of the change of the power-train mount’s stiffness on the vibration inside the cabin was simulated by changing the stiffness of the power-train mount by ±20 %, and the results are shown in Fig. 11. According to this figure, the seat acceleration increases with the increase of the power-train mount’s stiffness, and decreases with the decrease of the power-train mount’s stiffness. The main reason is that: under the working condition, the range of the rotational velocity of the power-train was 1630 rpm-2040 rpm, and the 3-order excitation frequencies were 81.5 Hz-102 Hz, greater than the natural frequency of the power-train mount system; therefore, the decrease of the stiffness would lead to the decrease of the natural frequency of the power-train mount and the increase of the vibration isolation rate of the power-train mount, thus the vibration transmitted from the power-train to the cabin was reduced.
Fig. 10RMS values of the seat accelerations under different suspension damping
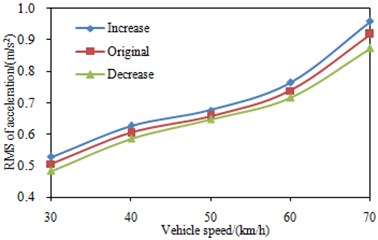
Fig. 11RMS values of the seat accelerations under different power-train stiffness
5. Optimization of vibration in the cabin based on DOE and genetic algorithm
Influences brought by major vehicle parameters to vibration in the cabin are analyzed in Section 4, so that the influencing tendency of each parameter to the cabin vibration under each working condition is obtained, but influencing levels of each factor cannot be analyzed quantitatively. In order to research the contribution degree of each factor to the vibration in cabin, DOE [15, 16] method was used for the analysis to provide references for the optimal matching of a cabin suspension system. Experimental factors are as follows: 8 variables including front mount stiffness of cabin, rear mount stiffness of cabin, front mount damping of cabin, rear mount damping of cabin, stiffness of a front suspension, stiffness of a balanced suspension, damping of the front suspension and power assembly stiffness were taken as the research factors, wherein 3 levels were selected for each factor. The contribution degree of each factor was finally calculated, as shown in Table 4. It is shown in the table that the cabin mount damping factor influenced the cabin vibration to the greatest extent, while cabin mount stiffness ranked the second place. Suspension stiffness of the cabin is directly related with handling stability of the vehicle, so that improvement and optimization shall be carried out mainly to the cabin mount parameters so as to improve the vibration performance of cabin. In this way, vibration in the cabin can be reduced to the hilt on the premise of guaranteeing the handling stability.
Front mount stiffness, rear mount stiffness, front mount damping and rear mount damping of the cabin as well as position coordinates were taken as design variables. According to technical indexes of the test vehicle, the dynamic deflections of front and rear mounts were set as constraint conditions of a mathematical model. The optimization model selected multiple objectives which are respectively root mean square value of comprehensive weighting acceleration of the cabin, root mean square value of angular accelerations of the cabin pitch angle, and root mean square value of angular accelerations of the cabin roll angle. Therefore, the mathematical optimization model of the vibration system of the cabin can be expressed as follows:
where az is the root mean square value of comprehensive weighting acceleration of the cabin. φ is the root mean square value of angular accelerations of the roll angle. θ is the root mean square value of angular accelerations of the pitch angle. dqr.ql is dynamic deflection of the cabin front mount; dhxr,hxl is dynamic deflection of the cabin rear mount. Kqr,ql is the front mount stiffness of the cabin. Khxr,hxl is the rear mount stiffness of the cabin. Cqr,ql is the front mount damping of the cabin. Chxr,hxl is the rear mount damping of the cabin. Xqr,ql is the position of the cabin’s front mount in X direction. Yqr.ql is the position of the cabin’s front mount in Y direction. Xhxr,hxl is the position of the cabin’s rear mount in X direction. Yhxr,hxl is the position of the rear mount in Y direction.
Table 4Contribution degree of each influencing factor
Parameters | Front mount damping | Rear mount damping | Front mount stiffness | Rear mount stiffness |
Contribution degree | 22.81 % | 21.98 % | 13.86 % | 12.69 % |
Parameters | Stiffness of the front suspension | Stiffness of the balanced suspension | Damping of the front suspension | Power assembly stiffness |
Contribution degree | 12.57 % | 7.98 % | 5.65 % | 2.46 % |
Variables in a cabin mount system have complex relations with objective functions, wherein a lot of local optimum solutions exist. Therefore, it is feasible to apply genetic algorithms [17, 18] in optimization design. This is because that genetic algorithm adopts a multipoint parallel manner in space search, wherein each search point is taken as an organism, fitness of an individual to the environment is calculated at first, individuals with low fitness levels are then eliminated, and individuals with high fitness levels are added. Alternative simulation is carried out according to this method, and the globally optimal solution can be obtained finally.
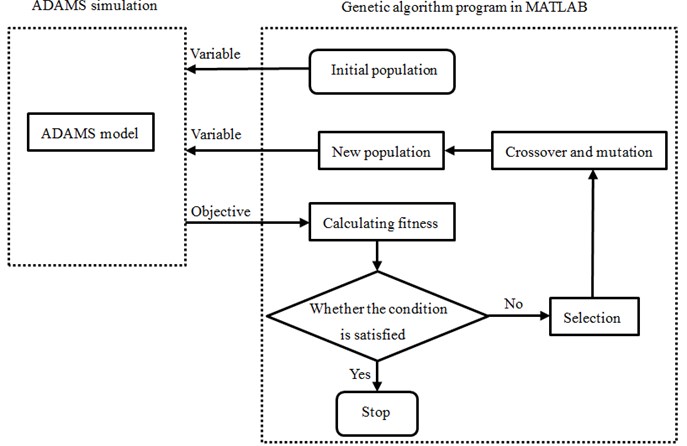
The paper combines ADAMS software and MATLAB software with simulation to realize genetic algorithm optimization. Optimization processes are shown in Fig. 12. At first, design variables were parameterized in ADAMS. Relevant relations were established with MATLAB optimization program through an interface. Individuals in the algorithm consisted of stiffness, damping and position parameters of the cabin mount system. During the optimization program, binary codes were established for the variables according to constraint conditions, and an initial population with 200 individuals was generated. Simulation analysis was carried out by ADAMS. Simulation results were input into MATLAB optimization program so as to determine whether they were satisfied.
Fig. 12Flow of optimization through genetic algorithm
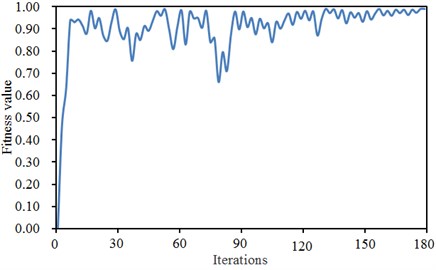
Before searching of genetic algorithm, the objective function was encoded into a binary system character string with a fixed length, namely chromosomes. Different combinations of these character strings constituted different search points in the searching space. The initial size of a population was set to be 200. Selection of fitness directly influenced the convergence speed of genetic algorithm and whether an optimal solution can be found. The fitness was a positive number in general. For a maximization problem, the fitness was always an objective function problem. Conversely, regarding a minimization problem, the fitness was a negative number of the objective function. The paper took an objective function as the fitness. The changing curve of the fitness during optimization was shown in Fig. 13. It was shown in the figure that when the evolution continued to the 180th generation, the fitness was basically stable. Individuals of which the fitness was stable during evolution were selected. Some chromosomes among the selected 200 individuals were exchanged by a certain probability to generate 200 new individuals. The crossover probability was set to be 0.92. The selected 200 individuals were mutated under the given probability to form a new generation of population. The mutation probability in the paper was 0.05.
The paper conducted on the optimal design of the vibration of the cabin by genetic algorithm. Its necessity can be illustrated from the following aspects.
1) Genetic algorithm was a random global search and optimization algorithm developed based on biological evolution mechanism in the nature. It can solve very complicated problems reliably. Based on single-point searching, traditional optimization algorithms always cannot find globally optimal solutions of complicated problems. Based on parallel search, genetic algorithm had high capability of global optimization. The optimization variables in the paper can be very easily encoded into genes required by genetic algorithm and can also conveniently represent feasible solutions in the genetic algorithm. Therefore, genetic algorithm was highly applicable in solution and optimization of commercial vehicle vibration characteristics.
2) The paper was a multi-objective optimization problem. Genetic algorithm has been widely used and verified in multi-objective optimization. In addition, there were many variables in optimization and the multi-objective optimization problem was complicated, so that it was suitable to optimize this problem by genetic algorithm.
3) Research in this paper was carried out based on commercial software Matlab and Adams. Matlab integrated processes of genetic algorithm and also contained interfaces related to Adams. When the two kinds of software were used to optimize commercial vehicle vibration characteristics, only some parameters in the software need to be modified. It was unnecessary to spend much time programming new programs for the computation. Therefore, the computational efficiency was increased. This method has been used extensively.
Fig. 13Convergence curve of genetic iterative process
50 km/h is commonly used in the commercial vehicle, so that the optimization analysis was based on such speed. Comparison of results before and after the optimization is shown in Table 5. After the optimization, the root mean square value of cabin vibration accelerations decreased from 0.80 to 0.56; the pitch angle acceleration decreased from 0.35 to 0.23; and roll angle acceleration decreased from 0.38 to 0.21. Therefore, cabin vibration characteristics can be optimized very obviously by this optimization algorithm. During manufacture of the commercial vehicle, such optimization strategy can be used to design products with better comfort and handling stability.
Table 5Comparison of variables, objectives and constraints before and after optimization
Parameters | Initial value | Optimized value | Unit |
Front mount deflection | 45.0 | 43.2 | mm |
Rear mount deflection | 46.1 | 44.3 | mm |
Front mount stiffness | 206 | 155 | N/mm |
Rear mount stiffness | 55 | 38.5 | N/mm |
Front mount damping | 7.2 | 5.6 | N.s/mm |
Rear mount damping | 7.3 | 5.8 | N.s/mm |
Position of front mount in X direction | –1201 | –1123 | mm |
Position of front mount in Y direction | 546 | 463 | mm |
Position of rear mount in X direction | 635 | 605 | mm |
Position of rear mount in Y direction | 520 | 481 | mm |
Comprehensive acceleration of cabin | 0.80 | 0.56 | m/s2 |
Pitch angle acceleration of cabin | 0.35 | 0.23 | rad/s2 |
Roll angle acceleration of cabin | 0.38 | 0.21 | rad/s2 |
6. Conclusions
This paper tries to study the vibration characteristics of the commercial-vehicle cabin in order to improve ride comfort. Firstly, the vibration characteristic of the cabin was tested through road experiment, and it can be found from the experimental results that the vibration in the steering system is more than the other positions. Then, the rigid-flexible coupling dynamic model of the commercial vehicle is built to compute the vibration characteristics, and the computational results are then compared with the experimental results. It was found that the results are consistent with each other, which indicates that the simulation model is reliable. Finally, based on the verified simulation model, some parameters such as the stiffness of the front and rear mounts, the damping of the front and rear mount, the stiffness of the power-train mount, and the stiffness and damping of the cabin suspension system which influence the vibration characteristic of the cabin are explored. As a result, the influencing tendency of each parameter to the cabin vibration under each working condition was obtained, but influencing levels of each factor cannot be analyzed quantitatively. In order to research the contribution degree of each factor to the vibration in cabin, DOE method was used for the analysis to provide references for the optimal matching of a cabin suspension system. Then, the vibration in the cabin was optimized based on genetic algorithm to obtain the optimal performance. This research can provide a reference for the other researches on the reduction vibration for the cabin.
References
-
Behzad M., Hodaei M., Alimohammadi I. Experimental and numerical investigation of the effect of a speed bump on car noise emission level. Applied Acoustics, Vol. 68, Issue 11, 2007, p. 1346-1356.
-
Lee S. J., Kang B. O., Jung H. Y., et al. Statistical model-based noise reduction approach for car interior applications to speech recognition. ETRI Journal, Vol. 32, Issue 5, 2010, p. 801-809.
-
Calvo J. A., Álvarez-Caldas C., San Román J. L., et al. Influence of vehicle driving parameters on the noise caused by passenger cars in urban traffic. Transportation Research Part D: Transport and Environment, Vol. 17, Issue 7, 2012, p. 509-513.
-
Braun M. E., Walsh S. J., Horner J. L., et al. Noise source characteristics in the ISO 362 vehicle pass-by noise test: literature review. Applied Acoustics, Vol. 74, Issue 11, 2013, p. 1241-1265.
-
Li P. F., Ma L., He T. M. A simulation study on vibration isolation of cabin mounts in a commercial vehicle. Automotive Engineering, Vol. 27, Issue 6, 2005, p. 740-743.
-
Huh K., Choi J., Yoo H. Development of a multi-body dynamics simulation tool for tracked vehicles. Part 2: application to track tension controller design. JSME International Journal, Series C, Vol. 46, Issue 2, 2003, p. 550-556.
-
Wang Y. N., Lv Z. H. A study of vibrational modal characteristics of commercial vehicle multi-rigid-body power-train with mounting systems. China Mechanical Engineering, Vol. 22, Issue 28, 2011, p. 2253-2258.
-
Rubinstein D., Hitron R. A detailed multi-body model for dynamic simulation of off-road tracked vehicles. Journal of Terramechanics, Vol. 41, Issue 2, 2004, p. 163-173.
-
Ippili R. K., Davies P., Bajaj A. K., et al. Nonlinear multi-body dynamic modeling of seat-occupant system with polyurethane seat and H-point prediction. International Journal of Industrial Ergonomics, Vol. 38, Issue 5, 2008, p. 368-383.
-
Hegazy S., Rahnejat H., Hussain K. Multi-body dynamics in full-vehicle handling analysis under transient manoeuvre. Vehicle System Dynamics, Vol. 34, Issue 1, 2000, p. 1-24.
-
Verros G., Natsiavas S., Papadimitriou C. Design optimization of quarter-car models with passive and semi-active suspensions under random road excitation. Journal of Vibration and Control, Vol. 11, Issue 5, 2005, p. 581-606.
-
Litak G., Borowiec M., Friswell M. I., et al. Chaotic response of a quarter car model forced by a road profile with a stochastic component. Chaos, Solitons and Fractals, Vol. 39, Issue 5, 2009, p. 2448-2456.
-
Hongbin R., Sizhong C., Zhicheng W. Model of excitation of random road profile in time domain for a vehicle with four wheels. International Conference on Mechatronic Science, Electric Engineering and Computer, 2011, p. 2332-2335.
-
Zhang L. Structural Design and Development for Magnesium Front End and Optimization Research on Its NVH Performance. Zhejiang University, 2014.
-
Kim N. H., Choi M. H., Kim S. Y., et al. Design of experiment (DOE) method considering interaction effect of process parameters for optimization of copper chemical mechanical polishing (CMP) process. Microelectronic Engineering, Vol. 83, Issue 3, 2006, p. 506-512.
-
Park J., Lee K. S., Song S., et al. Numerical study of a light-duty diesel engine with a dual-loop EGR system under frequent engine operating conditions using the DOE method. International Journal of Automotive Technology, Vol. 11, Issue 5, 2010, p. 617-623.
-
Emami A., Noghreh P. New approach on optimization in placement of wind turbines within wind farm by genetic algorithms. Renewable Energy, Vol. 35, Issue 7, 2010, p. 1559-1564.
-
Valdez F., Melin P., Castillo O. An improved evolutionary method with fuzzy logic for combining particle swarm optimization and genetic algorithms. Applied Soft Computing, Vol. 11, Issue 2, 2011, p. 2625-2632.

