Abstract
This paper investigates design, modelling, and test issues related to piezoelectric energy transducer. The model analyzes a rail-borne “seismic” energy harvester that is designed to generate electrical energy from local variations in rail acceleration. The energy harvester analyzed in this model consists of a piezoelectric PZT film clamped at one end to the rail with a tip mass mounted on its other end. It includes two sub-models in this paper: a vehicle-track interaction model considering vehicle travelling load; and a cantilevered piezoelectric beam model for the visualization of voltage and power profile and frequency response. Four rail irregularities (American 6th grade track spectrum, Chinese track spectrum, German high and low-disturbance track spectrum) are compared and implemented into the calculation script. The calculated results indicate a rail displacement of 0.2 mm to 0.8 mm. Vibration tests of the proposed rail-borne device are conducted; a hydraulic driven system with excitation force up to 140 kN is exploited to generate the realistic wheel-rail interaction force. The proposed rail-borne energy harvester is capable of energy harvesting at low-frequency (5 Hz to 7 Hz) and small railway vibration (0.2 mm to 0.4 mm rail displacement). The output power of 4.9 mW with a load impedance of 100 kOhm is achieved. The open circuit peak-peak voltage reaches 24.4 V at 0.2 mm/7 Hz/5 g wheel-rail excitation. A DC-DC buck converter is designed, which works at the resonance frequency of 23 Hz/5 g on a lab vibration rig, providing a 3.3 VDC output.
1. Introduction
Energy harvesting is a field for capturing renewable energy, which has strong potential in prosperous applications such as wireless sensor networks (WSN), biosensor networks (BSN), and consumer electronics [1-4]. Vibration-based energy harvesting, as one of the most promising research fields, has been of significant interest in the last decade. The objective of vibration-based energy harvesting is to convert an external source of motion into the oscillation of a seismic mass suspended on a foundation by a combination of elastic elements. The choice of a specific transducer mechanism for vibration-based energy harvesting is mainly dependent on both the operating conditions (amplitude and frequency spectrum of the excitation source) and available space given by the application environment. Three major harvesting mechanisms include electrostatic, electromagnetic, and piezoelectric energy harvesters. All of these are very important topic for vibration engineering and thus have been investigated worldwide [1-52].
The phenomenon of piezoelectricity was investigated widely due to the unique characteristics of piezoelectric materials [5-52]. Energy harvesting devices based on piezoelectric materials are fabricated mainly by MEMs process [3, 5, 6]. Bridge rectifier and smoothing capacitor are used for obtaining DC output. In order to get stable voltage output as well as keeping the power dissipation of voltage regulator as small as possible, many researchers carried out many experiments and proposed several scenarios for power management and efficiency improvement [8-14]. Ottman et al. proposed an adaptive circuit for piezoelectric energy harvesting [8]. Step-down DC-DC converter was controlled by external source. Compared with circuit without DC-DC converter, the adaptive circuit could increase the efficiency to 74-88 % depended on the excitation.
Regard to the energy harvester specified for railway application, Nelson et al utilized both an inductive voice coil located near the rail and a piezoelectric device mounted under the rail for power harvesting for track monitor [20]. Wang et al. designed a mechanical power harvester with rack pinion, flywheel, and rotationally electromagnetic generator [21]. Pasquale et al. designed an energy harvester with magnetic suspensions [25]. The simulation indicated a low-frequency range (3 Hz to 5 Hz) vibration excitation (corresponding to vehicle speed of 80 km/h) with bogie displacement of 2 mm to 3 mm. The available testing results of the literatures above assumed a relative large track deflection, which varied from 2 mm (bogie-borne) to 19 mm (0.75 inch for rack and pinion solution); however, in the real scene, the range of track deflection is usually less than 3 mm for ballast track and less than 2 mm for continuous welded ballastless track, the latter has been used widely for high-speed railway transportation [24].
This motivated the authors for our research of design, modelling, fabrication, and response characterization of a rail-borne energy harvester for capturing energy of small rail vibration (0.2 mm to 1.0 mm) caused by wheel-rail excitation. In this paper, a rail-borne piezoelectric energy transducer was proposed and rail irregularity PSD excitation was integrated into a MATLAB script of vehicle-track coupled system. Furthermore, an electromechanical calculation of cantilevered piezoelectric beam model was carried out. Voltage and electrical power output of PZT transducer at open circuit as well as to the load impedance were tested on rail. And a DC-DC converter circuit was designed and tested at lab rig for converting alternating piezoelectric voltage to a 3.3 VDC output.
2. Analysis of railway vibration source
Mechanism of excitation of wheel-rail system includes:
a) Moving loads (quasistatic) excitation. It is normally expressed at fixed locations as a time-dependent dynamic action and causes flexural waves in the track and the ground. In case of high-speed trains travelling on soft ground, it may happen that the train speed exceeds the Rayleigh (surface) wave speed of the ground. If unmitigated, this could generate large vibration levels similarly to the sonic boom of supersonic aircraft.
b) Excitation caused by wheel/rail roughness, i.e. random irregularities of the contact surfaces, rail and wheel cause forced excitations of the system (vehicle/track). Roughness is inevitable during to limit of manufacturing capability and will vary with time in service. Normally, the wheel/rail roughness mainly contributes to the high-frequency vibration [31, 32] and is not in the scope of this paper.
c) Parametric excitation: For railway tracks with discrete rail support (e.g. sleepers on ballast, resilient base plates on slab as distinct from embedded rail), the wheel experiences a variation of stiffness depending upon its position along the rail. As illustrated in Fig. 1, harmonic components arise due to rail support spacing, intra/inter-bogie axle spacing, and intra/inter vehicle axle spacing. When these frequency matches the natural frequency of vehicle on the track system, considerable excitation could be propagated to track and rail system.
3. Design and modelling of rail-borne piezoelectric energy transducer
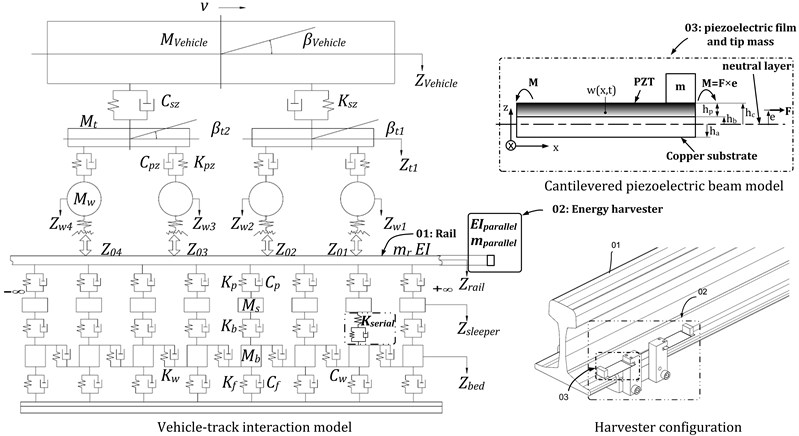
This model analyzes a rail-borne “seismic” energy harvester that is designed to generate electrical energy from local variations in rail acceleration. The energy harvester analyzed in this model consists of a piezoelectric PZT film clamped at one end to the rail with a tip mass mounted on its other end. It includes two sub-models in this paper: a vehicle-track interaction model described in Section 3.1 and a cantilevered piezoelectric beam model described in Section 3.2. The illustration and interaction of the two sub-models are shown in Fig. 2.
Fig. 1Source of wheelset/rail vibration: (s1 – rail support spacing, s2 – intra – bogie axle spacing, s3 – inter – bogie axle spacing, s4 – intra – vehicle axle spacing, s5 – inter – vehicle axle spacing, 1 – train speed, 2 – part of carriage mass, 3 – part of bogie mass, 4 – unsprung mass, 5 – wheel roughness, 6 – rail roughness, 7 – rail impedance, 8 – train support stiffness, 9 – formation stiffness, 10 – ground impedance)
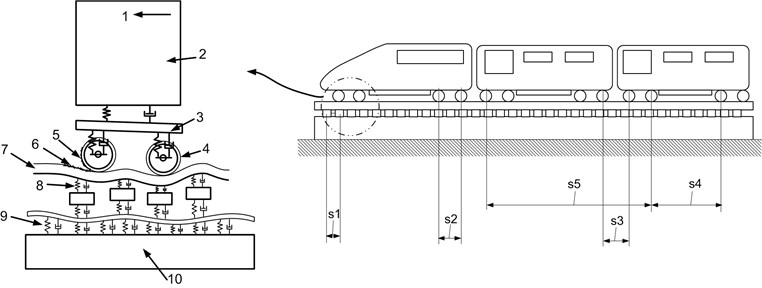
Fig. 2Vehicle-track interaction model and cantilevered piezoelectric beam model
3.1. Modelling of vehicle-track dynamics with energy transducers
The governing equation of vehicle-track system can be written in Matrix form [24]:
+[[K1][K2][K3][K4][K5][K6][K7][K8]][{Zv}{qr}{Zs}{Zb}]=[{Fv}{Fr}{Fs}{Fb}],
where [M] is the mass matrix, [C] is the damping matrix, [K] is the stiffness matrix, {Z} and {q} are the displacement column vector, and {F} represents the force column vector. Subscripts v, r, s, and b represent the vehicle, rail, sleeper, and ballast bed, respectively. Definition and notation of the parameters used in our calculation script are included in Table 1. Detailed matrix setup and equation derivation can be found in [24].
Table 1Vehicle-track modelling parameters
Vehicle parameters | |||
Item | Notation | Value | Unit |
Mass of wheelset | Mw | 1400 | kg |
Mass of bogie | Mt | 3200 | kg |
Bogie roll moment of inertia | Jt | 3120 | kg·m2 |
Mass of vehicle | Mc | 52000 | kg |
Vehicle roll moment of inertia | Jc | 2.31e6 | kg·m2 |
Suspension parameters | |||
Item | Notation | Value | Unit |
Primary vertical stiffness | Kpz | 1.87 | MN/m |
Secondary vertical stiffness | Ksz | 1.72 | MN/m |
Primary vertical damping | Cpz | 500 | kN·s/m |
Secondary vertical damping | Csz | 196 | kN˖s/m |
Geometry parameters | |||
Item | Notation | Value | Unit |
Nominal wheel radius | R | 0.4575 | m |
wheel base | 2lc | 2.5 | m |
rolling stock axle spacing | 2lt | 18 | m |
Track parameters | |||
Item | Notation | Value | Unit |
Elastic modulus of rail | E | 2.059e11 | N/m2 |
Rail second moment of area | Iy | 3217e-5 | m4 |
Rail mass per unit length | mr | 60.64 | Kg/m |
Mass of half-sleeper | Ms | 170 | kg |
Stiffness of rail pads | Kp | 0.6e8 | N/m |
Damping of rail pads | Cp | 7.5e4 | N·s/m |
Sleeper spacing | ls | 0.6 | m |
Supporting length of half-sleeper | le | 1.175 | m |
Width of sleeper undersurface | lb | 0.277 | m |
Density of track bed | Roub | 1.9e3 | Kg/m3 |
Elastic modulus of track bed | Eb | 1.2e8 | MPa |
Damping of track bed | Cb | 6.0e4 | N·s/m |
Shear stiffness of track bed | Kw | 7.84e7 | N/m |
Shear damping of track bed | Cw | 8.0e4 | N·s/m |
Pressure diffuser angle | alpha | 35·pi/100 | Rad |
K30 modulus of foundation | Ef | 1.9e8 | MPa/m |
Damping of foundation | Cf | 1.0e5 | N·s/m |
Numbers of sleeper | N | 750 | – |
The energy harvesters can be connected to the rail in two ways, namely, serial connection and parallel connection. Fig. 2 illustrates the wheelset/track interaction model of both serial and parallel configurations. As we can see from the model diagram and configuration setups, for the serial configuration, the energy harvester is normally located between the rail and sleeper, or between the sleeper and ballast bed; therefore, the existence of the serial-connected device will change the track stiffness (such as the case reported by [26]). For the parallel configuration, the energy harvester is rigidly connected to the rail web; it is neither connected to the wheelset nor to the rail sleeper, so we treat the parallel configuration as an added mass to the rail, and calculate the resultant change of the rail mass and rail moment of inertia. The parallel configuration is used in the following analysis and tests.
3.2. Coupled distributed parameter models of cantilevered piezoelectric beam
Fig. 2 illustrates also the cantilevered piezoelectric beam model. The definition of parameters’ symbol is consistent with that of Erturk and Inman [34-36, 39]. They developed coupled distributed parameter models of piezoelectric beam of both unimorph and bimorph configurations. Lefeuvre et al. presented an electromechanical model of piezoelectric generators and specified the way of impedance matching for power optimization [14]. Based on these models and methods, we made a calculation for rail-borne cantilevered piezoelectric transducer.
It includes two sub-models in this paper: first a vehicle-track interaction model was built up (detailed description see Section 3.1). The vehicle-track model includes two subsystems, whereby the vehicle subsystem is modelled as a multi-body system with 10 DOFs (indicated in Fig. 2) moving on the track at a constant velocity; the track substructure, which consists of three layers, i.e., the rail, sleeper, and ballast, is assumed as an infinite Euler-Bernoulli beam supported on a discrete continuous elastic foundation. The wheel/rail interaction physics between these two subsystems is governed by the Hertzian theory of nonlinear elastic contact. A simple, fast integration method is exploited to obtain numerical results of such a complex system. After we get the amplitude and frequency response of rail-borne energy harvester, we then utilize the cantilevered piezoelectric beam model to simulate the voltage and power output of the piezoelectric device. The energy harvester consists of a piezoelectric PZT film clamped at one end with a proof mass mounted on the other end. The PZT film has a ground electrode embedded within it (coincident with the neutral plane of the beam) and two electrodes on the exterior surfaces of the cantilever beam. This configuration ensures that same voltage is induced on the exterior electrodes, even though the stress above and below the neutral layer is of opposite sign. The clamp is mounted to the rail and the device is analyzed in a vibrating reference frame of rail. The parameters of PZT are listed in Table 2 and the calculation results are shown in the Section 4.
3.3. Railroad irregularity and power spectrum density (PSD)
To evaluate the conditions of railway construction and guarantee appropriate track geometry, relevant departments in different countries (e.g., the Federal Railroad Administration of the USA, Deutsch Bahn of Germany) have conducted a large amount of field tests to regulate the level of track irregularity. A worldwide consensus has been reached to use power spectrum density (PSD) as a statistical evaluation method for regulating the level of track irregularity (track geometry). Thus, in this paper, the authors input the irregularity spectrum into the calculation model.
The vertical track irregularity could be measured in the spatial field. For new track lines, however, the track geometry cannot be obtained from measurements. Instead, the equivalent track irregularity spectrum is usually defined in accordance with the design standard. The problem is that the spatial spectrum cannot be directly integrated into the vehicle-track system. Therefore, we need to transform the spatial spectrum in the frequency and time domains. The methods and steps for this transform: 1) The original track spectrum in relation to spatial wavelength 1/Ω is transformed to that in relation to frequency (ΩV =2πf); 2) transform one-sided PSD to double-sided PSD; 3) obtain modulus value of PSD; 4) carry out IFFT (Inverse Fast Fourier Transform); 5) transform the PSD to distance domains according to specified vehicle speeds.
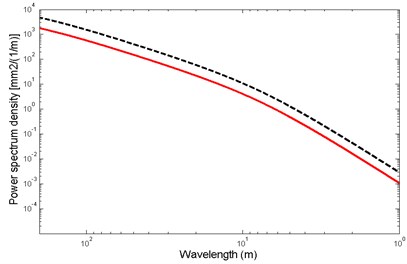
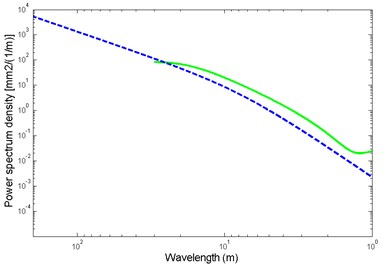
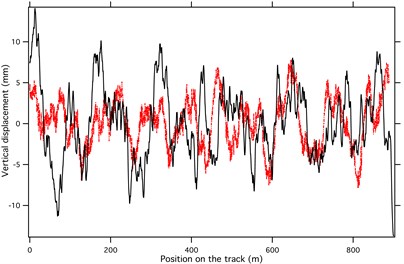
With a certain vehicle speed, we can transform the spectrum in the distance domain. Fig. 3(a) and 3(b) show the PSD of American, Chinese, and German track irregularity. The wavelength varies from 200 m to 1 m. We established the vehicle-track model, built up mass, damping, and stiffness matrix based on the vehicle-track parameters listed in Table 1. The fast explicit integration algorithm was used to calculate the displacement response of the track under the conditions that a vehicle passed through with a speed of 250 km/h. The track was 750 spans (450 m long), and the German low-disturbance PSD excitation was applied at 138.9 m. The PSD, in relation to the wavelength of the frequency domain, was transformed to that of the distance domain, as illustrated in Fig. 3(c).
Fig. 3a) Power spectrum density of track irregularity (Red ‒‒‒ German low-disturbance track irregularity; black ---- German high-disturbance track irregularity); b) Power Spectrum Density of track irregularity (blue ---- American 6th grade track vertical irregularity; green ‒‒‒ Chinese track spectrum; c) German low-disturbance and Chinese track spectrum in distance domain (black ‒‒‒ German low-disturbance track spectrum; red -•-•- Chinese track spectrum)
a)
b)
c)
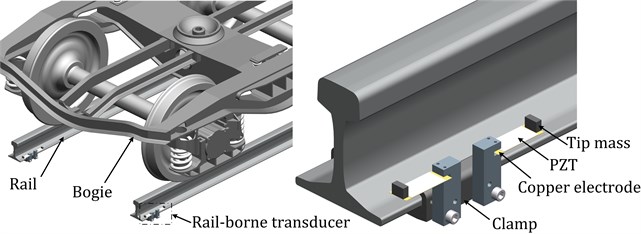
Fig. 4(left) Illustration of bogie-rail-harvester scales; (right) enlarged view of clamped cantilevered piezoelectric beam configuration
3.4. Geometric parameters of transducer
We designed three setups for the piezoelectric device. Clamped cantilevered beams with/without tip mass were tested. The harvester is connected via rail bottom clamp to the 60 kg/m rail. As illustrated in Fig. 4, the harvester is comprised of PZT film, copper substrate, Nylon grip block, rail bottom clamp, and screws. Rail bottom clamp is made of Aluminum with anodizing for corrosion protection, the profile of clamp is compatible with rail types of 50 kg/m, 60 kg/m, and 75 kg/m; thus it can serve as an interchangeable part for high-speed and heavy load applications. Compared with the bogie of vehicle, the scale of the piezoelectric transducer is quite small. The detailed parameters of PZT and harvester setups are listed in Table 2 and Table 3.
Table 2Material property of PZT ceramic
Property | Units | Symbol | PZT(P-33) |
Electromechanical coupling factor | Kp | 0.6 | |
K31 | 0.36 | ||
K33 | 0.70 | ||
K15 | 0.70 | ||
Kt | 0.47 | ||
Relative permittivity | ɛr | 1725 | |
Vacuum permittivity. | 10-12F/m | ɛ0 | 8.85 |
Loss tangent | tan δe | 0.02 | |
Compliance constant | 10-12m2/N | SE11 | 15 |
SD33 | 9 | ||
SD55 | 25 | ||
Piezo strain constant | 10-12m/v or C/N | d31 | 160 |
d33 | 390 | ||
d15 | 480 | ||
Mechanical quality factor | Qm | 75 | |
Frequency constant | Hz-m | Nd | 1950 |
N1 | 1470 | ||
N3 | 1880 | ||
N5 | 1130 | ||
Nt | 2250 | ||
Acoustic speed | m/s | Vd | 3000 |
V1 | 2940 | ||
V3 | 3760 | ||
V5 | 2260 | ||
Vt | 4500 | ||
Acoustic impedance | 106kg/m2-sec. | Z0 | 30 |
Curie temperature | ºC | Tc | 335 |
Table 3Testing setups
Device parameter | Setup 1 | Setup 2 | Setup 3 | Total dimension | Track |
Description | One end clamped, one end free, without tip mass | One end clamped, one end free, with tip mass | One end clamped, one end free, with tip mass | Length 200 mm Width 170 mm Height 80 mm Device dimension: Length 80 mm Width 30 mm Height 15 mm | UIC60, Section weight 60 kg/m, Rail height 172 mm Head width 72 mm Web thickness 16.5 mm Foot width 150 mm |
Thickness of piezoelectric layer (mm) | 0.3 | 0.3 | 0.3 | ||
Thickness of copper electrode (mm) | 0.3 | 0.3 | 0.3 | ||
Width of beam (mm) | 30 | 30 | 30 | ||
Weight of mass block (g) | 0 | 30 | 60 |
According to the model and methods of part 3, the strain-charge constitutive equations for PZT were utilized to determine electromechanical coupling relation. Dynamic Euler-Bernoulli equation with electrical coupling was used to handle the displacement of the PZT film in our calculation model for voltage calculation. We needed two steps for solving the model, first a stationary step solved the calculation domains at its initial status, and then the time-dependent iteration was involved by consideration of the electromechanical coupling. Calculated and tested results of voltage in relationship to the frequency sweeping, load impedance, and acceleration are discussed in the following parts.
3.5. Circuit design of piezoelectric harvester
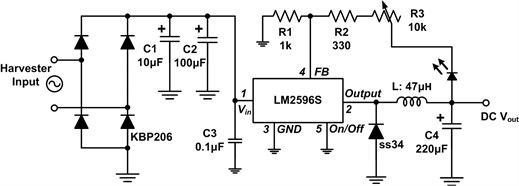
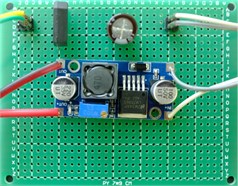
The schematic and prototype of the bridge rectifier and buck converter circuit are shown in Fig. 5. The KBP206 full bridge rectifier chip and a 10 µF electrolytic capacitor construct the first step circuit that is connected to the copper electrode and the PZT film. LM2596 operates at the switching frequency of 150 kHz. On/off pin is grounded, feedback pin is connected to 1 kOhm load impedance, and an adjustable 10 k resistance is used for the adjustment of output voltage. The range of input voltage varies from 4.75 V to 40 V with efficiency less than 73 % for the 3.3 VDC output. The inductor is changeable; the larger the value of inductor, the greater the input impedance and thus the lower the output current.
Fig. 5a) Schematic and b) PCB prototype of bridge rectifier / DC-DC buck converter circuit
a)
b)
4. Test verification and result discussions
4.1. Test setup
The test set-up was illustrated in Fig. 6 and Fig. 7. A 60 kg/m rail was put onto two rigid blocks with longitudinal spacing of 0.6 m to simulate the concrete sleeper. Rail pads with stiffness of 175 kN/mm were selected to control the displacement of the rail under 20 kN to 140 kN load. The loading arm, hanging under the gantry frame, was driven by the hydraulic system, and the wave profile of the excitation load was adjustable, could be displayed on the workstation, and was input into the control cabinet, which then controlled the hydraulic system for driving the loading arm.
Fig. 6Test setup of rail-borne piezoelectric energy transducer
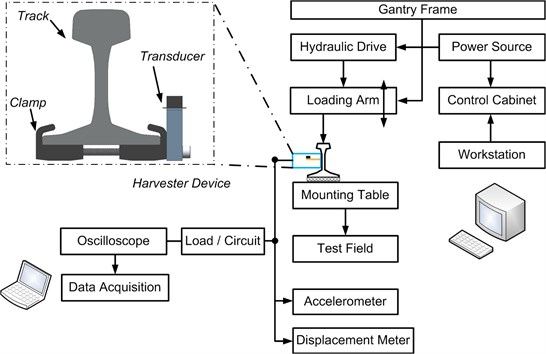
Fig. 7Test construction 1) piezoelectric device – a) with tip mass b) w/o tip mass; 2) oscilloscope; 3) loading arm; 4) displacement meter; 5) rail
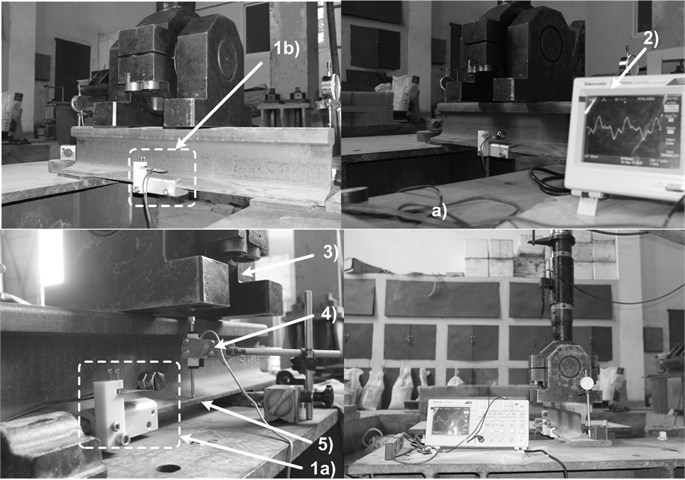
An oscilloscope (Tektronics TDS2004C) with a voltage probe of 10X attenuation was connected to the electrodes of the harvester. A displacement meter NS-WY02 and accelerometer LC0108(T) were used and connected to the data acquisition system imc CS-5008-1(imc Meßsysteme GmbH) to obtain displacement and acceleration values. The sampling data from the oscilloscope were recorded and transferred to a local computer for subsequent analysis. The device of rail-borne transducer was connected to the rail foot. The oscilloscope served as a data sampling device and was connected to the laptop with Labview Signal Express software. In this way, we can activate the auto trigger/record mode and realize continuous data sampling. The data were stored on the laptop’s hard drive.
4.2. Results discussion
We programmed a script in MATLAB for calculating the vibration response of a rail subjected to the travelling load of a vehicle. The frequency of the moving load excitation ranged from 3 Hz to 7 Hz, which depended on the velocity and the gauge of the rolling stocks. In agreement with Pasquale et al. [25], we focused on the study of low-frequency excitation exerted on the rail. Pasquale et al. utilized freight train vehicle with speed of 80 km/h, corresponding to the excitation of 3 Hz to 5 Hz. In our case, we modeled passenger car with vehicle speed of 250 km/h, corresponding to the excitation of 5 Hz to 7 Hz. The hydraulic system was designed for providing a maximum force of 140 kN in regard to the realistic axle load and rail vibration.
Different track spectrum has different application condition, different range for vehicle velocity, and is suitable for different track line. Normally, for common track line, American AAR 5th grade track spectrum (vehicle velocity below 144 km/h) and AAR 6th grade track spectrum (vehicle velocity below 176 km/h) are used widely; for high-speed track line, German low disturbance track spectrum (vehicle velocity above 250 km/h) and German high disturbance track spectrum (vehicle velocity below 250 km/h) are used worldwide. Fig. 8 shows the magnitude of rail vibration displacement with Chinese track spectrum as well as German low-disturbance track irregularity. The wavelength varies from 200 m to 1 m. Both results indicate a rail displacement ranging from 0.2 mm to 0.8 mm.
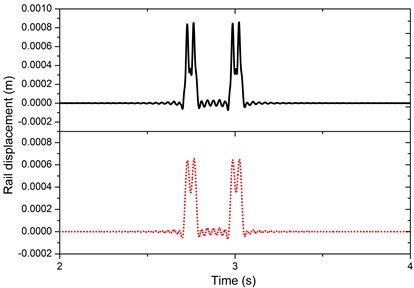
The American, German, and Chinese PSD track spectra described the static irregularities along the track, not the dynamic movements at a single point where the harvester was mounted. These dynamic movements will be dominated by the effects of passing wheel loads, as shown in Fig. 8. However, if we excluded track irregularity (take German low-disturbance track PSD for instant) as shown in Fig. 9 and Fig. 10, the wheelset/rail interaction force would become a smooth line without fluctuation; although the waveform of rail vibration displacement, velocity, and acceleration kept, the resultant amplitude would decrease significantly (rail displacement decreased by 25 %, rail velocity decreased by 40 %, and rail acceleration decreased by 67 %). For the purpose of precise modelling, we included German PSD track irregularity into the modelling.
Fig. 8Rail displacement under travelling loads of a vehicle (‒‒‒ Chinese track spectrum at vehicle speed of 176 km/h; -•-•- German low-disturbance track spectrum at vehicle speed of 250 km/h)
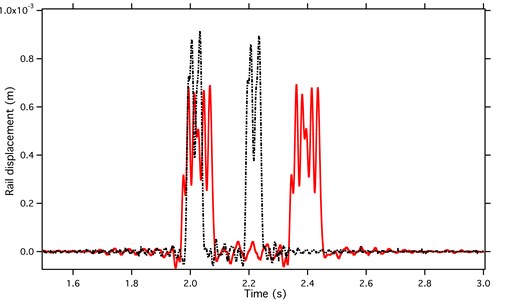
Fig. 9Rail displacement and wheelset/rail interaction force with and without PSD track irregularity (red - - - exclude track irregularity; black ‒‒‒ include track irregularity)
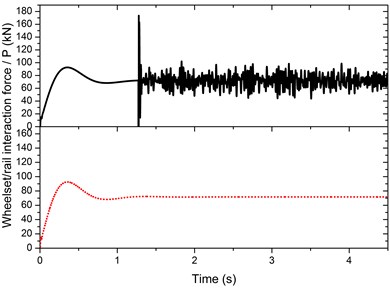
The research topic of this paper is not oriented towards one or another country. The application of the track-borne energy harvester is suitable to different countries under different track spectra. Because the American, German, and Chinese PSD track spectra described the static irregularities along the track, not the dynamic movements at a single point where the harvester was mounted. These dynamic movements will be dominated by the effects of passing wheel loads, as shown in Fig. 8. And no matter which PSD track spectrum was used, as shown in Fig. 3, the PSD of different spectrum in relation to wavelength are quite similar; and as shown in Fig. 8, the amplitude and frequency responses of the rail are also on the similar level. The German low disturbance track spectrum is superior to other spectrum in aspects of ride comfort and thus allows higher vehicle speed range. Therefore, we chose the German low-disturbance track spectrum, which is the worst case for the vibration-based energy harvesting.
As illustrated in Fig. 8, the magnitude of rail displacement ranges from 0.2 mm to 0.8 mm. The value and profile of the calculated results are consistent with the realistic in-situ measurements of Zhai et al. [24]. As discussed above, the mechanism of excitation of the wheelset/rail system is characterized by small-range displacement (less than 1.0 mm) and a heavy interaction force between the wheelset and rail. Therefore, in the test, we specified the rail displacement to be less than 1 mm.
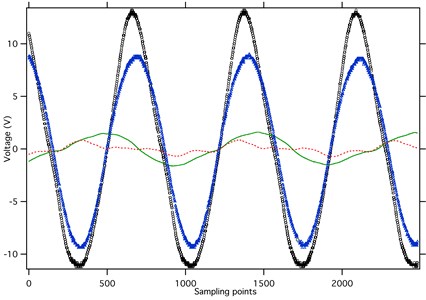
Fig. 11 records the voltage of the piezoelectric harvester at different excitation frequency. Added tip mass of cantilevered beam could significantly enlarged the tip displacement of the beam and thus increased the voltage output, so we tried two cases; 1) device with stepping tip mass (30 g, 60 g); 2) device without tip mass. Sampling interval ∆ is 0.0002 s, horizontal ordinate represents number of sampling points, and vertical ordinate represents the open circuit voltage. Band width of oscilloscope is 20 MHz. At frequency of 7 Hz, the harvester generated a peak-peak voltage of 24.4 V and a RMS voltage of 8.2 V. The rail acceleration was 5 g and the magnitude of rail displacement equaled to 0.2 mm for 7 Hz and 0.4 mm for 5 Hz.
Fig. 10Rail vibration velocity and acceleration with and without PSD track irregularity (red - - - exclude track irregularity; black ‒‒‒ include track irregularity)
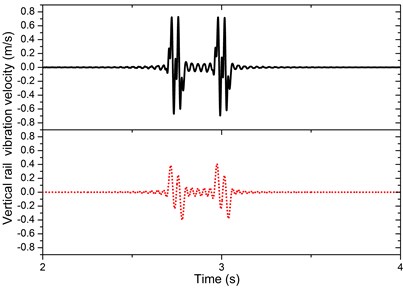
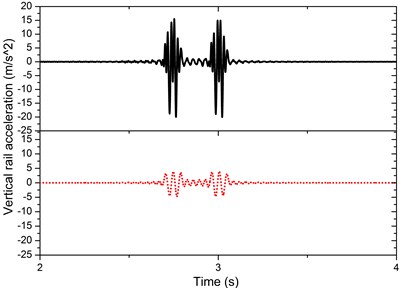
Fig. 11Open circuit voltage at 5-7 Hz excitation, 0.2-0.4 mm railway vibration (red - - - 5 Hz excitation, Vp-p= 1.58 V, Vrms= 0.39 V, w/o tip mass; green ‒‒‒ 5 Hz excitation, Vp-p= 3.24 V, Vrms= 1.0 V, tip mass 30 g; blue ∆ 7 Hz excitation, Vp-p= 18.4 V, Vrms= 6.4 V, tip mass 30 g ; black ○ 7 Hz excitation, Vp-p= 24.4 V, Vrms= 8.2 V, tip mass 60 g; rail acceleration: 5 g, open circuit, sampling interval: 0.0002 s)
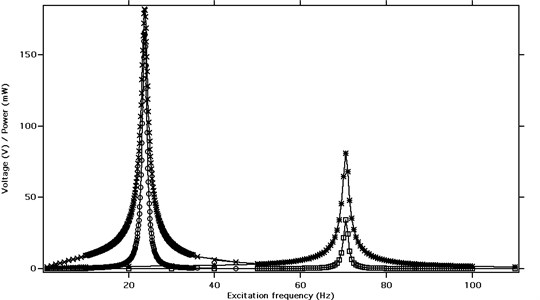
To find out the resonance frequency of the cantilevered piezoelectric beam, we exploited frequency sweeping calculation based on the electromechanical model. The electrical power output and voltage of PZT are illustrated in Fig. 12. The weight of tip mass had an influence on resonance frequency, which shifted the frequency towards lower range with increased weight. The PZT material property, beam’s area moment of inertia, film thickness, together with the excitation magnitude of the wheelsets/rail will also determine the output voltage. As it approached the resonance frequency, the minor change of excitation frequency could lead to significant variation of output voltage across PZT. As recorded in Fig. 12, at 23 Hz frequency, the electrical power output and voltage are maximized with voltage value above 150 V. The calculated results at resonance are ideal case. Due to deflection limitation of PZT films, in real situation, we cannot get such a high voltage output. In fact, the maximum allowed deflection of PZT film at the tip end is 7 mm.
Fig. 12Voltage and power output in relation to frequency sweeping (‒×‒ Voltage with tip mass 60 g; ‒ο‒ Electrical power output with tip mass 60 g; ‒ӿ‒ Voltage without tip mass; ‒□‒ Electrical power output without tip mass; acceleration: 1g, load: 100 kΩ)
It is known that the internal impedance of PZT film is quite large and thus the optimal power output can be achieved only when load impedance is well matched. Fig. 13 shows the voltage and power output in relationship to the load impedance at 7 Hz. In case the load resistance was very low, a great voltage drop happened across PZT film and thus output voltage was very limited (less than 2 V); on the other hand, when the load impedance approached infinite, the situation was equivalent to open circuit, and therefore a maximum voltage could be generated. When the load impedance equaled to the internal impedance of PZT film, an optimal power output was generated as expected. Due to the low excitation frequency, the maximum electrical power output was 5 mW. Fig. 14 indicates the output power in relation to the load impedance. The solid line represents the calculated results and the plus marker stands for testing results. The tested power reached 4.88 mW with voltage of 22.1 V at a load impedance of 100 kOhm. The calculation, in general, matched the test results.
As calculated in Fig. 15, an open circuit voltage with peak value of 32 V can be achieved at frequency of 7 Hz. That is beneficial for low-frequency range energy harvesting of wheelset/rail system. As discussed in part 2, mechanism of wheelset/rail excitation is characterized by small magnitude of displacement (less than 1 mm) and heavy interaction force of wheelset and rail; that means the proposed piezoelectric transducer fits well the application in wheelset/rail system. However, the power output is quite low at low frequency; and thus limits its application for powering high-power sensors.
A bridge rectifier and DC-DC buck converter circuit was designed. The features of this circuits: 1) AC-DC voltage conversion; 3) Voltage step down and stabilization. The schematic and prototype of the circuit is shown in Fig. 5. As recorded in Fig. 16, the ripple of voltage is acceptable since the variation is quite small. The circuit, which operated at switch-mode, provided a 3.3 VDC output in case that the PZT film with tip mass was mounted onto the lab vibration rig under 23 Hz/5 g excitation. The rail-borne transducer at 7 Hz excitation cannot provide enough power to enable the circuit, which needs further investigation and improvement. The proposed rail-borne piezoelectric energy harvester is compared with the published harvesters as shown in Table 4.
Fig. 13Voltage and power output in relation to load impedance (‒ӿ‒ Voltage; ‒ο‒ Electrical power output; rail acceleration: 5 g, rail displacement: 0.2-0.4 mm, excitation frequency: 7 Hz)
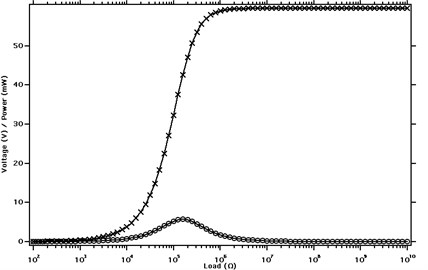
Fig. 14Power output in relation to load impedance (‒‒‒ Simulation results; + Testing results; rail acceleration: 5 g, rail displacement: 0.2-0.4 mm; excitation frequency: 7 Hz)
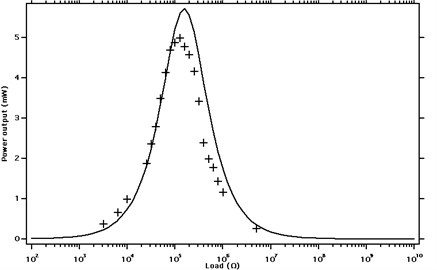
Fig. 15Voltage and power output in relation to excitation acceleration (‒×‒ Voltage; ‒ο‒ Electrical power output; rail displacement: 0.2-0.4 mm, excitation frequency: 7 Hz, load: 100 kΩ)
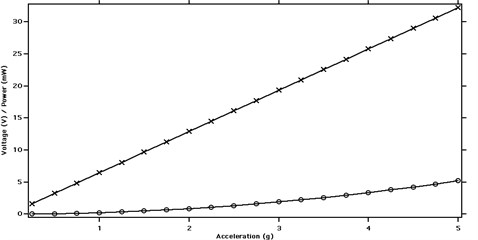
Fig. 16Voltage output of the DC-DC step down converter circuit (- - - Rectifier voltage; ‒‒‒ Buck converter output; sampling interval: 0.00005 s)
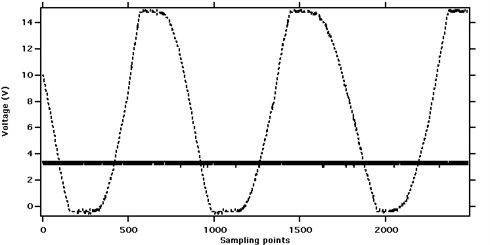
Table 4Comparison with published harvester for railroad application
Item | Harvester type | Volume [mm3] | Rail/track displacement [mm] | Input/rail acceleration [m/s2] | Wheel/rail contact force [kN] | Frequency range [Hz] | Voltage [V] | Load [Ω] | Power [mW] |
Nelson et al. [20] | Voice-coil inductive / cantilevered beam | – | – | – | – | 10 | 1.6 () | 7.5 | 0.146 |
Piezoelectric | – | – | – | 75 | – | 3 () | 387 k | 0.053 | |
Wang et al. [21] | Electro- magnetic | – | 6.35/12.7 | – | – | 0.5/1 | 5 () | 6.2/12/24 | 1400 |
Pourghodrat et al. [22] | Hydraulic / electromechanical | – | 2.8 | – | 64 | 0.37 | 100 () | 131 | 1900 |
Pasquale et al. [25] | Magnetic suspension | 150×125×95 | 4.5~5 | 50 g | 175 | 3~5 | 2.5 | – | 100 |
Yuan et al. [26] | Piezoelectric drum | Ø40×0.4 | 0.6~1.3 | – | – | 2~4 | 15.6 () | 105~108 | 1.33 |
The authors | Piezoelectric cantilevered | 200×170×80 | 0.2~0.4 | – | 35~70 | 5~7 | 22.1 () | 100 k | 4.88 |
5. Conclusions
This paper first discussed the source and type of wheelset/rail excitation, which motivated the authors to investigate the possibility of a rail-borne energy harvester for energy harvesting of wheelset/rail system. Piezoelectric energy transducer was selected for its adaptability to the low-magnitude (less than 1 mm) rail vibration subjected to a moving load of vehicle. German track PSD was applied on the calculation model of vehicle-track system at speed of 250 km/h. An electromechanical coupling calculation for cantilevered piezoelectric beam model was carried out. The voltage and electrical power output in relation to load impedance, acceleration, and frequency sweeping were visualized. In addition, a step-down converter circuit was designed. A rail-borne piezoelectric energy harvester with total dimension of 200 mm×170 mm×80 mm was proposed and fabricated. In order to simulate the realistic wheelset/rail interaction and contact force, a hydraulic driven system with loading arm was exploited, which enabled the magnitude of excitation force to 140 kN. The testing results indicated an energy harvesting at frequency of 5 Hz to 7 Hz. 4.9 mW and 22.1 V were achieved with a load impedance of 100 kOhm at rail vibration displacement of 0.2 mm to 0.4 mm, rail acceleration of 5 g with excitation frequency of 7 Hz.
The proposed rail-borne piezoelectric transducer, which fits well the low-frequency and small railway vibration, will pave the way for the future research on energy harvesting of wheelset/track system.
References
-
Suzuki Y. Development of a MEMS energy harvester with high-performance polymer electrets. Proceedings of PowerMEMS’10, 2010, p. 47-52.
-
Mitcheson P. D., Yeatman E. M., Rao G. K., Holmes A. S., Green T. C. Energy harvesting from human and machine motion for wireless electronic devices. Proceedings of the IEEE, Vol. 96, Issue 9, 2008, p. 1457-1486.
-
Jeon Y. B., Sood R., Jeong J.-H., Kim S.-G. MEMS power generator with transverse mode thin film PZT. Sensors and Actuators A, Vol.122, 2005, pp.16-22.
-
Khaligh A., Zeng P., Zheng C. Kinetic energy harvesting using piezoelectric and electromagnetic technologies – state of the art. IEEE Transactions on Industrial Electronics, Vol. 57, Issue 3, 2010, p. 850-860.
-
Reinaud M., Karakaya K., Sterken T., Fiorini P., Hoof C. V., Puers R. Fabrication, modelling and characterization of MEMS piezoelectric vibration harvesters. Sensors and Actuators A, Vols. 145-146, 2007, p. 380-386.
-
Liu J. Q., Fang H. B., Xu Z. Y., Mao X. H., Shen X. C., Chen D., Liao H., Cai B. C. A MEMs-based piezoelectric power generator array for vibration energy harvesting. Microelectronics Journal, Vol. 39, 2008, p. 802-806.
-
Fang H. B., Liu J. Q., Xu Z. Y., Dong L., Wang L., Chen D., Cai B. C., Liu Y. Fabrication and performance of MEMs-based piezoelectric power generator for vibration energy harvesting. Microelectronics Journal, Vol. 37, 2006, p. 1280-1284.
-
Ottman G. K., Hofmann H. F., Bhatt A. C., Lesieutre G. A. Adaptive Piezoelectric energy harvesting circuit for wireless remote power supply. IEEE Transactions on Power Electronics, Vol. 17, Issue 5, 2002, p. 669-676.
-
Marzencki M., Ammar Y., Basrour S. Integrated power harvesting system including a MEMs generator and a power management circuit. Sensors and Actuators A, Vol. 145, Issue 146, 2008, p. 363-370.
-
Tabesh A., Frechette L. G. A low-power stand-alone adaptive circuit for harvesting energy from a piezoelectric micropower generator. IEEE Transactions on Industrial Electronics, Vol. 57, 2010.
-
Ramadass Y. K., Chandrakasan A. P. An efficient piezoelectric energy harvesting interface circuit using a bias-flip rectifier and shared inductor. IEEE Journal of Solid-State Circuits, Vol. 45, Issue 1, 2010.
-
Szarka G. D., Stark B. H., Burrow S. G. Review of power conditioning for kinetic energy harvesting systems. IEEE Transactions on Power Electronics, Vol. 27, Issue 2, 2012.
-
Lesieutre G. A., Ottman G. K., Hofmann H. F. Damping as a result of piezoelectric energy harvesting. Journal of Sound and Vibration, Vol. 269, 2004, p. 991-1001.
-
Lefeuvre E., Audigier D., Richard C., Guyomar D. Buck-boost converter for sensorless power optimization of piezoelectric energy harvester. IEEE Transactions on Power Electronics, Vol. 22, Issue 5, 2007, p. 2018-2025.
-
Zuo L., Tang X. D. Large-scale vibration energy harvesting. Journal of Intelligent Material Systems and Structures, 2013, p. 1405-1430.
-
Zuo L., Zhang P. Energy harvesting, ride comfort, and road handling of regenerative vehicle suspensions. ASME Journal of Vibration and Acoustic, Vol. 135, 2013.
-
Li Z., Zuo L. Electromagnetic energy-harvesting shock absorbers: design, modelling and road tests. IEEE Transaction on Vehicular Technology, Vol. 62, 2013.
-
Xie J. J., Zuo L. Dynamics and control of ocean wave energy converters. International Journal of Dynamics and Control, Vol. 1, 2013, p. 262-276.
-
Tang X., Zuo L. Simulation and experiment validation of simultaneous vibration control and energy harvesting from buildings via tuned mass dampers. Proceeding of America control conference, San Francisco, 2011.
-
Nelson C. A., Platt S. R., Albrecht D., Kamarajugadda V., Fateh M. Power harvesting for railroad track health monitoring using piezoelectric and inductive devices. Proceedings of SPIE Active and Passive Smart Structures and Integrated Systems, 2008.
-
Wang J. J., Penamalli G. P., Zuo L. Electromagnetic energy harvesting from train induced railway track vibrations. Proceedings of IEEE/ASME the International Conference on Mechatronics and Embedded Systems and Applications (MESA), 2012, p. 29-34.
-
Pourghodrat A., Nelson C. A., Hansen S. E., Kamarajugadda V., Platt S. P. Power harvesting systems design for railroad safety. Proceedings of IMechE Part F: Journal of Rail and Rapid Transit, Vol. 228, 2014, p. 504-521.
-
Pourghodrat A. Energy Harvesting Systems Design for Railroad Safety. M.Sc. Thesis, University of Nebraska-Lincoln, 2011.
-
Zhai W. M. Vehicle-Track Coupled Dynamics. Fourth Edition, Science Press, Beijing, China, 2015.
-
Pasquale G. D., Soma A., Zampieri N. Design, simulation, and testing of energy harvesters with magnetic suspensions for the generation of electricity from freight train vibrations. ASME Journal of Computational and Nonlinear Dynamics, Vol. 7, 2012.
-
Yuan T. C., Yang J., Song R. G., Liu X. W. Vibration energy harvesting system for railroad safety based on running vehicles. Smart Materials and Structures, Vol. 23, 2014.
-
Zhai W. M., Wang K. Y., Cai C. B. Fundamentals of vehicle-track coupled dynamics. Vehicle Systems Dynamics, Vol. 47, 2009, p. 1349-1376.
-
Halvorsen E. Energy harvesters driven by broadband random vibrations. Journal of Microelectromechanical Systems, Vol. 17, Issue 5, 2008.
-
Nakano K., Cartmell M. P., Hu H. G., Zheng R. C. Feasibility of energy harvesting using stochastic resonance caused by axial periodic force. Journal of Mechanical Engineering, Vol. 60, 2014, p. 314-320.
-
Gatti G., Brennan M. J., Tehrani M. G., Thompson D. J. Harvesting energy from the vibration of a passing train using a single-degree-of-freedom oscillator. Mechanical Systems and Signal processing, Vols. 66-67, 2016, p. 785-792.
-
Thompson D. J., Hemsworth B., Vincent N. Experiment validation of the twins prediction program for rolling noise, part 1: description of the model and method. Journal of Sound and Vibration, Vol. 193, 1996, p. 123-135.
-
Thompson D. J., Fodiman P., Mahe H. Experiment validation of the twins prediction program for rolling noise, part 2: results. Journal of Sound and Vibration, Vol. 193, 1996, p. 137-147.
-
IEEE Standard on Piezoelectricity. ANSI/IEEE Standard, Vol. 176, 1987.
-
Erturk A., Inman D. J. On mechanical modelling of cantilevered piezoelectric vibration energy harvesters. Journal of Intelligent Material Systems and Structures, Vol. 19, 2008, p. 1311-1325.
-
Erturk A., Inman D. J. A distributed parameter electromechanical model for cantilevered piezoelectric energy harvesters. ASME Journal of Vibration and Acoustics, Vol. 130, 2008.
-
Erturk A., Tarazaga P. A., Farmer J. R., Inman D. J. Effect of strain nodes and electrode configuration on piezoelectric energy harvesting from cantilevered beams. ASME Journal of Vibration and Acoustics, Vol. 131, 2009.
-
Garg V. K., Dukkipati R. V. Dynamics of Railway Vehicle Systems. Academic Press, Ontario, 1984.
-
Stephen N. G. On energy harvesting from ambient vibration. Journal of Sound and Vibration, Vol. 293, 2006, p. 409-425.
-
Junior C., Erturk A., Inman D. J. An electromechanical finite element model for piezoelectric energy harvester plates. Journal of Sound and Vibration, Vol. 327, 2009, p. 9-25.
-
Priya S., Inman D. Energy Harvesting Technology. Springer Press, New York, 2009.
-
Holland R., Eer Nisse E. P. Design of Resonant Piezoelectric Devices. Research Monograph No. 56, The M.I.T. Press, 1969.
-
Ikeda T. Fundamentals of Piezoelectricity. Oxford University Press, 1990.
-
Mezheritsky A. V. Elastic, dielectric, and piezoelectric losses in piezoceramics: how it works all together. IEEE Transactions on Ultrasonics, Ferroelectrics, and Frequency Control, Vol. 51, Issue 6, 2004.
-
Uchino K., Hirose S. Loss mechanisms in piezoelectrics: how to measure different losses separately. IEEE Transactions on Ultrasonics, Ferroelectrics, and Frequency Control, Vol. 48, Issue 1, 2001, p. 307-321.
-
Lee P. C. Y., Liu N. H., Ballato A. Thickness vibrations of a piezoelectric plate with dissipation. IEEE Transactions on Ultrasonics, Ferroelectrics, and Frequency Control, Vol. 51, Issue 1, 2004.
-
Balanis C. A. Electrical Properties of Matter. Advanced Engineering Electromagnetics. Chapter 2, John Wiley and Sons, 1989.
-
Standards on piezoelectric crystals. Proceedings of the I. R. E., Vol. 37, Issue 12, 1949, p. 1378-1395.
-
Auld B. A. Acoustic Fields and Waves in Solids. Krieger Publishing, 1990.
-
Bechmann R. Elastic and piezoelectric constants of Alpha-Quartz. Physical Review B, Vol. 110, Issue 5, 1958, p. 1060-1061.
-
Stoykov N. S., Kuiken T. A., Lowery M. M., Taflove A. Finite-element time-domain algorithms for modelling linear Debye and Lorentz dielectric dispersions at low frequency. IEEE Transactions on Biomedical Engineering, Vol. 50, Issue 9, 2003, p. 1100-1107.
-
Park J.-K., Moon W.-K. Constitutive relations for piezoelectric benders under various boundary conditions. Sensors and Actuators A, Vol. 117, 2005, p. 159-167.
-
Erturk A., Renno J. M., Inman D. J. Modelling of piezoelectric energy harvesting from an L-shaped beam-mass structure with an application to UAVs. Journal of Intelligent Material Systems and Structures, Vol. 20, Issue 5, 2009, p. 529-544.
Cited by
About this article
This work was supported by the National Natural Science Foundation under Grant Reference No. U1234201. The authors would like to express gratitude to Prof. Lingkan Yao from Southwest Jiaotong University for helpful discussion. The authors would also like to thank Linda from GE Healthcare for language modification.
M. Y. Gao led the entire manuscript effort and came up with the research question. M. Y. Gao and P. Wang designed the study approach. M. Y. Gao and Y. Cao established the calculation model and conducted numerical analysis. Y. Cao and R. Chen conducted the track spectrum analysis. M. Y. Gao and C. Liu designed and conducted the experimental test. M. Y. Gao wrote the paper.
