Abstract
In this work, a new finite element (FE) model calibration method of concrete dams based on strong-motion records and multivariate relevant vector machines (MRVM) is proposed. The modal features of a dam are extracted using second order blind identification (SOBI) based method at first. For some selected combinations of uncertain parameters of the FE model using the Latin hypercube design, the corresponding structural modal features are calculated using the finite element method (FEM). With these data, a procedure to calibrate the uncertain parameters of a dam’s dynamic FE model is developed. By taking the uncertain parameters as inputs and the calculated structural modal features using FEM as outputs, the MRVM model is trained to record the complex relationship between them. Then, the genetic algorithm (GA) is adopted to solve the optimization problem corresponding to the dynamic FE model calibration problem, and the trained MRVM model, instead of FEM, is used to obtain the modal parameters of a dam for different feasible solutions during the optimization search process to improve the computational efficiency. Using the simulated seismic response records of a numerical example the accuracy, robustness and computation efficiency of the proposed dynamic FE model calibration method is verified. The analysis result using the strong-motion records of a realistic concrete dam indicates that the proposed dynamic FE model calibration method has good performance.
1. Introduction
For dams and other hydraulic structures located in high seismic intensity areas, it is good to use some numerical simulation method, such as dynamic finite element analysis (FEA), to solve the structural analysis problem under earthquake excitation. According to the dynamic FEA, the earthquake resistant capacity of a dam can be evaluated and some measures can be taken to reduce the possible losses caused by large earthquakes [1]. However, some differences may exist between the finite element (FE) model and a realistic structure because uncertainties in the material and boundary conditions are inevitable. Then, FE model calibration can be implemented using the measured vibration response of a structure to provide a more accurate numerical model for the dynamic FEA [2, 3]. The traditional FE model calibration method of a dam is generally based on prototype dynamic testing using some artificial excitation [4], which not only is costly but also may cause damage to the structure. The strong-motion records, measured by some accelerographs installed on a dam during earthquakes provides us a possible way to perform dynamic FE model calibration of a dam cheaply and conveniently.
Recently, the research on dynamic FE model calibration of a structure has attracted much attention [5, 6]. For example, Zhang et al. [7] studied the structure system identification and the dynamic FE model updating method of a suspension bridge based on an ambient vibration test; Ntotsios et al. [8] used the optimization method to identify the modal parameters of two bridges in Greece, and then the FE model of the bridges was corrected; Proulx et al. [9], Alves et al. [10] and Sevim et al. [11] studied the modal identification and the dynamic FE model updating problem of Emosson dam, Pacoima dam and Berke dam, respectively; Feng et al. [12] developed a dynamic elastic modulus back analysis method of concrete gravity dams, based on the simulated annealing-simplex shape algorithm. Because dams and other hydraulic structures are giant and complex structures, computational efficiency must be considered when dynamic FE model calibration is implemented. One possible way to improve computational efficiency is to use some machine learning methods in the process of model calibration. For example, Karimi et al. [13] used the artificial neural network (ANN) and Deng et al. [14] used the response surface model instead of the FEM to calculate the modal parameters of a structure during the optimizing search process. Response surfaces, ANN and some other traditional machine learning methods are based on the empirical risk minimization (ERM) [15], which requires a large amount of training samples and may cause an over-fitting problem. Recently, the machine learning method known as relevant vector machines (RVM), which is in the Bayesian regression framework, attracted many attentions in machine learning arena [16-18]. In this work, the multivariate version of RVM model, i.e. multivariate relevant vector machines (MRVM) [19, 20], is introduced to improve the computational efficiency of the dynamic model calibration process of a dam. The attraction of the MRVM is that it has good generalization performance while achieving sparsity in the representation with no parameters to set and without being limited to Mercer kernels [21]. Moreover, it is a multiple-output model, which can reduce the time for the training process.
In this paper, a dynamic FE model calibration method of concrete dams based on strong-motion records and MRVM is proposed. After review some basic principles of the dynamic FE model calibration of concrete dams, the MRVM model is brought into the process of FE model calibration to improve the calculation efficiency. Then, using a numerical and practical engineering as an example, the effectiveness of the proposed dynamic FE model calibration method of concrete dams in this paper is verified, and some conclusions are made based on the analysis results.
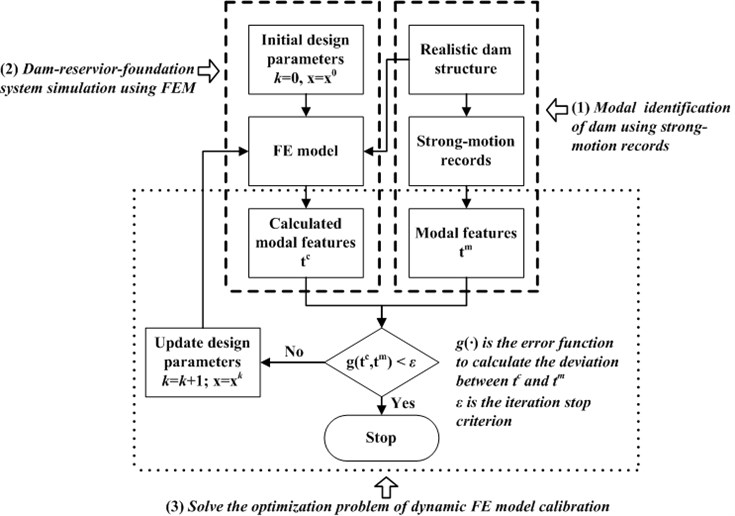
Fig. 1The framework of dynamic FE model calibration of concrete dams using strong-motion records
2. Basic principles of traditional dynamic FE model calibration method
The dam-reservoir-foundation system under the excitation of earthquake is very complicated, which has much difference with other civil structures, such as bridges and tall buildings. The conceptual framework of the dynamic FE model calibration of concrete dams using strong-motion records is shown in Fig. 1. This framework includes: (1) modal identification using strong-motion records, (2) dam-reservoir-foundation system simulation using FEM and (3) optimization process of uncertain design parameters. In this section, some basic principles of the three problems above will be discussed briefly.
2.1. Extract practical modal features using strong-motion records
Using strong-motion records to identify the modal parameters of concrete dams is indeed the operation modal analysis (OMA)[22] problem of structure. Recently, research on this problem has attracted much attention[23-25]. In this paper, the modal identification procedure based on SOBI, which shows high identification accuracy and computation efficiency, is adopted. Hereafter some basic principles of this method are provided.
The SOBI-based modal identification method starts from forming a vector Yk∈R2pl×1, which consists of the measured seismic response of l channels yk∈Rl×1,and its time-lagged data is first constructed:
where, ˜yk=[yky90k], yk is the measured acceleration of l channels, y90k is the Hilbert transformation of yk. The Hilbert transformation is used to identify imaginary parts of modal shape vectors. If l≥n, then parameter p= 1 and no time-lagged data are needed; otherwise, the time delay should satisfy 2p×l>n.
The Hankel matrix H(τi)∈R2pl×2pl can then be defined as:
If l≥n, p=1, and then the Hankel matrix becomes the covariance function matrix Ryy(τi)=E[˜yk˜yTk+τi]. For a structure under white noise-like support excitation, the covariance function matrix of the measured acceleration Ryy(τj) is only related to the initial state and system parameters (modal parameters) of the structure, which is similar to that of the structural free vibration response and the impulse response.
By further deduction, the Hankel matrix H(τi) can be expressed as:
where Σ(Ts)=exp{ΛTs}, Λ=diag(λ1,…,λn), and λ1, …, λn are the eigenvalues of the system matrix Ac; R¨q¨q(τi)=E[¨qk¨qTk+τi]=[R¨qR¨qR(τi)00R¨qI¨qI(τi)];Θ=[CaΦR-CaΦICaΦICaΦR], ФR and ФI are the real parts and imaginary parts of complex mode shapes, respectively; Ca=Cl×n is the output selection matrix of acceleration.
Then, the joint approximate diagonalization (JAD) technique can be used to realize the approximate diagonalization of the Hankel matrix for small damping structures. For a group of Hankel matrices with different time-delays H(τ1),H(τ2), ..., H(τT), the generalized diagonalization matrix can be obtained by implementing joint approximate diagonalization (JAD) on the matrices; the corresponding optimization problem is as follows:
The whitening matrix W is obtained using the PCA method.
After solving the optimization problem shown above, the generalized diagonalization matrix U can be obtained. Then, the mixing matrix ˜Θ, the separation matrix ˜Θ+ and the modal response ¨q(t) can be expressed as:
The submatrix Θ of ˜Θ contains the real parts ΨR=CaΦR and the imaginary parts ΨI=CaΦI of the observed complex mode shape. Using the identified modal response ¨qR(t) and the modal identification method of the single-degree-of-freedom (SDOF) system, the natural frequencies fi, (i=1, …, n), and damping ratios ξi, (i=1, …, n), can be obtained. Some details of the above modal identification method can be found in our previous work [26].
In the above modal identification process, the system order n is an important parameter. However, it’s usually unknown previously. Moreover, practical earthquake excitation may have some dominant frequencies and may not be like white noise support excitation at all. In our following study, the stabilization diagram method is used to determine system order and remove spurious modes.
2.2. Dam-reservoir-foundation system simulation using FEM
In this work, the dam-reservoir-foundation system is assumed to be linear elastic. For this system, how to deal with the fluid-solid interaction between reservoir water and dam-foundation is an important problem. In a fluid-solid interaction problem [27], the equations of motion can be expressed as:
where, u(t), ¨u(t) and p(t) are the relative displacement, acceleration and pressure vectors; M, K are the mass and stiffness matrices of the system, respectively; ρ is the mass density of water.
The pressure vector p(t) can be calculated from:
The matrix S and H are only related to interpolation function and the mass density ρ of water, and the expression of them can be found in referenced work [27].
In the present case, the fluid is assumed to be incompressible and inviscid. Only infinitesimal displacements are considered during the fluid vibration, so that the Eulerian and material coordinates coincide.
Substitute Eq. (7) into Eq. (6), we can obtain that:
Or in an impact expression as follows:
This equation now allows the modes and frequencies of the solid structure immersed in the fluid to be obtained by conventional eigenvalue methods. In this work the Lanczos method [28] is adopted which has the advantage of high accuracy and low computation cost.
In order to simulate the dam-foundation interaction, usually, three types of foundation, i.e. massless foundation, massed foundation with the viscous boundary, and massed foundation with the infinite elements can be used. In this paper, since our main purpose is to discuss the model calibration method, the massless foundation is adopted, just for simplicity.
2.3. Solve the dynamic FE model calibration as an optimization problem
The structural dynamic FE model calibration process is essentially an optimization problem. The objective of the optimization problem is to minimize the deviation between the identified modal features of a realistic structure and that calculated by using FEM. In general, damping ratios are not taken into account because usually the identification accuracy of it is low and it is very difficult to be simulated in an appropriate way. The optimization problem can be expressed as a minimization problem to find optimal design parameter xopt[29]:
st:x∈Dx,
where x∈RP is the uncertain design parameters of the structural material, geometry or boundary conditions and should be within a certain range of Dx; fmi and Φmi are the identified, undamped natural frequencies and mode shapes of the structure, respectively; fci and Φci are the natural frequencies and mode shapes calculated using FEM, respectively; γi and β are weighting coefficients; modal assurance criterion (MAC) is defined by:
Parameters n1 and n2 are the selected number of natural frequencies and modal shapes for the FE model calibration purpose. In theory, the more modes are used, the higher accuracy model calibration results can be obtained, but the more computational time needed. Moreover, it should be noted that not all modes of the structure can be excited and identified at the same time under earthquakes and some other ambient excitation. Therefore, the natural frequencies and mode shapes shown in Eq. (10) are those modes which can be identified.
To solve the optimization problem shown in Eq. (10), some optimization algorithms [30], such as the simulated annealing (SA) algorithm, genetic algorithms (GA), ant colony algorithm and particle swarm optimization, etc., can be adopted to search for the optimal solution. The GA is adopted in this study for its wide application and good performance in some optimization problem of engineering structures.
In the process of optimization search, these optimization algorithms often require a large amount of iteration steps, and for each iteration step, multiple FEM calculations should be carried out. Because concrete dams are large and complex structures, the cost of optimizing searching often cannot be accepted. A solution to this problem is to set some combinations of uncertain design parameters of a structure and then to use the FEM to calculate the modal parameters; then, the relationship between the uncertain design parameters of the structure and the modal parameters is established by these data using some machine learning method. In this section, the MRVM model is introduced to improve the computational efficiency of the dynamic model calibration process of a dam.
3. The dynamic FE model calibration method based on MRVM
3.1. MRVM model and its training
In the MRVM model, training set consists of input vectors x∈RP, and corresponding targets t∈RM. For the dynamic FE model calibration problem, the input vector refers to uncertain design parameters and the targets refers to modal features calculated using FEM, i.e. fci, (i=1, 2,…, n1) and Φci, (i=1, 2,…, n2). There is a complex relationship between the input vector x and the targets t. In the feature space, the nonlinear relationship can be expressed by:
where the weight matrix W=[wT1;…;wTM]∈RM×(N+1), wr∈RN+1 is the weight of the rth component of the output vector t; N is the number of training sample; ε∈RM is the Gaussian noise vector with zero mean and diagonal covariance matrix S=diag(σ21,σ22,…,σ2M); the basis function matrix ϕ(x)∈RN+1 is a vector of basis functions of the form:
in which K(∙) is the kernel function, which is not necessary to satisfy Merler’s condition for the MRVM model. Some commonly used kernel functions are the polynomial kernel, radial kernel and sigmoid kernel. In this work, the radial kernel is adopted and the kernel parameters are optimized using GA and cross-validation method [31].
To obtain the proper weight matrix W, traditional machine learning methods try to minimize the errors between the actual target tk and the predicted value from Wϕ(xk), which may result in over-fitting the problem. For the MRVM mode, this goal can be realized by solving the following optimization problem:
where N(⋅) is the Gaussian distribution function.
In order to avoid over-fitting the problem, a Gaussian distribution for the weights is assumed. Let matrix B=diag(α-21,α-22,…,α-2N+1) and each element αj be a hyperparameter that determines the relevance of the associated basis function and independently controls the (inverse) variance of each weight. The conditioned distribution function of the weights can then be expressed by:
where wrj is an element of weight matrix W; wr is the weight for the rth component of the output vector tr.
A likelihood distribution of the weight matrix W can be written as:
Exploiting the diagonal form of matrix S, the likelihood can be written as a product of separate Gaussians of the weight vectors of each output dimension:
The design matrix Ψ=[ϕ(x1),ϕ(x2),…,ϕ(xN)]T; the vector τr contains all the measured samples of the rth component of output vector t:
The posterior on W can be expressed as the product of separate Gaussians for the weight vectors of each output dimension:
where μr=σ-2rΣrΨTτr and Σr=(σ-2rΨTΨ+A)-1 are the mean vector and covariance matrix of wr, respectively.
Exploiting the diagonal form of S and A once more, we marginalize the data likelihood over the weights:
=∏Mr=1|Hr|-12exp(-12τTrH-1rτr,),
where Hr=σ2rI+ΨA-1ΦT.
The negative log of an equation is written as a function of the hyperparameters in the following form:
The optimal hyperparameters and the noise parameters are then used to obtain the optimal weight matrix. Based on Thayananthan’s derivation, the optimized parameters can be expressed as follows:
μoptr=(σoptr)-2ΣoptrΨTτr,Wopt=[μopt1,…,μoptM]T.
For new input vector x*, the output can be predicted by:
3.2. MRVM-based dynamic FE model calibration
Through the training process of the MRVM model, the interdependent relationship between uncertain design parameters and modal features calculated using FEM is constructed. Using the trained model, it is possible to make a prediction as accurately as possible for the unknown modal features. Then, during the optimizing search process, the trained MRVM can be adopted instead of the FEM calculation to obtain the modal parameters corresponding to each feasible solution xF. Hereafter, we integrated the MRVM model with dynamic FE model calibration of concrete dams and the flowchart of the procedure is shown in Fig. 2. The basic steps are as follows:
Fig. 2The flowchart of dynamic FE model calibration of concrete dams based on MRVM using strong-motion records
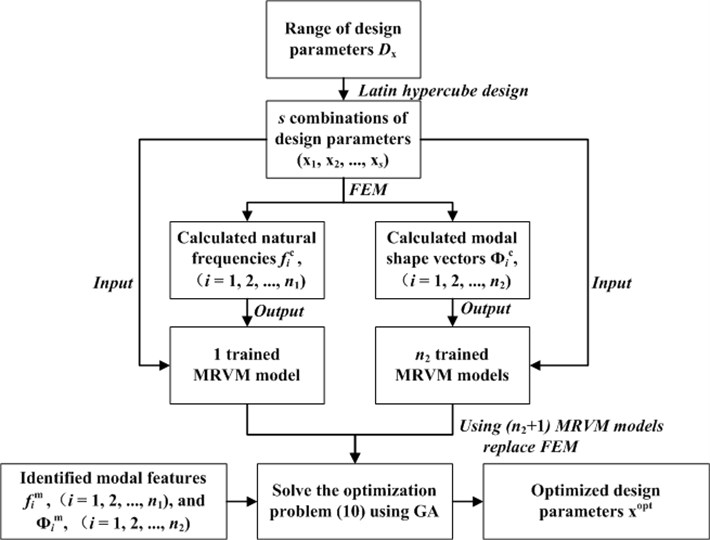
(1) According to the engineering analogy, field testing or laboratory testing, the possible range Dx of all uncertainty design parameters x of a structure are obtained; then, s calculation schemes (x1, x2,…, xs) are designed by using Latin hypercube design [32], and each type of calculation scheme represents a possible combination of all the uncertain design parameters.
(2) According to the calculation scheme designed, the structural modal parameters, i.e.fci, (i=1, 2,…, n1) and Φci, (i=1, 2,…, n2) are calculated using FEM.
(3) Using different combinations of structural uncertainty design parameters [x1, …, xs] as input and the modal parameters calculated by FEM as output, the MRVM model is trained by using the input-output samples. Take n1 order natural frequencies as output, a MRVM model is trained. For n2 order of modal shape vectors with l observed coordinates, we train another n2 MRVM models. Therefore, (n2+1) MRVM models should be trained in the total. Then, the non-linear relationship between the structural uncertainty design parameters and modal parameters of the structure is established by the (n2+1) MRVM models.
(4) The modal parameters fmi, (i=1, 2,…, n1) and Φmi, (i=1, 2,…, n2) of a realistic dam are identified based on the seismic response record using SOBI-based method. Within the range of structural uncertainty design parameters, i.e., Dx, GA is used to search for the optimized structural uncertainty design parameters, which minimizes the objective Eq. (15), and the obtained optimal solution xopt is the calibrated value of the structural uncertainty design parameters. In the process of optimizing search, the trained MRVM models, instead of FEM, is used to obtain the structural modal parameters corresponding to different feasible solutions.
4. Case study
4.1. Numerical example
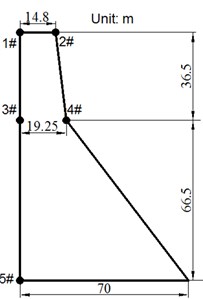
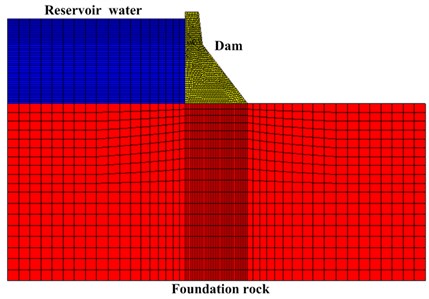
The maximum dam block of a concrete gravity dam is used as an example to verify the proposed FE model calibration method. The length of the dam block is 16 m. The FE model of dam block No. 19 is shown in Fig. 3. The width of the dam block is 10 m. The locations of five seismographs, numbered from #1 to #5, with two measurement directions, i.e., river flow direction and vertical direction, are shown in Fig. 3(a). The dynamic modulus of elasticity, Poisson’s ratio and mass density of the dam concrete are 31.0 GPa, 0.2 and 2643 kg/m3, respectively; the dynamic elastic modulus and Poisson’s ratio of the foundation rock are 20.0 GPa and 0.25, respectively.
Fig. 3a) The size of the numerical model; b) FE model of dam-reservoir-foundation system
a)
b)
In this work, the MSC.Marc software is used to construct the 3D FE model of the dam. The FE model constitutes 12820 elements and 16995 nodes. Element type 7 (element type 7 is an eight-node, isoparametric, arbitrary hexahedral) is used for the dam body and foundation. Reservoir water is assumed to be inviscid and incompressible, and the added mass approach is used to simulate fluid-solid interaction. The massless spring model is adopted to simulate the foundation when calculating the vibration response of the structure. The El Centro earthquake wave (peak acceleration ap= 0.3188 m/s2) is used as excitation and the earthquake response of the dam is obtained by adding together the seismic response calculated using the mode-superposition method (10 modes are used) and some noise. In this study, the signal-noise-ratio (SNR) of the simulated seismic response is equal to 50 db. SNR is defined as:
in which, σ2y* is the variance of real signal; σ2v is the variance of noise. The El Centro earthquake wave and the simulated seismic response record (sampling frequency fs= 50 Hz) of the dam at measurement point #1 (in the river flow direction) are shown in Fig. 4.
Fig. 4a) The El Centro earthquake wave; b) the simulated earthquake response record of measurement point #1 (in river stream direction)

a)

b)
A comparison between the natural frequencies identified using the SOBI-based method, SSI-Data (data-driven stochastic subspace identification) [33] method and the modal parameters calculated using FEM is shown in Table 1. The maximum relative error is 0.13 % and 0.08 % for SOBI-based method and SSI-Data method, respectively. It indicates that the SOBI-based method has higher modal identification accuracy.
Table 1Comparison between modal frequencies calculated using FEM and modal parameters identified using simulated seismic response record (unit: Hz)
Orders | 1 | 2 | 3 | 4 | 5 | 6 | 7 | 8 | 9 | 10 |
FEM | 1.051 | 2.506 | 3.770 | 5.556 | 6.246 | 7.907 | 8.345 | 10.914 | 11.927 | 12.528 |
SSI | 1.052 | 2.507 | 3.775 | 5.552 | 6.242 | 7.910 | 8.345 | 10.917 | 11.925 | 12.535 |
SOBI | 1.051 | 2.504 | 3.771 | 5.557 | 6.243 | 7.906 | 8.346 | 10.917 | 11.926 | 12.530 |
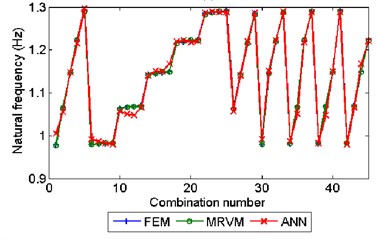
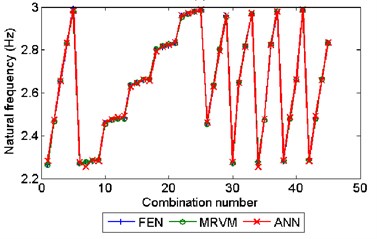
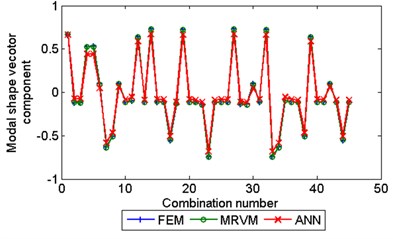
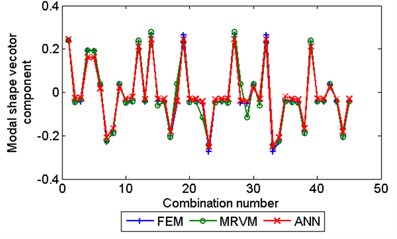
In this example, the dynamic elastic modulus of dam concrete Edc and dam foundation rock materials Edr are selected as uncertain design parameters. Assume that the real values of Edc and Edr are 31 GPa and 20 GPa, respectively, and that the possible ranges of the two uncertain parameters are set as [20, 35] GPa and [15, 25] GPa, respectively. Within the ranges of the two parameters, 100 calculation solutions are determined according to the Latin hypercube design, and then the FEM is used to extract the first 10 orders of natural frequency of the structure and the first modal shape vector. Then, using the 100 different combinations of Edc and Edr as input and the first 10 orders of natural frequencies and modal shapes calculated by FEM as outputs, 2 MRVM models (1 MRVM model for all the 10 orders of natural frequencies and 1 MRVM model for the first modal shape vector) are trained. Using the trained MRVM models the structural modal features corresponding to another 45 combinations of Edc and Edr, which are different with the training samples, are predicted. Some prediction results using MRVM and ANN (using the matlab function ‘newrb.m’) are shown in Fig. 5. As shown in this figure, the MRVM model show better prediction result than the ANN model. For the MRVM model the maximum relative prediction error of the1st 10 orders of natural frequency and the 1st order modal shape vector are 0.36 % and 3.2 %, respectively.
GA is used to search for the optimal solution, and the trained MRVM instead of FEM, is used to obtain the natural frequencies of the dam corresponding to different feasible solutions (the value of dynamic modulus). The fitness change in the GA search process is shown in Fig. 6. The optimized minimum fitness is –9.31e-5 and the corrected dynamic elastic modulus of concrete and rock are 20.020 GPa and 30.993 GPa, respectively. This figure shows that 600 iteration steps are needed to obtain the stable optimization solution. For each iteration step, the population size of GA is 200. For the traditional model updating method, the total number of FEM calculations is 120000 (600×200), while for the method proposed in this paper, only 100 FEM calculations are implemented. This will greatly improve the computational efficiency.
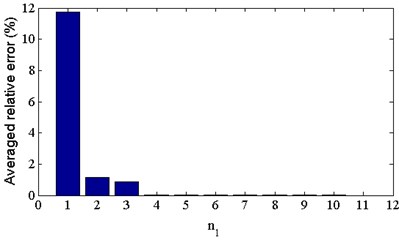
Different numbers of natural frequencies n1 and modal shape vectors n2 are used and the corresponding FE model calibration accuracy is shown in Fig. 7 and Table 2. Fig. 7 shows that when n1> 3 (n2=0), the difference between the dynamic elastic modulus value of concrete and rock materials after calibration compared to the true design value is small. Table 2 indicates that using more modal vectors can improve the accuracy, but the effect is not obvious. Even only 10 orders of natural frequency were used the accuracy of FE model calibration can meet the precision requirement in engineering.
Fig. 5The prediction result of MRVM and ANN model for a) the 1st order natural frequency; b) for the 2nd order natural frequency; c) the 2nd component of the 1st order modal shape vector (scaled by the 1st component) and d) the 3rd component (scaled by the 1st component) of the 1st order modal shape vector
a)
b)
c)
d)
Fig. 6The fitness change in the GA search process
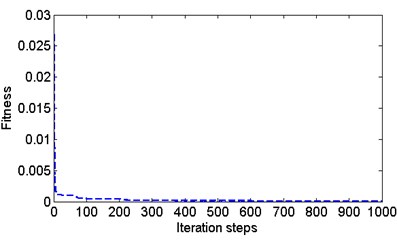
Fig. 7The averaged relative error of calibrated dynamical elastic modulus using different number of natural frequencies n1 (n2= 0)
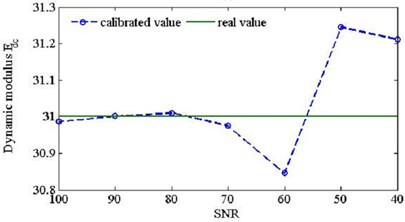
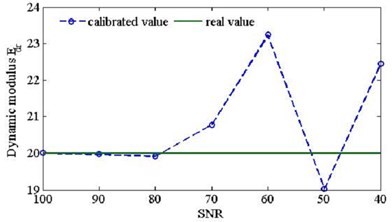
In order to evaluate the robustness of the proposed dynamic FE model calibration method, different identification error is simulated by adding some noise to the real value of modal parameters. As shown in Fig. 8, with the decrease of SNR, the relative error of calibrated dynamic elastic modulus increases. When SNR< 70 dB, the maximum relative error is greater than 3.9 %. It means that the modal identification error should keep the SNR greater than 70 dB, to obtain meaningful calibration results of dynamic modulus in this numerical example. Using the modal identification results shown in Table 1, the SNR is calculated using Eq. (24). For SOBI-based method, the SNR=76 db, which means that the modal identification accuracy is enough to obtain meaningful calibration results of dynamic modulus.
Table 2Comparison of the dynamic modulus Edr and Edc before and after calibration using different number of modal shape vectors n2(n1=10)
Case | n1=10, n2=0 | n1=10, n2=1 | n1=10, n2=2 | n1=10, n2=3 | ||||
Calibrated value (GPa) | Edr | Edc | Edr | Edc | Edr | Edc | Edr | Edc |
20.011 | 30.987 | 20.02 | 30.993 | 20.013 | 30.994 | 20.008 | 31.005 | |
Relative error (%) | 0.055 | 0.0419 | 0.100 | 0.0226 | 0.065 | 0.0194 | 0.040 | 0.016 |
Fig. 8comparison of calibrated dynamical elastic modulus using the identified modal parameters (n1= 10, n2= 0) with different SNR level
a)
b)
4.2. Engineering example
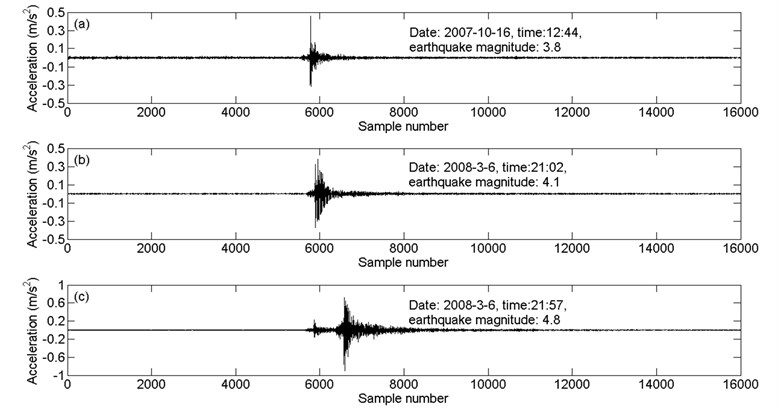
A roller-compacted concrete (RCC) gravity dam is located in the middle stream of the Minjiang River in the Fujian province of China. The maximum height of the RCC gravity dam is 101.0 m and its normal flood level is 65.0 m, with a corresponding water storage capacity of 2.6×10⁹ m3. This project is located near the Taiwan Strait seismic zone, and thus seismographs are installed on dam blocks No. 19 and No. 25. The arrangement and location of these seismographs are shown in Fig. 9. The measurement channels and corresponding measurement directions of these seismographs are shown in Table 3. In this study, the earthquake response measured by seismographs on dam block No. 19 at 3 different times is used to perform modal identification and dynamic FE model calibration. For each earthquake response record, the sample size is 16,000 and the sampling frequency is 100 Hz. The earthquake response record of channel 3 at three different times is shown in Fig. 10. The constitutive model of the dam concrete material and foundation rock material is assumed to be elastic. The laboratory testing values of the dynamic elastic modulus of the dam body and dam foundation materials are 24 GPa and 20 GPa, respectively, and the Poisson ratios used are 0.167 and 0.2, respectively.
Table 3Seismographs installed on dam block No. 19
Seismograph number | SE1 | SE2 | SE3 | SE4 |
Channel number | 1-3 | 4-5 | 6 | 7-9 |
Measurement direction | vertical, transverse, longitudinal | transverse, longitudinal | longitudinal | vertical, transverse, longitudinal |
Fig. 9a) View of the whole hydraulic engineering; b) Arrangement of seismographs on elevation review of dam; c) cross section of dam block No. 19
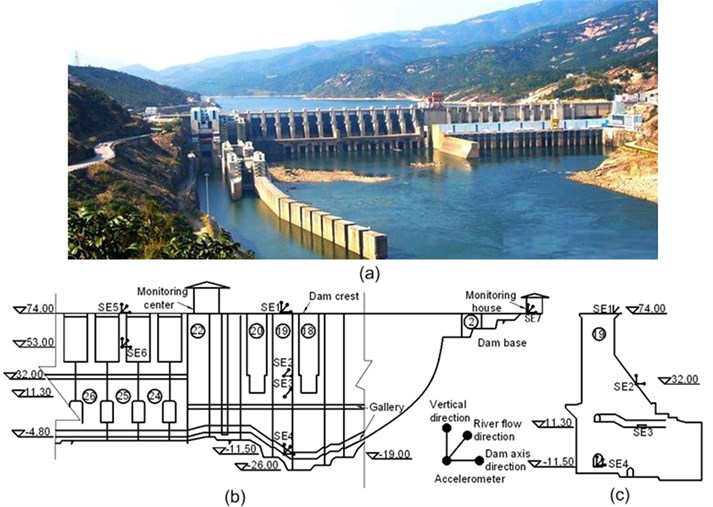
Fig. 10The earthquake response record of channel 3: a) number I, b) number II and c) number III
Based on the laboratory testing result of the dynamic elastic modulus and by making reference to some similar engineering, the ranges of the dynamic elastic modulus of dam body Edc and dam foundation rock materials Edr are set as [20, 40] GPa and [10, 25] GPa, respectively. Then, 100 combinations of the two uncertain parameters are made based on the Latin hypercube design. Based on the experience obtained from the numerical verification example, the FEM software MSC. Marc is used to extract the first 10 orders of natural frequencies and the first order modal shape vector of the structure corresponding to the 100 different combinations of dynamic elastic modulus. Using the 100 combinations of the two uncertain parameters as input and the calculated modal parameters as output, the MRVM model is trained. During the optimizing search, the trained MRVM instead of FEM is adopted to reduce the computation time.
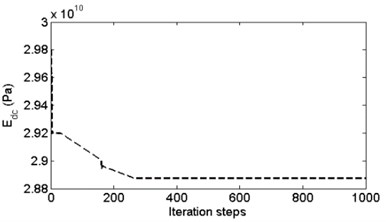
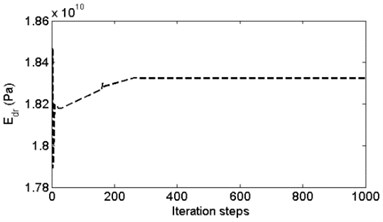
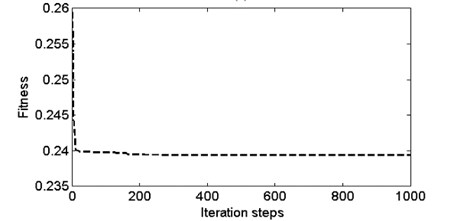
According to the earthquake response record of the dam at three different times, as shown in Fig. 10, the modal parameters of the structure are identified using the SOBI-based method, and then the dynamic FE model of the structure is calibrated. For earthquake response record number I, the change of the optimal solution and fitness in the GA optimizing search process are shown in Fig. 11.
Fig. 11a) The change of dynamic elastic modulus Edc and b) the change of Edr; c) the change of fitness during the optimizing search of GA
a)
b)
c)
The corrected values of dynamic elastic modulus of dam concrete Edc and base rock material Edr are shown in Table 4. This table shows that by using the earthquake response record at different times, the corrected values of the structural dynamic elastic modulus have some deviations, which may have been caused by modal identification error and the change of structure. The mean values of the dynamic elastic modulus Edr and Edc are 18.47 and 28.78 GPa, respectively, which are somewhat different compared to the design values (20 GPa and 24 GPa) of the two uncertain design parameters.
Table 4Comparison of dynamic modulus of elasticity Edr and Edc before and after calibration (GPa)
Seismic record number | I | II | III | Mean value | ||||
Dynamic modulus of elasticity | Edr | Edc | Edr | Edc | Edr | Edc | Edr | Edc |
18.32 | 28.87 | 18.46 | 28.43 | 18.67 | 29.05 | 18.47 | 28.78 | |
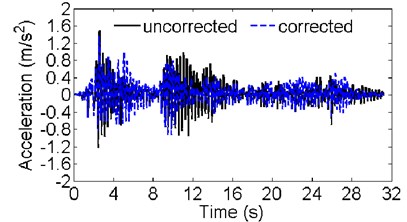
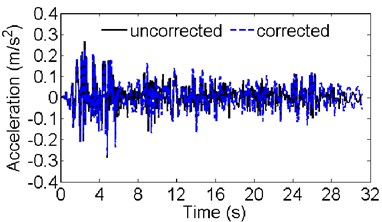
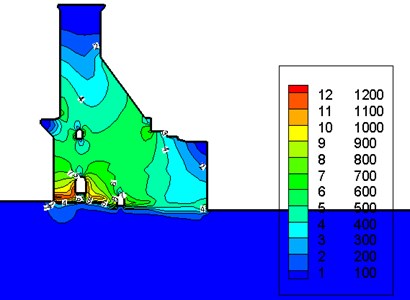
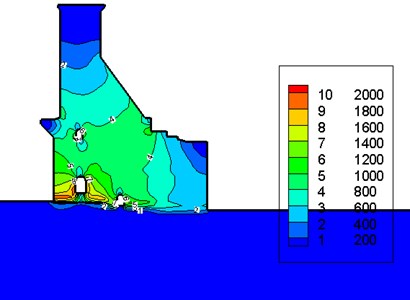
Using the calibrated FE model, the earthquake response of the dam under the El Centro seismic wave is calculated. The comparison of acceleration responses of the dam crest at the position of the seismograph numbered SE1 is shown in Fig. 12. The comparison of the maximum amplitudes of the first principle stress (tensile) during the earthquake is shown in Fig. 13. In Fig. 13, to facilitate the figure display, only part of the foundation is shown. For the uncorrected model and the corrected model, the magnification factors of acceleration in the river flow direction of the dam crest are 4.7 and 4.3, and the maximum amplitudes of the first principle stress are 1.7 MPa and 2.5 MPa, respectively. The difference between the calculation results of the earthquake response using the two models shows the necessity of structure dynamic FE model calibration.
Fig. 12Comparison of the acceleration response calculated using the uncorrected and corrected FE model at the position of the seismograph numbered SE1 in a) the river flow direction and b) vertical direction
a)
b)
Fig. 13a) The maximum amplitude of the first principle stress (tensile) calculated using the uncorrected FE model; b) the calculation result using the calibrated FE model (unit: 103 Pa)
a)
b)
5. Conclusions
The analysis result of the numerical example and the engineering case shows that the proposed dam dynamic FE model calibration method of concrete dams based on strong-motion records and the MRVM model has good performance. Using the MRVM model, instead of FEM calculation, during the optimizing search process can improve the computational efficiency while keeping the accuracy very high. For some earthquake-prone areas, the strong-motion observation of dams is important, and many strong-motion observation systems of dams have been constructed. Therefore, this study, which is based on the earthquake response records of dams to identify structural modal parameters and then to calibrate the dynamic models of structures, has important significance.
References
-
Li A., Ding Y. Analysis for Earthquake Resistance of Engineering Structures. High Education Press, Beijing, China, 2010, (in Chinese).
-
Guo Q. T., Zhang L. M., Fei Q. G. From FE model updating to model validation: advances in modeling dynamic structures. Advances in Mechanics, Vol. 36, Issue 1, 2006, p. 17-26, (in Chinese).
-
Mirzabozorg H., Hariri-Ardebili M. A., Heshmati M., Seyed-Kolbadi S. M. Structural safety evaluation of Karun III Dam and calibration of its finite element model using instrumentation and site observation. Case Studies in Structural Engineering, Vol. 1, 2014, p. 6-12.
-
Zhang G., Zhang C., Li W., Wang G. Vibration measurement and analysis of Quanshui arch dam. Science China Series A, Vol. 29, 1986, p. 423-438, (in Chinese).
-
Marwala T. Finite-element-model Updating Using Computional Intelligence Techniques. Springer, London, Dordrecht, Heidelberg, New York, 2010.
-
Osmancikli G., Bayraktar A., Türker T., Uçak S., Mosallam A. Finite element model calibration of precast structures using ambient vibrations. Construction and Building Materials, Vol. 94, 2015, p. 10-21.
-
Zhang Q., Chang T., Chang C. Finite-Element model updating for the Kap Shui Mun cable-stayed bridge. Journal of Bridge Engineering, Vol. 6, Issue 4, 2001, p. 285-293.
-
Ntotsios E., Karakostas C., Lekidis V. Structural identification of Egnatia Odos bridges based on ambient and earthquake induced vibrations. Bulletin of Earthquake Engineering, Vol. 7, 2009, p. 485-501.
-
Proulx J., Paultre P., Rheault J. An experimental investigation of water level effects on the dynamic behavior of a large arch dam. Earthquake Engineering and Structure Dynamics, Vol. 30, 2001, p. 1147-1166.
-
Alves S. W., Hall J. F. System identification of a concrete arch dam and calibration of its finite element model. Earthquake Engineering and Structural Dynamics, Vol. 35, 2006, p. 1321-1337.
-
Sevim B., Altunisik A. C., Bayraktar A. Earthquake behavior of Berke arch dam using ambient vibration test results. Journal of Performance of Constructed Facilities, Vol. 26, 2012, p. 780-792.
-
Feng X., Zhou J., Fan Y. F. Inverse analysis of concrete dam with modal measurements. Journal of Hydraulic Engineering, Vol. 2, 2004, p. 101-105.
-
Karimi N., Khaji M. T., Ahmadi M. M. System identification of concrete gravity dams using artificial neural networks based on a hybrid finite element-boundary element approach. Engineering Structures, Vol. 32, 2010, p. 3583-3591.
-
Deng Y., Ren W., Wang F. Structure finite element model updating based on static-load response surface methodology. Journal of Experimental Mechanics, Vol. 23, Issue 2, 2011, p. 103-108.
-
Zheng D. J., Cheng L., Bao T. F., Lv B. B. Integrated parameter inversion analysis method of a CFRD based on multi-output support vector machines and the clonal selection algorithm. Computers and Geotechnics, Vol. 47, 2013, p. 68-77.
-
Tipping M. E. Sparse Bayesian learning and the relevance vector machine. Machine Learning Research, Vol. 1, 2001, p. 211-244.
-
Tipping M. E., Faul A. Fast marginal likelihood maximization for sparse Bayesian models. Proceedings of the 9th International Workshop on Artificial Intelligence and Statistics, Key West, FL, 2003.
-
Hernández N., Talavera I., Biscay R. J., Ferreira M. M. C., Porro M. D. Relevance vector machines for multivariate calibration purposes. Journal of Chemometrics, Vol. 22, 2008, p. 686-694.
-
Thayananthan A., Navaratnam R., Stenger B., Torr P. H. S., Cipolla R. Multivariate relevance vector machines for tracking. Proceedings of the European Conference on Computer Vision, Austria, 2006.
-
Thayananthan A. Template-based Pose Estimation and Tracking of 3D Hand Motion. University of Cambridge, UK, 2005.
-
Schölkopf B., Smola A. Learning with Kernels. Cambridge (MA), MIT Press, UK, 2002.
-
Rainieri C. Operational Modal Analysis for Seismic Protection of Structures. University of Naples “FEDERICO II”, 2008.
-
Loh C. H., Wu T. C. System identification of Fei-Tsui arch dam from forced vibration and seismic response data. Journal of Earthquake Engineering, Vol. 4, Issue 4, 2000, p. 511-537.
-
Kou L., Jin F., Yang J., Wang J. Modal parameter identification of Ertan arch dam from strong earthquake records. Journal of Hydroelectric Engineering, Vol. 28, Issue 5, 2008, p. 51-56., (in Chinese).
-
Darbre G. R., De Smet C. A. M., Kraemer C. Natural frequencies measured from ambient vibration response of the arch dam of Mauvoisin. Earthquake Engineering and Structure Dynamics, Vol. 29, Issue 5, 2000, p. 577-586.
-
Cheng L., Zheng D. J. The identification of a dam's modal parameters under random support excitation based on the Hankel matrix joint approximate diagonalization technique. Mechanical Systems and Signal Processing, Vol. 42, Issues 1-2, 2014, p. 42-57.
-
Hariri-Ardebili M. A., Mirzabozorg H. A comparative study of seismic stability of coupled arch dam-foundation-reservoir systems using infinite element and viscous boundary models. International Journal of Structural Stability and Dynamics, Vol. 13, Issue 6, 2013, p. 1-24.
-
Gene H. G., Franklin T. L., Michael L. O. A block Lanczos method for computing the singular values and corresponding singular vectors of a matrix. ACM Transactions on Mathematical Software, Vol. 7, Issue 2, 1981, p. 149-169.
-
Larsson P. O., Sas P. Model updating based on forced vibration testing using numerically stable formulations. Proceedings of 10th International Modal Analysis Conference, San Diego, USA, 1992.
-
Ongsakul W., Dieu V. N. Artificial Intelligence in Power System Optimization. Taylor and Francis, 2013.
-
Kohavi R. A study of cross-validation and bootstrap for accuracy estimation and model selection. Proceedings of IJCAI: International Joint Conference on Articial Intelligence, San Mateo, USA, 1995.
-
Urban Nathan M., Fricker Thomas E. A comparison of Latin hypercube and grid ensemble designs for the multivariate emulation of an Earth system model. Computers and Geosciences, Vol. 36, 2010, p. 746-755.
-
Reynders E., De Roeck G. Reference-based combined deterministic-stochastic subspace identification for experimental and operational modal analysis. Mechanical Systems and Signal Processing, Vol. 22, 2008, p. 617-637.
Cited by
About this article
This work was supported by the National Natural Science Foundation of China (Grant Nos. 51409205, 51279052, 51409018, 51309189), Project Funded by China Postdoctoral Science Foundation (Grant No. 2015M572656XB), the Open Foundation of State Key Laboratory of Hydrology-Water Resources and Hydraulic Engineering (Grant No. 2014491011), the innovative research team of institute of water resources and hydro-electric engineering, Xi’an University of Technology (Grant No. 2016ZZKT-14) and Program 2013KCT-15 for the Shanxi Provincial Innovative Research Team.
Professor Jie Yang provided some vibration monitoring data for the engineering example. Professor Dongjian Zheng provided a finite element model for the numerical example. Fei Tong made some calculation using FEM and interpreted the results. Shiyu Zheng did some work in the signal processing and article writing.

