Abstract
In order to study turbulence conditions in an underwater square cavity, the large eddy simulation method was adopted to analyze flow field distributions in the cavity as well as its development and pressure pulsation characteristics at some key positions. MATLAB was also adopted to realize Fast Fourier Transform of signals in time domain and obtain pressure pulsation levels in frequency domain. Based on the analyzed results, pressure pulsation characteristics of key points in the cavity were further discussed. The results showed that pressure pulsation frequencies and characteristics were different with different positions in the square cavity and were closely related with relevant vortex motion states. It was found through comparisons with the experimental results, that pressure pulsation simulation had a good consistency with the experiment when the analyzed frequency was more than 31.5 Hz. As a result, feasibility and accuracy of numerical simulation and Fourier analysis methods were verified. Finally, a numerical model of square cavity in near sound field was built, and sound source intensity distributions at two frequency points were extracted. It could be found that the sound source intensity was large at the rear-edge step, which was consistent with the intensity distribution of vortices. Therefore, reliability of the numerical model in this paper was indirectly verified in the results.
1. Introduction
Noise generated when the fluid flowed through a square cavity was a kind of problems which can often take place in engineering. The square cavity may be an air pipeline, a cavity in a turbine motor, a gap and a drain hole of underwater vehicle, etc. Research on the flow mechanism in the cavity has attracted extensive attention [1-4]. In recent years, with rapid development of Computational Fluid Dynamics (CFD), the computational aero-acoustics based on CFD and aerodynamic noise interdiscipline has also obtained fast development. The research of noises in a solid cavity and unsteady turbulence mechanism based on the numerical simulation method provided a basis for studying and reducing vortex noises. Powell considered that fluid, flow field and radiation sound field were from vortex under low Mach number conditions, where the source can be eliminated by researching vortex motions in the flow field and sound pressure [5]. Rowley adopted the direct numerical simulation method to research the flow mechanism and radiation noises of a two-dimensional opened cavity under laminar flow conditions [6]. Shieh has adopted DES method to research flowing in two-dimensional cavity and three-dimensional cavity respectively, and compared average flow line and average pressure distribution characteristics of two cavities under a shear layer mode and a trailing vortex mode [7]. Gloerfelt adopted LES method to research the aerodynamic noise of a three-dimensional rectangular square cavity caused by laminar flow and turbulent boundary layer [8]. Larcheveque adopted LES method to reproduce deep cavity overflowing, and accurately predicted a fundamental frequency and the peak value of first-order harmonic wave using spectral analysis [9]. Ask computed the turbulent flow problem in the two-dimensional rectangular cavity with Mach number of 0.15 and found that wall face pressure pulsation was an important dipole sound source [10].
The mentioned researches mainly focused on aerodynamic characteristics of the square cavity and obtained certain achievements. However, flow field characteristics in the square cavity under hydro-dynamic were rarely researched, and it was mainly because that water was an incompressible fluid medium and was generally considered as a low Mach number. In general, an underwater vehicle had a large Reynolds number and very low sound conversion efficiency, while the coupling effect was strong between sound field and structure in water, so that prediction and control of hydro-dynamic noise were very complex.
Through numerical simulation of flow field under hydro-dynamic, the paper analyzed pressure pulsation characteristics at different positions. Pressure pulsation levels in the frequency domain were obtained through Fast Fourier Transform. The values were then compared with the experimental results to verify its reliability. Then, near sound field characteristics of the square cavity were computed, and sound source intensity distributions at two frequency points were extracted. The results were basically consistent with the intensity distribution of vortices, so the reliability of the numerical model was also verified indirectly. Meanwhile, this research also provided a fast and reliable computation method for analyzing the sound field in the square cavity.
2. The computational method
2.1. Large eddy simulation
Large Eddy Simulation (LES) was applied to conduct numerical analysis for the transient flow field of the square cavity, and changes on the sound source surface was computed regarding relevant variables which satisfied accuracy requirements of time. As a numerical simulation method between direct numerical simulation and Reynolds averaging method, LES’s idea can be summarized as follows: the instantaneous N-S equation could be used to directly simulate large-scale vortices in turbulence rather than small-scale vortices, and the influence of large-scale vortices on small-scale vortices was considered by the approximate model. N-S equations were filtered in physical space, obtaining LES equation [11-13] as follows:
where ρ was the fluid density. ¯ui and ¯uj were the filtered velocity components. ¯p was the filtered pressure. μ was the turbulent viscosity coefficient. And τij was the subgrid scale stress, which reflected the influence of motion of small-scale vortices on the equation.
To close control equation, the viscosity model of vortex was widely applied as the subgrid model currently as follows:
where δij was the Kronecker coefficient. μt was the subgrid turbulent viscosity coefficient. τkk was the isotropic subgrid scale stress. And Sij was the component of tensor for strain rate, which was defined as below:
2.2. Analysis method of pressure pulsation
Noises of key positions obtained by numerical simulation was from pressure pulsation information in a time period, where the pulsation information was a flowing signal in time domain and the turbulence noise was frequency domain information. Therefore, Fast Fourier Transform [14, 15] was used to realize a conversion of LES results from time domain to frequency domain.
Discrete Fourier transform was conducted to the finite length sequence x(n), which was shown as follows:
where: WnkN=e-2jπ/N was a twiddle factor.
N times of complex multiplication and (N-1) times of complex addition were required during computation of X(k) for a k value in the complex number sequence x(n). As for Nk values, N2 times of complex multiplication and N(N-1) times of complex addition were required. By means of symmetry (WkN=-Wk+N/2N) and periodicity (WkN=Wk+NN) of the twiddle factor, DFT with long sequence and large point number was divided into DFT with small point numbers. Overall DFT computation was replaced by computation of multiple DFT with small point numbers in order to reduce computation time, obviously increase DFT computation speed.
The 1/3 octave processing was conducted to data in frequency domain. The total pressure level was equivalent to the following formula:
where, i was 1/3 octave bandwidth signals in the octave band. Lpi was measured value of the ith 1/3 octave pressure levels in the octave bandwidth.
3. Computational model of flow field in the square cavity
The square cavity computation model was shown in Fig. 1. Total scale of the computed area was 4.3 m×0.9 m×0.8 m, wherein the square cavity scale was 0.3 m×0.3 m×0.2 m. water was taken as the flowing medium; a uniform flow speed of 7m/s was given at the inlet during computation; corresponding Reynolds number was2.1×106; the outlet satisfied mass conservation according to incompressible flow conditions; the lower boundary was an impermeable solid wall face which satisfied non-slip flowing conditions, and speed and pressure gradient were set to be 0 for the upper boundary.
Fig. 1Square cavity model and boundary conditions
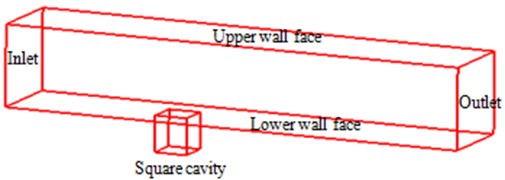
Fig. 2 presented mesh distributions of the cavity on X-Y plane. During mesh generation, vortex generation and development regions were mainly refined, while gradual transition method was applied to the other region in order to reduce total quantity of meshes. According to model requirements for meshes at the wall face, the non-dimensional vertical distance y+ of the first-layer meshes on the wall face was kept around 10 and the total quantity of meshes in the overall computation region was 91,250, where the quantity of meshes in the square cavity was 15,000. The computational time step of the unsteady flow field was 0.01 s, and the motion process of flow within 0.9 s was computed.
Fig. 2Meshes of the square cavity

a) Meshes of the square cavity
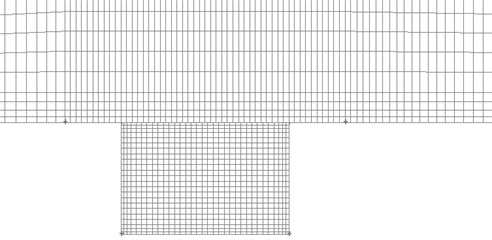
b) Local meshes of the square cavity
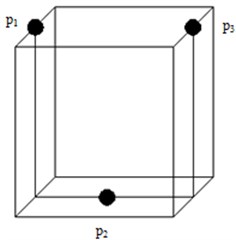
Fig. 3 presented key positions of the square cavity. The front edge point p1 was used to investigate flowing changes of the left side incoming flow which passed the front of the cavity. The p2 on the cavity bottom was used to monitor influences brought by fluid flowing in the cavity on bottom wall face. The rear edge pointp3was used to analyze flowing changes of the incoming flow which hit the steps. Pressure pulsation at three points was analyzed, and then sound pressure analysis was conducted.
Fig. 3Positions of monitoring points
4. Computational results of flow field in the square cavity
Pressure, vortex intensity and velocity distribution in the square cavity were computed according to the numerical model, which were respectively shown in Fig. 4, Fig. 5 and Fig. 6. It was shown in the figures that when the fluid hit the steps on the right side, pressure, vortex intensity and speed were large at this position due to sudden changes of flowing direction. As time went by, the flow field at this position was gradually weakened because the fluid in the square cavity had gradually adapted itself to the environment.
Fig. 4Pressure pulsation with different time in the square cavity
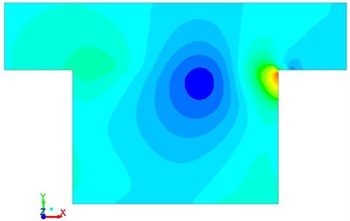
a)t=0.01 s
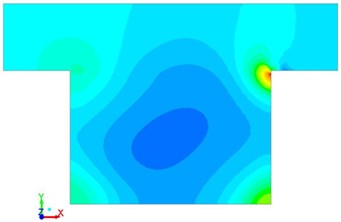
b)t=0.3 s
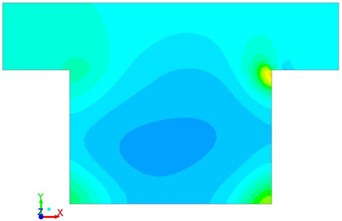
c)t=0.6 s
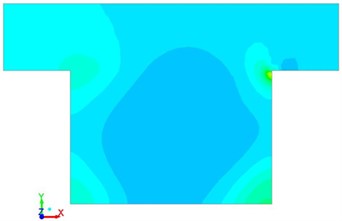
d)t=0.9 s
Fig. 5Vortex intensity with different time in the square cavity
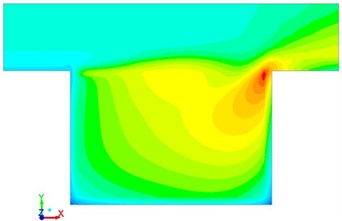
a)t=0.01 s
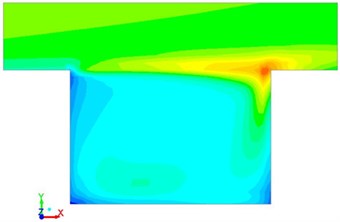
b)t=0.3 s
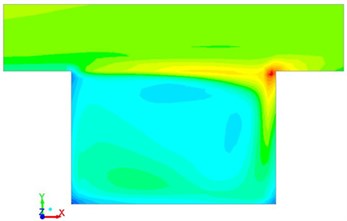
c)t=0.6 s
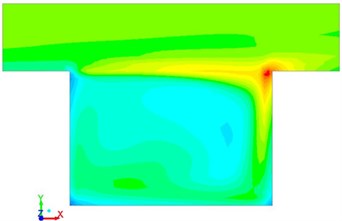
d)t=0.9 s
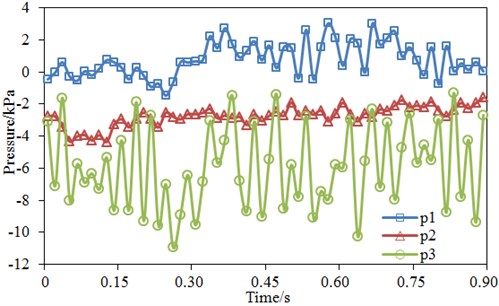
Fig. 7 showed pressure pulsation distribution of three monitoring points in the square cavity within the computational time step. It was shown in the figure that periodical or quasi-periodical pulsation characteristics were presented in three points. Point p3 had the largest pressure pulsation amplitude, point p2 had the smallest pressure pulsation amplitude, and point p1 presented the most unapparent periodical effect. Average value of point p1 was basically around 0. Average values of point p2 and p3 were negative. Point p3 had the maximum negative pressure value. In addition, the maximum pressure pulsation was 3.2 kPa, while the minimum value was –1.6 kPa at point p1. The maximum pressure pulsation was –2.3 kPa, while the minimum value was –4.3 Pa at point p2. The maximum pressure pulsation was –1.6 kPa, while the minimum value was –11.2 kPa at point p3. It was presented that pressure pulsation characteristics of each point were related with its position: point p3 was located at the rear edge step of the cavity, vortices generated by the fluid at the front edge realized growth and combination and would then be broken and generate severe changes, and vortices would be formed once again on the horizontal wall face along the rear edge, so that the pressure pulsation became severe and had a large amplitude. Point p2 was located at the bottom center of the square cavity and the vortex had a large size and was kept steady at the center of the cavity body, so the pressure pulsation amplitude was small at point p2. Influenced by boundary condition changes when water entered into the cavity, point p1 at the inlet end of the square cavity was suddenly evolved from a steady flowing state into a severe backward step vortex state and also restrained by the center vortex, so that pressure change with periodical pulsation and unsteady amplitude were formed.
Fig. 6Flowing velocity with different time in the square cavity
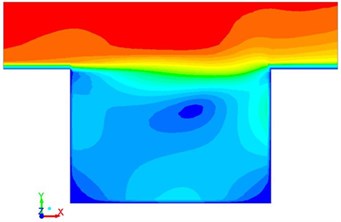
a)t=0.01 s
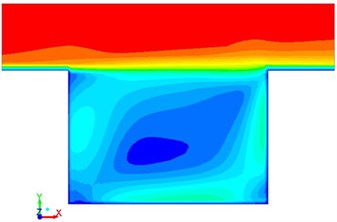
b)t=0.3 s
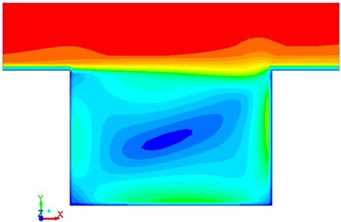
c)t=0.6 s
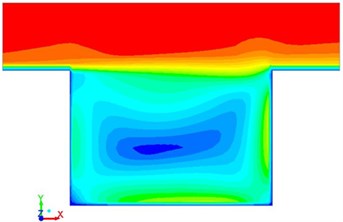
d)t=0.9 s
Fig. 7Pressure pulsation of three monitoring points
5. Analysis of pressure pulsation levels in the square cavity
5.1. Fourier pressure levels
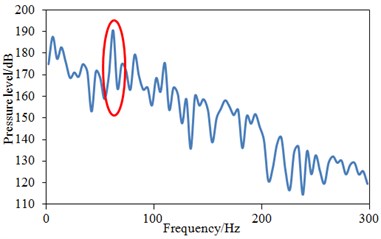
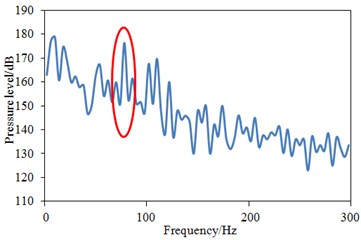
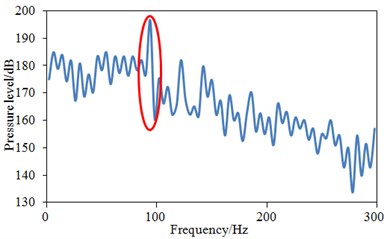
The numerical simulation method was applied to obtain the pressure pulsation of each monitoring point, as shown in Fig. 7. Then, FFT was adopted to transform pressure pulsation from time domain to frequency domain, as shown in Fig. 8. It was clear that with increase of the frequency, the pressure level tended to decrease, while several peak points were at the same time. The maximum pressure pulsation level was 193 dB, while the minimum value was 114 dB at point p1, with the difference of 79 dB. In entire frequency domain, many valleys were also in the pressure pulsation level curve of point p1. The maximum pressure pulsation level was 178 dB, while the minimum value was 124 dB at point p2, with the difference of 54 dB. The maximum pressure pulsation level was 196 dB, while the minimum value was 133 dB at point p3, with the difference of 63 dB. The first peak value which was over 10 Hz was taken as the main frequency value, so the main frequency values of p1, p2 and p3 were respectively 74 Hz, 82 Hz and 96 Hz. It was found that the peak frequency of p1 was less than those of p2 and p3.
Fig. 8Pressure levels of three monitoring points under frequency domain
a)p1 point
b)p2 point
c)p3 point
5.2. Experimental verification
To test pressure pulsation of wall face of the square cavity, dynamic pressure sensors were arranged near three monitory points in the experiment, as shown in Fig. 3. However, many difficulties were still in the measurement of pressure pulsation of wall face, such as extremely small signal intensity of pressure pulsation. Secondly, pressure pulsation signal of the wall face was from various large and small vortices structure in the flow field. The pulsation frequency was distributed in a wide range. The pulsation in low-frequency was related to the large-scale structure in the flow field, while the component in high-frequency was related to small-scale vortices and dissipation vortices in flow field. Therefore, relatively high requirements and greater pressure resolution were required for dynamic pressure sensors. XCQ-093 pressure sensors which were applied in the paper had very large range. If the requirements for data collection system can be satisfied, the weak pressure pulsation information on the wall face could be accurately measured. Besides, the sensor was featured with small size, high sensitivity, high stability and other advantages. Its diameter was 2 mm and response frequency was 240 kHz. However, the pulsation frequency of unsteady turbulence in square cavity was within 300 Hz. Therefore, all features of the flow field can be captured by the sensor. An amplifier which was equipped in the pressure sensor could enlarge the very weak pressure pulsation signal and meanwhile transfer high-impedance signals into low-impedance signals, which could pass through wires and input signals to data collection system without attenuation. The pressure test in the cavity was shown in Fig. 9, and the experimental process was shown in Fig. 10. The received signals of pressure sensors were imported to data collection equipment. Then, the signal was imported into a computer and conducted post-processing by using Test.Lab. Each experiment was conducted three times, and the average value was selected as the final result.
Fig. 9Pressure pulsation test in the square cavity
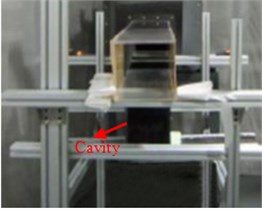
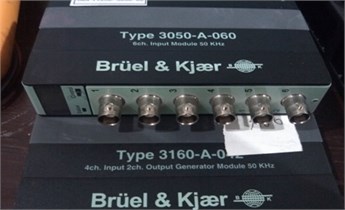
Fig. 10The experimental process in the square cavity
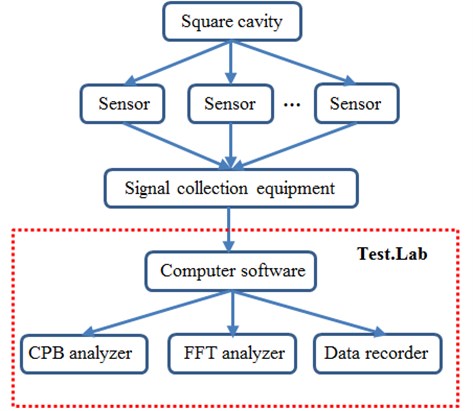
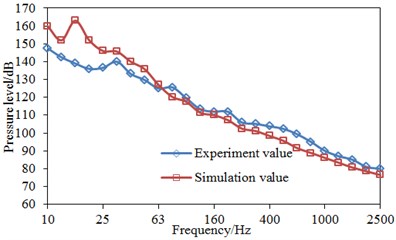
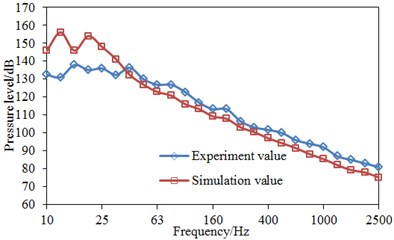
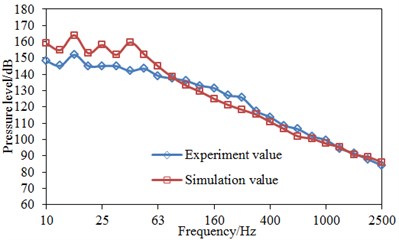
Fig. 11 presented comparisons between simulation and experiment of pressure levels at three positions, where the x-coordinate was the 1/3 octave point. It was shown in Fig. 11 that the computational results were consistent with experimental results as a whole, where the pressure pulsation levels tended to decrease with the frequency. Simulation and experiment results of three points had a good consistency after 31.5 Hz. Simulation values were more than experiment values before 31.5 Hz. Boundary conditions greatly influenced numerical simulation results in low frequency, so the actual situations could hardly be accurately simulated by boundary conditions of the simulation model and there would be certain errors. Therefore, differences were large between experiment and simulation values before 31.5 Hz. However, as a whole, the computational model was reliable and could be effectively used in the subsequent analysis.
Fig. 11Comparisons of pressure levels between simulation and experiment
a) Point p1
b) Point p2
c) Point p3
6. Numerical computation of sound field in the square cavity
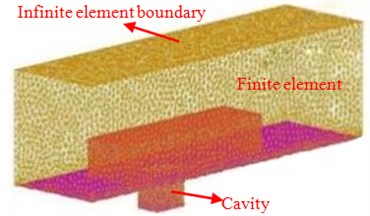
During dividing acoustic meshes, the division of meshes in the sound source area was relatively refined and kept a certain proportional relation with meshes in the corresponding flow field, while the quantity of sound source region meshes was generally 3-4 times of the flow field meshes in order to guarantee interpolation accuracy. Meshes in the finite element were closely related with the computational frequency. The sound wave was computed according to the analyzed highest frequency, where each wave length comprised at least 6-8 linear elements or 3 second-order elements. The higher the computational frequency was, the shorter wave length and the smaller mesh element would be. Finally, the largest mesh size in the sound source area was 5 mm, and the largest mesh size in the whole finite element region was 15 mm. The infinite two-dimensional mesh should be matched with the finite element three-dimensional mesh boundaries, while the infinity was set as a nonreflecting boundary condition. Mesh division situations of the sound field and settings of boundary conditions were shown in Fig. 12. Near sound field characteristics of the square cavity could be obtained based on the numerical model.
Fig. 12Sound field meshes and boundary conditions
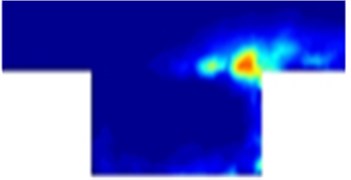
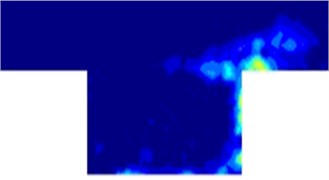
Sound source intensities in the square cavity at frequencies 50 Hz and 100 Hz were extracted, as shown in Fig. 13. It was shown in Fig. 13 that the region with large sound source intensity was around the monitoring point p3, which was consistent with vortex intensity in Fig. 5. It was mainly because that the vortex flowing to this position would hit the steps and then cause increase of sound source intensity.
Fig. 13Sound source intensity in the square cavity
a) 50 Hz
b) 100 Hz
7. Conclusions
1) Vortex situations at different positions in the square cavity were determined through unsteady numerical simulation and analysis of the flow field in the square cavity. Pressure pulsation presented a certain periodicity.
2) Through Fast Fourier Transform, time domain signals of numerical computation were transferred into frequency domain. Pressure levels in each frequency were obtained by 1/3 octave processing method. Different positions in the square cavity presented different pressure pulsation frequencies and characteristics, which were related with their vortex motions.
3) It was shown from comparisons between the experimental results and simulation results that they had a good consistency except for the frequency less than 31.5 Hz. This result showed that the computational model was feasible to research pressure pulsation caused by vortices in a square cavity. The research has provided a reference for hydro-dynamic noise control and elimination in the square cavity.
4) A numerical model for near sound field computation of the square cavity was built. Sound source intensity distributions at two frequency points were extracted. It could be found that sound source intensity was large at the rear edge steps, which was consistent with vortex intensity distribution. Therefore, the result indirectly verified reliability of the numerical model.
References
-
Geng D. H., Liu Z. X. Predicting cavity hydro-dynamic noise using a hybrid large eddy simulation-Lightill equivalent acoustic source method. Journal of Harbin Engineering University, Vol. 31, Issue 2, 2010, p. 182-187.
-
Zhu X. J., He Z. Y. Study of flow-induced standing wave resonance of rectangular cavity in water tunnel. Journal of Harbin Engineering University, Vol. 14, Issue 3, 1993, p. 41-52.
-
Char I. M., Roshko A. The effect of flow oscillations on cavity drag. Journal of Fluid Mechanics, Vol. 177, Issue 10, 1987, p. 510-530.
-
Wang M., Freund J. B., Lele S. K. Computational prediction of flow generated sound. Annual Review of Fluid Mechanics, Vol. 38, Issue 1, 2006, p. 483-512.
-
Wang C. X., Zhang T., Hou G. X. Noise prediction of submerged free jet based on theory of vortex sound. Journal of Ship Mechanics, Vol. 14, Issue 6, 2010, p. 670-677.
-
Colonius T., Basu A. J., Rowley C. W. Numerical investigation of the flow past a cavity. AIAA Paper, 1999, p. 1912-1920.
-
Shieh C. W., Morris P. J. Parallel computational areo-acoustic simulation of turbulent subsonic cavity flow. AIAA Paper, 2000, p. 1914-1929.
-
Gloerfelt X., Bogey C., Bailly C., et al. Aerodynamic noise induced by laminar and turbulent boundary layers over rectangular cavities. AIAA Paper, 2002, p. 2476-2487.
-
Larcheveque L., Sagaut P., Mary I., et al. Large-eddy simulation of compressible flow past a deep cavity. Physics of Fluids, Vol. 15, Issue 1, 2003, p. 193-211.
-
Ask J., Davidson L., Enwald H., et al. An acoustic analogy applied to incompressible flow fields. Computational Aeroacoustics: From Acoustic Sources Modeling to Far-Field Radiated Noise Prediction Colloquium EUROMECH, Chamonix, France, 2003, p. 1-4.
-
Zhu Z., Xiao J., Li J. Q., et al. Global path planning of wheeled robots using multi-objective memetic algorithms. Integrated Computer-Aided Engineering, Vol. 22, Issue 4, 2015, p. 387-404.
-
Lin Q. Z., Chen J. Y. A novel micro-population immune multiobjective optimization algorithm. Computers and Operations Research, Vol. 40, Issue 6, 2013, p. 1590-1601.
-
Wang F. J. Computational Fluid Dynamics Analysis Principle and Application of CFD Software. Tsing-hua University Publisher, Beijing, 2004, p. 116-123.
-
Chen J. Y., Lin Q. Z., Hu Q. B. Application of novel clonal algorithm in multiobjective optimization. International Journal of Information Technology and Decision Making, Vol. 9, Issue 2, 2010, p. 239-266.
-
Wong K. W., Lin Q., Chen J. Error detection in arithmetic coding with artificial markers. Computers and Mathematics with Applications, Vol. 62, Issue 1, 2011, p. 359-366.

