Abstract
This paper studied the aerodynamic characteristics of cylinder and pantograph based on large eddy simulation and the acoustic boundary element method, compared sound pressure levels of different observation points and adopted measures to reduce radiation noises. Pressure distributions on the upper and lower surfaces of the cylinder were symmetrical, and radiation noises were basically the same too. Sound pressure level in the front of the cylinder was more than that on the upper and lower surfaces of the cylinder. Sound pressure level at the back of the cylinder was the maximum. With the increase of the computational time, shedding vortexes gradually developed backwards, and the influence area was bigger. The radius of radiation sound field of the cylinder was obviously reduced after applying porous materials. Additionally, contours for noise were highly symmetrical in the whole analyzed frequency band. At 2000 Hz, the cylinder presented the obvious characteristics of dipole noise source. The aerodynamic drag and lift of pantographs through numerical computation were similar to experimental results and increased with the increase of flow velocity, which showed that the computational model for the aerodynamic characteristics of pantographs in this paper was effective. Pressure was large in the area close to the pantograph head, in the connection position between upper and lower pull rods and near the base. Long dragged airflow was formed at the pantograph head, upper and lower pull rods and at the back of the base, which had a serious influence on the distribution of aerodynamic noises of pantographs. Obvious shedding vortexes were formed in the area far away from the pantograph rather than near the pantograph. The density and strength of shedding vortexes were not large. Sound pressure levels of observation points which had the same distance from the center of pantograph base were basically the same in change trend, value and peak frequency. However, the sound pressure level of observation points around the pantograph head was obviously greater than that of other observation points when the analyzed frequency was over 1000 Hz. Radiation noises in the connection position between upper and lower pull rods were greater than that of other observation points. With the increase of the analyzed frequency, the dispersive-ness of aerodynamic noises of pantographs was increasingly obvious. The radiation noise of pantographs was mainly spread along the inclined plane of 45°. When a layer of porous materials was covered on the surface of pantographs, the influence area of radiation noises was obviously reduced. In addition, the sound pressure level of radiation noises was improved.
1. Introduction
With the increased running speed of high-speed trains, technical requirements on the running safety of high-speed trains have been improved. The pantograph-catenary current-receiving quality of high-speed trains is one of key factors influencing the running safety of high-speed trains. Pantographs are a key device of high-speed trains, which obtains electric energy from the catenary. When a train runs at a high speed, the aerodynamic characteristics of pantographs have a direct influence on current-receiving quality. The good aerodynamic characteristics of pantographs are important factors which ensure the performance and stability of pantograph catenary system, reduce pantograph-catenary model and lower aerodynamic noises [1-3]. The excessive aerodynamic noise of pantographs will seriously affect interior and surrounding environments. At present, studies on the aerodynamic noise of pantographs have been widely reported. The pantograph of high-speed trains is a very important source of aerodynamic noises. Germany, Japan and France have conducted a lot of researches on high-speed trains in order to reduce the aerodynamic noise of pantographs [4]. King [5] adopted dipole point source to describe the aerodynamic noise caused by the vortex shedding of pantographs and found that the far-field aerodynamic noise of pantographs and the logarithm of train speed approximately showed a linear relationship. Dong [6] used FLUENT fluid mechanics analysis module to establish the three-dimensional finite element simulation model of pantographs at the speed of 350 km/h and solve the surface fluctuation pressure of pantographs and noise intensity in the environment at different running speeds of the train. Noger [7] tested the aerodynamic noise source of pantographs in a low-noise wind tunnel and found that the vertical plane at the back of pantographs was a very important area of noise source. Based on theoretical research, Wang [8] adopted the hybrid method to study the aerodynamic noise characteristics around the pantograph of high-speed trains. He firstly analyzed the statistical result of high-speed trains computed by RANS method and studied the characteristics of flow field in the pantograph area of high-speed trains, then applied the nonlinear acoustic method to study near-field noises, and conducted an analysis on the contribution of different parts to aerodynamic noises. Li [9] established the three-dimensional geometric model of pantographs, simulated the flow field around the pantograph based on the principle of computational fluid dynamics and finite volume method, built a computational model for the aerodynamic noise of pantographs and used the theory of acoustic analogy to compute aerodynamic noises on the longitudinal and symmetrical plane of pantographs. However, the introduced studies only used experiments or numerical simulation method to simply study the aerodynamic noise of pantographs and failed to mention how to reduce the noise of pantographs.
With the further maturity of computer technology and experimental equipment, reducing the aerodynamic noise of pantographs has been gradually studied [10-13]. Iwamoto [14] combined theoretical research with analysis on experimental results and proposed the method of reducing the aerodynamic noise of pantographs. Ikeda [15] studied the design theory and method of reducing the aerodynamic noise of pantographs and proposed the design proposal of reducing the aerodynamic noise of pantographs through experiments and theoretical analysis. Xiao [16] adopted large eddy simulation and FW-H equation to compute the aerodynamic noise of pantograph insulator when the cross section was rectangular, round and oval, and determined the cross-section shape of optimized pantograph insulator. The optimized pantograph insulator should be oval. In addition, the long axis of the oval should be consistent with the flow direction of airflow. Increasing the size of pantographs and reducing the number of parts were conducive to reducing the aerodynamic noise of pantographs. Wang [17] applied the method of numerical simulation to cover a layer of sound absorption materials on the surface of pantographs and effectively reduced the aerodynamic noise of pantographs. However, his research was not in-depth enough.
This paper studied the aerodynamic characteristics of cylinder and pantograph based on large eddy simulation and acoustic boundary element method and effectively reduced the aerodynamic noise of pantographs through comparing the sound pressure levels of different observation points and taking measures. In addition, the numerically computational model was also verified through experiments.
2. Basic theories
2.1. Governing equations of large eddy simulation
The LES governing equation of incompressible fluid was obtained through the spatial filtering of N-S equation:
wherein, (-) represented spatial filtering; ρ stood for the density of fluid; t referred to time; ˉui and ˉuj were velocity components after filtering; μ was turbulence viscosity coefficient; τij was sub-grid scale stress (SGS stress); τij=ρ¯uiuj-ρˉuiˉuj reflected the impact of small-scale vortexes on motion equation. To close Eqs. (1) and (2), eddy viscosity model was adopted to construct the mathematical expression of τij:
2.2. Governing equations of aerodynamic noises
According to N-S equation and continuity equation, Lighthill derived the sound propagation equation [18]:
wherein, ρ stood for the disturbance quantity of fluid density; ρ'=ρ-ρ0, ρ and ρ0 were density in a disturbed and undisturbed state; Tij was Lighthill stress; Tij=ρuiuj-eij+δij(p-c20ρ), eij was viscous stress; δij was Kronecker delta symbol; c0 was sound velocity; ∇ was Hamilton operator. When unsteady flow area was at the boundary of solid wall, Curle [19] derived the solution of Eq. (5) as follows:
wherein, nj was cosine vertical to solid wall S; Pij referred to the fluctuation pressure of pantograph surface on air; ystood for the vector of sound source point; x=x1i+x2j+x3k was the vector of sound-receiving point; R=|x-y|, t was computational time.
Eq. (6) contained two types of noise sources: surface dipole item and volume quadrupole item. The former came from Lighthill stress of flow field around object. The latter was from the surface pressure and viscous shear stress of object. Dipole noise source was in direct proportion to the third power of Mach number and quadrupole source noise was in direct proportion to the square of Mach number. Therefore, the ratio of quadrupole source noise and dipole source noise was in direct proportion to the square of Mach number. The running speed of high-speed trains was high. However, its speed was lower compared with sound velocity. For instance, Mach number was only about 0.2 when high-speed trains ran at the speed of 250 km/h. Therefore, quadrupole source noise in the aerodynamic noise of pantographs of high-speed train was relatively small and could be neglected. The above analysis showed: The aerodynamic noise caused by the pantograph of running high-speed trains was mainly from dipole source around its surface and its strength and distribution characteristics determined the strength and distribution characteristics of its external radiation sound field. Turbulent flow field was composed of gradually developing vortexes of different sizes. In general, large-scale vortexes controlled flow characteristics while small-scale vortexes dissipated energy. The pressure fluctuation of different frequencies was caused due to the interaction between gradually developing vortexes of different scales and turbulence. Dipole source on the surface of pantograph was just determined by the fluctuation pressure at the boundary of the flow field. In this way, the computational formula of aerodynamic noise of pantograph could be expressed as:
wherein, p was sound pressure; p0 referred to reference sound pressure 2×10⁻⁵ Pa.
Thus, it was clear that far-field radiation noises could be computed after the distribution of fluctuation pressure on the surface of pantograph was obtained by means of large eddy simulation.
3. Numerical computation for the flow field and radiation noises of cylinder
3.1. Numerical computation for the flow field of cylinder
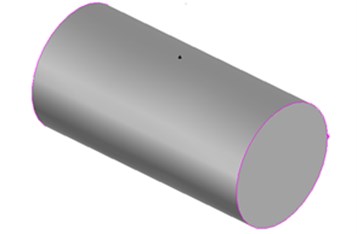
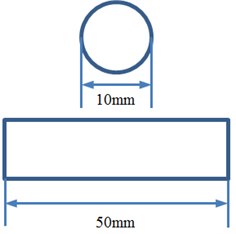
Cylinder is a fundamental part of pantograph and landing gear. Studying the turbulent flow noise of cylinder can provide reference for the noise reduction of complex engineering components. Fig. 1 presented the geometric model and related sizes of the cylinder. With a diameter of 10 mm, the cylinder was 50 mm long.
Fig. 1Geometric model and related sizes of cylinder
a) Geometric model
b) Related sizes
The accuracy of computational flow fields by CFD directly determines the accuracy of computational sound fields through acoustic software. To improve the accuracy of computational flow field and save computational time, the computational domain for the flow field of cylinder was established by adopting two methods including full domain and subdomain. The stationary method was used to compute full domain. After the convergence of results, Table data was output on the control surface of subdomain as the initial condition of the next computation of subdomain. Then, the grid of full domain was deleted and subdomain was remained. Mesh refinement was conducted for subdomain. Finally, the non-stationary method and large eddy simulation method were used to compute the physical quantity of subdomain flow field. In the case of computing the parameters of flow field, second order upward scheme was applied to disperse continuity equation and N-S equation. PESIO method was used as algorithm. According to Nyquist’s Theorem, the sample size of data sampling in the flow field was determined. Fourier transform was applied to convert the time domain data of transient pressure fluctuation computed by subdomain into frequency domain data. In the meanwhile, frequency domain data was taken as the sound source item in Virtual.Lab to compute the propagation of sound field. Fig. 2 presented the computational model for the flow field of cylinder. The model contained 102.365 elements and 120.546 nodes.
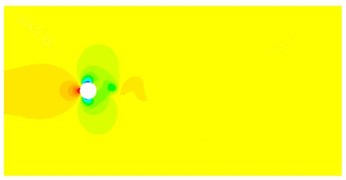
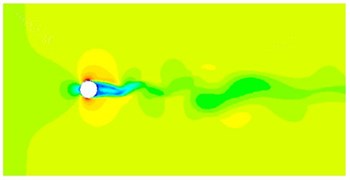
The computational model could be used to obtain the distribution characteristics of flow field of cylinder, as shown in Fig. 3. Fig. 3(a) presented the pressure distribution of cylinder. It could be seen that an area of positive pressure was formed when fluid was exposed to the surface of cylinder, forming large pressure difference. Pressure distributions around the upper and lower surfaces of cylinder were basically symmetrical. When fluid acted on the cylinder, there were some shedding vortexes at the back of the cylinder, as shown in Fig. 3(c). Then, very serious turbulence would appear at the back of the cylinder, which would cause large radiation noise. With the increase of the computational time, shedding vortexes at the back of the cylinder gradually developed backwards, affecting an increasingly bigger area.
Fig. 2Computational model for the flow field of cylinder
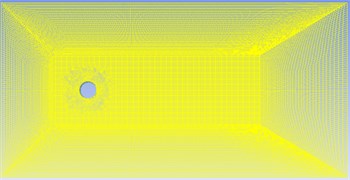
Fig. 3Distribution characteristics of flow field of cylinder
a) Pressure distribution
b) Velocity distribution

c) Vorticity distribution
3.2. Numerical computation for the radiation noise of cylinder
The surface of geometric model of cylinder in Fig. 1 was extracted to establish the boundary element model as shown in Fig. 4. The size of meshes was determined according to the requirements of computed frequency. Finally, the size of meshes was 1mm. The model contained 2.016 elements and 2.235 nodes. The computational result of flow field of cylinder was imported into Virtual.Lab to couple with the boundary element model. The computational results of the flow field were mapped to the boundary element model. In this way, the acoustic boundary element model could obtain all characteristics of the flow field through coupling. The computational frequency was 3000 Hz and step length was 20 Hz. Finally, the radiation sound field of flow field of cylinder could be obtained.
When the radiation noise of cylinder was computed, 5 observation points of noises were established, as shown in Fig. 5. Observation point 1, 2, 3 and 4 were at the upper and lower parts, in the front and at the back of the cylinder. Their distance with the center of the cylinder was the same.
Fig. 4Acoustic boundary element model of cylinder
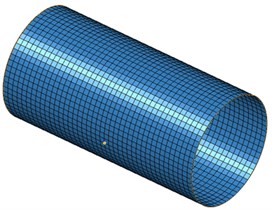
Fig. 5Observation points of radiation noises
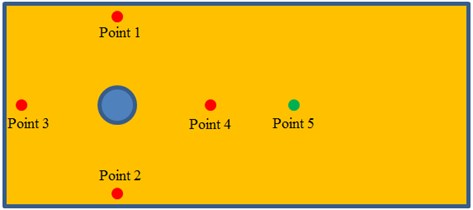
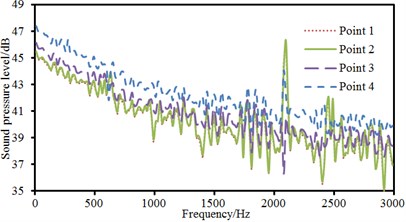
Observation point 5 was at the back of the cylinder and at the same horizontal plane with observation point 4. Sound pressure level curves of 5 observation points were extracted, as shown in Fig. 6. Fig. 6(a) presented the comparison of sound pressure levels of observation points which kept the same distance from the center of the cylinder. As shown in the figure, sound pressure levels of observation point 1 and 2 were basically the same because the cylinder was a highly symmetrical structure. The distribution of flow fields at the upper and lower parts of the cylinder was basically the same, and radiation noises were basically the same. The sound pressure level of observation point 3 was more than that of observation point 1 and 2. Fluid firstly acted on the front of the cylinder, which would form a rather high area of positive pressure and thus generate large radiation noises. The sound pressure of observation point 4 was the largest among all observation points. It was because serious shedding vortexes at the back of the cylinder caused disordered flow field and excited large radiation noises. Around 2100 Hz, sound pressure level curves of observation 1, 2 and 4 showed an obvious peak noise. The sound pressure levels of all observation points presented the trend of gradual decrease with the increase of analyzed frequency. In addition, sound pressure level curves of observation points showed many peak and valley noises when the analyzed frequency was more than 1000 Hz. Fig. 6(b) presented the comparison of sound pressure levels of observation points which kept different distances in the horizontal plane. It could be seen from the figure that the sound pressure level of observation point 4 was obviously more than that of observation point 5. The energy of shedding vortexes in the area closer to the cylinder was greater. As observation point 5 was a little further away from the cylinder, the energy of vortexes was small and simulated radiation noise was small. In addition, peak and valley noises of two observation points did not have the same frequency point. The difference value of the maximum sound pressure levels of two observation points was 7 dB and corresponding frequency was 2100 Hz.
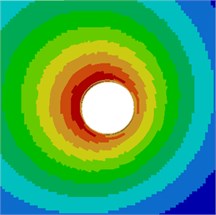
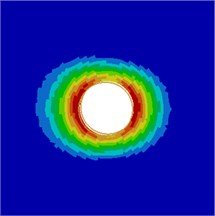
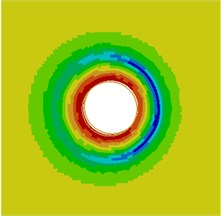
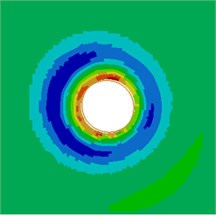
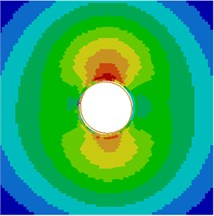
Contours for the radiation noise of the cylinder at 100 Hz, 500 Hz, 1000 Hz and 2000 Hz were extracted, as shown in Fig. 7. As shown in Fig. 7, contours for the noise of the cylinder at 100 Hz, 500 Hz and 1000 Hz were symmetrical around the horizontal plane. However, contours for the noise of the cylinder were symmetrical around the plane of 45° when the analyzed frequency was 2000 Hz. It showed that the turbulent flow of the cylinder was not totally a dipole noise source in the whole analyzed frequency band. The reported research indicated that covering a layer of sound absorption materials on the surface of the cylinder could effectively reduce radiation noises. Therefore, a layer of porous material was covered on the external surface of the cylinder and the radiation noise of the cylinder was re-computed, as shown in Fig. 8. From the comparison between Fig. 7 and Fig. 8, it could be seen that the radius of radiation sound field of the cylinder was obviously decreased after porous materials were covered. In addition, contours for noises were highly symmetrical in the whole analyzed frequency band. At 2000 Hz, the cylinder presented obvious characteristics of dipole noise source. In the area close to the cylinder, radiation noises were obviously improved. The pantograph head and pull rod of pantographs were composed of cylindrical bars. Therefore, the noise reduction method could be further applied to pantographs.
Fig. 6Comparison of radiation sound pressure levels of different observation points
a) Comparison of sound pressure levels with the same distance
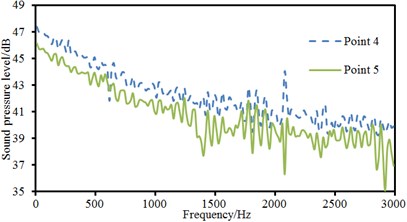
b) Comparison of sound pressure levels with different distances in the same plane
Fig. 7Contours for the radiation noise of cylinder
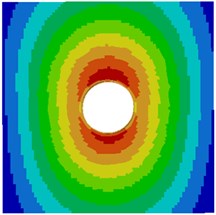
a) 100 Hz
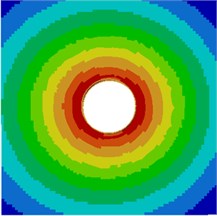
b) 500 Hz
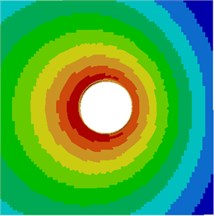
c) 1000 Hz
d) 2000 Hz
4. Numerical computation for the flow field and radiation noise of pantographs
4.1. Numerical computation and experimental verification for the flow field of pantographs
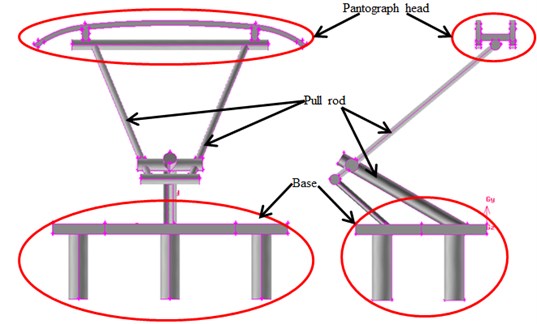
As shown in Fig. 9, pantographs were composed of pantograph head, pull rod and base. The model only considered the simplified model of main pantograph structure and ignored small parts connected on it, which could effectively and quickly establish a computational model for the flow field of pantographs. In addition, small parts would also increase the time and complexity of computation. They had smaller sizes compared with major structure. Therefore, their impact on the whole flow field of pantographs could be ignored. Additionally, pantographs were a highly symmetrical structure. To reduce the grid of computation and improve the efficiency of computation, half of the model was used for research. According to the geometric model of pantographs, a computational model for the flow field of pantographs was established, as shown in Fig. 10. The height of pantographs was D. The computational domain of the whole flow field was 14D long, 4D wide and 6D high. Restricted by the requirements of length of the paper, this paper only studied aerodynamic characteristics when the pantograph was lee. The central point of pantograph base was 5D away from the inlet, 9D away from the outlet, 2D away from both sides and 6D away from the top. The inlet was set as velocity inlet boundary; the outlet was set as pressure boundary; the ground was set as slip wall; other surfaces were set as solid walls. Computational time was 0.5 s. Time step was 0.00001 s.
Fig. 8Contours for the radiation noise of improved cylinder
a) 100 Hz
b) 500 Hz
c) 1000 Hz
d) 2000 Hz
Fig. 9Geometric model of pantographs; front view and side view
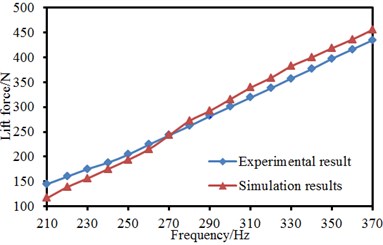
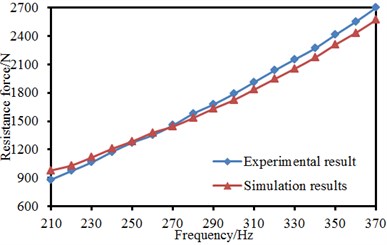
The aerodynamic lift and drag of pantographs could be obtained according to the set computation parameters. The pantograph model studied in this paper was very similar to the experimental model in reference [1]. Therefore, the computed drag and lift were compared with experimental results, as shown in Fig. 11. The aerodynamic drag and lift through numerical computation were similar to experimental results and increased with the increase of flow velocity, which showed that the computational model for the aerodynamic characteristics of pantographs in this paper was effective. The computed results of aerodynamic characteristics could be taken as the foundation of subsequent acoustic computation.
Fig. 10Computational model for the flow field of pantographs
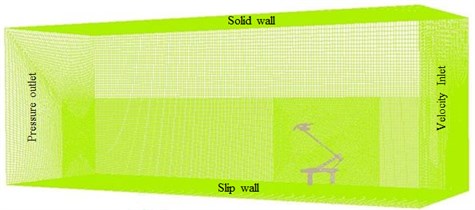
Fig. 11Comparison between experiment and simulation of aerodynamic forces of pantographs
a) Lift
b) Drag
Fig. 12Distribution characteristics of flow field of pantographs

a) Pressure distribution
b) Velocity distribution

c) Vorticity distribution
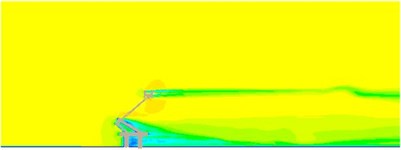
Results for the distribution of flow field of pantographs were extracted, as shown in Fig. 12. Fig. 12(a) presented the distribution of pressure field of pantographs. It could be seen that pressure was relatively large in the area close to pantograph head, in the connection position between upper and lower pull rods and near the base. Fig. 12(b) reflected long dragged airflow formed at the pantograph head and at the back of the lower pull rod and base, which would seriously affect the aerodynamic noise distribution of pantographs. Fig. 12(c) presented the vorticity distribution of pantographs. It showed that obvious shedding vortexes were formed in the area far away from the pantograph rather than near the pantograph. The density and strength of shedding vortexes were not large. Serious vortexes were formed at the pantograph base and at the back of pantograph head. However, dragged airflow was not obvious at the back of pull rod.
4.2. Numerical computation for the radiation noise of pantographs
A boundary element model was established according to the geometric model of pantographs, as shown in Fig. 13. The model mainly adopted quadrilateral meshes. The connection part used triangular meshes for transition. Finally, the model contained 2.398 elements and 2.671 nodes. A computational model for the aerodynamic noise of pantographs could be obtained through referring to the computational process of aerodynamic noises of the cylinder. In addition, 8 observation points were set around the pantograph in order to inspect the far-field radiation noise characteristics of pantographs, as shown in Fig. 14.
Fig. 13Acoustic boundary element model of pantographs
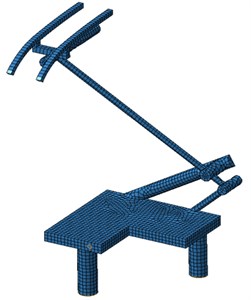
Fig. 14Observation points of radiation noises
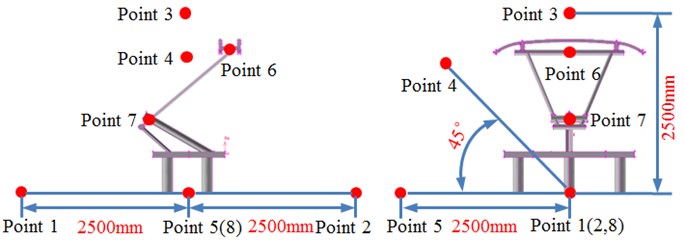
The pantograph of only half model was used as the research object. Therefore, observation pint 1, 2, 3, 4 and 5 were arranged in the front, at the back, at the left side and upper part of the pantograph and at the plane of 45°. These observation points were 2500 mm away from the base center. Observation point 6, 7 and 8 were arranged at the pantograph head, in the connection position between upper and lower pull rods and at the base center. Sound pressure levels of these observation points were extracted, as shown in Fig. 15, Fig. 15(a) presented the comparison of sound pressure levels of observation points keeping the same distance from the base center. It could be seen that sound pressure levels of 5 observation points were basically the same in change trend, numerical value and peak frequency before 1000 Hz. However, the sound pressure level of observation point 3 was obviously more than that of other observation points when the analyzed frequency was over 1000 Hz. As pantograph head was equivalently composed of double tandem cylinder. Noises excited by the flow field of double tandem cylinder would be rather obvious. Flow fields between two cylinders would interfere with each other. In addition, sound pressure level curves of 5 observation points presented an obvious peak noise around 2400 Hz. Fig. 15(b) presented the comparison of radiation noises of different parts on the pantograph. It could be seen that the radiation noise of observation point 7 was larger than that of other observation points because observation point 7 was in the connection position between upper and lower pull rods. The fluid firstly acted on this position, so the radiation noise of observation point 7 was the largest. Fig. 15(c) presented the sound pressure levels of observation points keeping different distances in the same horizontal plane. Observation point 1 and 2 were respectively in the front and at the back of pantographs. Observation point 8 was at the center of pantograph base. At observation point 1, fluid did not come into contact with the pantograph and there were only noises excited by the flow of pure fluid. At observation point 8, fluid strongly interacted with the base of pantograph, which thus generated large radiation noises. Observation point 2 was at the back of the pantographs. However, the interaction between fluid and pantograph had little impact on observation point 2 as it was far away from the base. It was equal to the noise excited by the flow of pure fluid and similar to the noise of observation point 1. Fig. 15(d) presented the comparison of sound pressure levels of different observation points in the same vertical plane. Radiation noises were small as observation point 3 was far away from the main structure of pantographs. In addition, the sound pressure level curve of observation point 8 presented more obvious peak noises within 600 Hz.
Fig. 15Comparison of sound pressure levels of different observation points
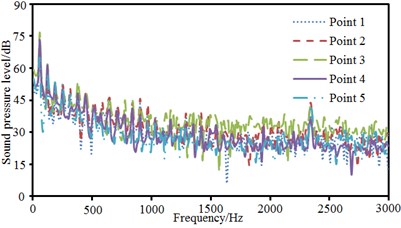
a) Comparison of SPLs of observation points with the same distance
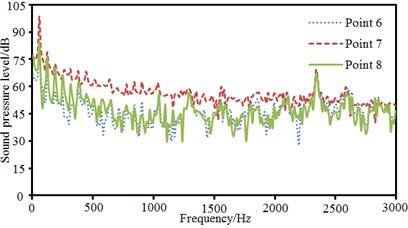
b) Comparison of SPLs of different parts of pantographs
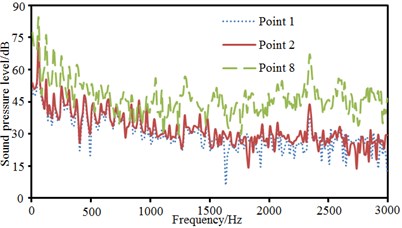
c) Comparison of SPLs in the same horizontal plane
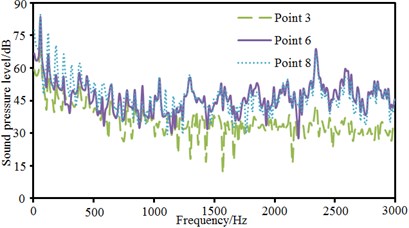
d) Comparison of SPLs in the same vertical plane
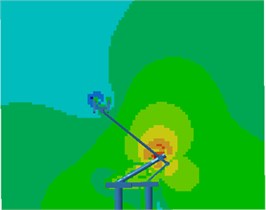
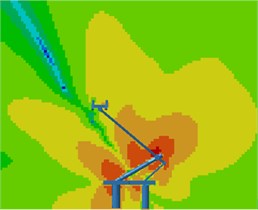
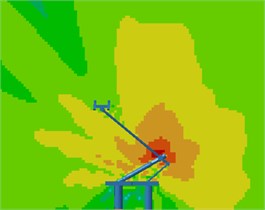
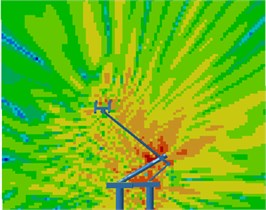
Contours for the radiation noises of the pantograph at 100 Hz, 500 Hz, 1000 Hz and 2000 Hz were extracted, as shown in Fig. 16. The dispersive-ness of aerodynamic noises of pantographs was increasingly obvious with the increase of the analyzed frequency. In addition, large radiation noises were mainly distributed at the pantograph head, in the connection position between upper and lower pull rods and near the base, which was similar to the result of flow field analysis. From contours for the distribution of noises at 500 Hz, 1000 Hz and 2000 Hz, the radiation noise of pantographs was mainly spread along the inclined plane of 45°. In the third section, it showed that covering a layer of porous materials on the surface of cylinder could effectively improve aerodynamic noise characteristics. Therefore, this noise reduction method was applied to the main structure of pantographs. A layer of porous sound absorption materials was covered on the head and pull rod of pantographs respectively to re-compute the aerodynamic noise of pantographs, as shown in Fig. 17. As shown in Fig. 16 and Fig. 17, the influence area of radiation noises was significantly decreased and the sound pressure level of radiation noises was improved after a layer of porous materials was covered on the surface of pantographs.
Fig. 16Contours for the radiation noise of pantographs
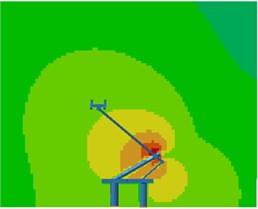
a) 100 Hz
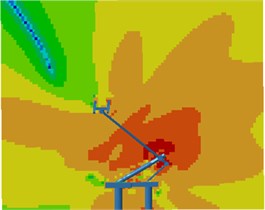
b) 500 Hz
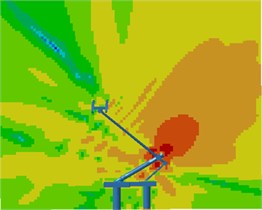
c) 1000 Hz
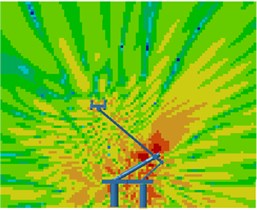
d) 2000 Hz
Fig. 17Contours for the radiation noise of improved pantographs
a) 100 Hz
b) 500 Hz
c) 1000 Hz
d) 2000 Hz
5. Conclusions
This paper studied the aerodynamic characteristics of cylinder and pantograph based on large eddy simulation and acoustic boundary element method, and obtained the following conclusions through comparing sound pressure levels of different observation points:
1) Pressure distributions on the upper and lower surfaces of the cylinder were symmetrical, and thus radiation noises were basically the same too. Sound pressure levels in the front of the cylinder were more than that on the upper and lower surfaces. Sound pressure levels at the back of the cylinder were the maximum.
2) In the same plane, the sound pressure level of observation points close to the cylinder was more than that far away from the cylinder. In addition, peak and valley noises in near and far areas had different frequency points. The difference value of maximum sound pressure levels was 7 dB, and corresponding frequency was 2100 Hz. The radius of radiation sound field of the cylinder was obviously reduced after applying porous materials. Additionally, contours for noises were highly symmetrical in the whole analyzed frequency band. At 2000 Hz, the cylinder presented the obvious characteristics of dipole noise source. In the area close to the cylinder, radiation noises were obviously improved.
3) The aerodynamic drag and lift of pantographs through numerical computation were similar to experimental results and increased with the increased flow velocity, which showed that the computational model for the aerodynamic characteristics of pantographs in this paper was effective. The computed results of aerodynamic characteristics could be taken as the foundation of the subsequent computation.
4) Pressure was large in the area close to the pantograph head, in the connection position between upper and lower pull rods and near the base. Long dragged airflow was formed at the pantograph head, upper and lower pull rods and at the back of the base, which had a serious impact on the distribution of aerodynamic noises of pantographs. Obvious shedding vortexes were formed in the area far away from the pantograph rather than near the pantograph. The density and strength of shedding vortexes were not large.
5) Sound pressure levels of observation points with the same distance from the center of pantograph base were basically the same. However, the sound pressure level of observation points around the pantograph head was obviously more than that of other observation points when the analyzed frequency was over 1000 Hz.
6) With the increase of the analyzed frequency, the dispersive-ness of aerodynamic noises of pantographs was increasingly obvious. In addition, large radiation noises were mainly distributed at the pantograph head, in the connection position between upper and lower pull rods and near the base, which was similar to the result of flow field analysis. The radiation noise of pantographs was mainly spread along the inclined plane of 45°. After a layer of porous materials was covered on the surface of pantographs, the influence area of radiation noises was obviously reduced. In addition, the sound pressure level of radiation noises was also improved.
References
-
Zhang Y. S., Jia Y., Lv L. X., Yin S. B., Lang W. D. Experimental study of high-speed train pantograph in wind tunnel. Journal of Experimental Mechanics, Vol. 29, Issue 1, 2014, p. 105-111.
-
Luo L., Zheng X., Lv Y., Hao Z. Y. Aerodynamic noise analysis of high-speed train with pantograph system. Journal of Zhejiang University (Engineering Science), Vol. 49, Issue 11, 2015, p. 2179-2185.
-
Sueki T., Ikeda M., Takaishi T., et al. Reduction of aerodynamic noise from high-speed pantograph using porous materials. Journal of Environment and Engineering, Vol. 5, Issue 3, 2010, p. 469-484.
-
Sun Y. J., Mei Y. G. Introduction of aerodynamic noise generated by foreign EMUs pantograph. Railway Locomotive and Car, Vol. 28, Issue 5, 2008, p. 32-35.
-
King W. F. A precis of development in the aeroacoustics of fast trains. Journal of Sound and Vibration, Vol. 193, Issue 1, 1996, p. 349-358.
-
Dong J. L., Shen H. M. Simulation analysis of aerodynamic noise for pantograph of high-speed train. Journal of Sichuan University of Science and Engineering (Natural Science Edition), Vol. 29, Issue 2, 2016, p. 56-60.
-
Noger C., Patrat J. C., Peube J., et al. Aeroacoustical study of the TGV pantograph recess. Journal of Sound and Vibration, Vol. 231, Issue 3, 2000, p. 563-575.
-
Wang C. Q., Xing H. Y., Zheng J. F. Simulation study on aerodynamic noise of the high-speed trains based on CAA. Journal of East China Jiaotong University, Vol. 2015, Issue 1, 2015, p. 9-16.
-
Li H., Xiao X. B., Li Z. H., Zhu M. H., Jin X. S. Preliminary investigation into aerodynamic noise of a certain type of pantograph under speed of 300 km/h. Journal of the China Railway Society, Vol. 38, Issue 9, 2016, p. 18-22.
-
Kurita T., Kikuchi Y., Yamada H., et al. Reduction of noise generated from lower part of Shinkansen cars by sound absorption. Journal of Mechanical Systems for Transportation and Logistics, Vol. 5, Issue 1, 2012, p. 1-13.
-
Siano D., Viscardi M., Donisi F., et al. Numerical modeling and experimental evaluation of a high-speed train pantograph aerodynamic noise. Computers and Mathematics in Automation and Materials Science, 2011, p. 86-92.
-
Ikeda M., Mitsumoji T., Sueki T., et al. Aerodynamic noise reduction in pantographs by shape-smoothing of the panhead and its support and by use of porous material in surface coverings. Quarterly Report of RTRI, Vol. 51, Issue 4, 2010, p. 220-226.
-
Mitsumoji T., Sueki T., Yamazaki N., et al. Aerodynamic noise reduction of a pantograph panhead by applying a flow control method. Noise and Vibration Mitigation for Rail Transportation Systems. Springer Berlin Heidelberg, 2015, p. 515-522.
-
Iwamoto K., Higashi A. Some consideration toward reducing aerodynamic noise pantograph. Japanese Railway Engineering, Vol. 122, Issue 2, 1993, p. 1-4.
-
Ikeda M., Suzuki M., Yoshida K. Study on optimization of panhead shape possessing low noise and stable aerodynamic characteristics. Quarterly Report of Railway Technical Research Institute, Vol. 47, Issue 2, 2006, p. 72-77.
-
Xiao Y. G., Shi Y. Aerodynamic noise calculation and shape optimization of high-speed train. Journal of Railway Science and Engineering, Vol. 9, Issue 6, 2012, p. 72-76.
-
Wang Y. H. Numerical computation and optimization design of pantograph aerodynamic noise. Journal of Vibroengineering, Vol. 18, Issue 2, 2016, p. 1358-1369.
-
Lighthill M. J. On sound generated aerodynamically: I. General theory. Proceedings of the Royal Society of London, Vol. 211, Issue 1107, 1952, p. 564-587.
-
Curle N. The influence of solid boundaries upon aerodynamic sound. Proceedings of the Royal Society of London, Vol. 231, Issue 1187, 1955, p. 505-514.

