Abstract
Overall sound pressure levels of the driver’ right ear were tested and compared with the second and fourth order sound pressure levels. As shown from the result, the roar at 1400 rpm is mainly caused by the excessive noise which is from the second order. In order to verify this opinion, an anechoic box was located at the end of a special vehicle and the corresponding noise was then tested, which was compared with the previous results. It is indicated that the peak noise at 1400 rpm has been significantly improved after installing the anechoic box, which further shows that the roar at this position is mainly caused by sound deadening capacity of the exhaust system at low frequency. Then, the finite element method was applied to compute transmission loss of mufflers, which was compared with the experimental results. They are consistent with each other, and this shows that the numerical model for computing transmission loss is reliable and can be used for the subsequent analysis. Based on the original muffler, its structure was optimized by the improved genetic algorithm. The verified model was then adopted to compute transmission loss of the optimized mufflers, whose results were also compared with the original results. As shown from the results, transmission loss of the optimized structure has been significantly increased. In order to verify the actual effects of the optimization scheme, the samples were produced for the actual experiments, whose result was compared with the original value. The peak noises at both the driver’s right ear and the exhaust tailpipe have been significantly improved, indicating that the proposed optimization in the paper is real and effective.
1. Introduction
The increasingly serious emissions and noise pollution have been brought about from the rapid development of the vehicle industry, and mandatory standards related to the vehicle noise have been made in many countries. There were many noise sources in a vehicle, including cooling system noises, engine noises, body vibration noises, aerodynamic noises, and drive system noises. According to a lot of experiments, the noise of the vehicle was mainly affected by engine noises and exhaust noises. However, the engine noise was affected by many factors, whose optimization was very difficult. In contrast, the design of the low-noise muffler and the reduction of exhaust noises were an economic and effective method.
Micro-perforated pipe mufflers based on sound absorption theory of the micro-perforated plate [1-3], was proposed for duct sound elimination. Due to its good acoustic performance [4], it has been widely used in various fields [5-10]. The performance of perforated pipe mufflers was studied and the optimization design was conducted by Lu based on the finite element method [11]. In consideration of coupling between the perforated pipe muffler and engines, Zhong has researched the optimization design method of the muffler [12]. By means of FEM (Finite Element Method), Ross [13] has simulated the acoustic system of perforated plates and calculated transmission loss of the simple perforation. His computational results presented a good consistency with the experimental result in low frequency but large deviations in med-high frequency. Ji [14] has proposed a multi-domain BEM to predict the noise elimination performance of the three-way perforated pipe muffler, whose numerical prediction results were consistent with the experimental result. By applying one-dimensional analytical method and three-dimensional sub-structure BEM, Ji [15] has predicted the sound elimination performance of the straight-through pipe muffler, indicating the effective frequency range of one-dimensional theory. Besides, the impact of the perforation rate and geometric parameters on the acoustic characteristics of perforated light mufflers was also studied by him.
However, the perforated muffler studied was mainly targeted at mid-high frequency noise over 100 Hz, while low frequency noises below 100 Hz was difficult to be eliminated. In order to eliminate noises less than 100 Hz, there are two ways. One way is to increase the volume of the exhaust system, and the other is to change the internal structure of the muffler and improve the sound deadening capacity at low frequency when muffler volume is the same. Due to the limited space of the vehicle chassis, the increase of the exhaust system volume is difficult to be implemented in practice. Therefore, the internal structure of exhaust system is changed to increase the low-frequency sound deadening capacity when the exhaust system volume is unchanged.
2. Roar diagnosis of the exhaust system for a special vehicle
Taking a special vehicle as an example, the subjective assessment was conducted. The experimental results showed that the significant roar was in the second gear acceleration and the rotational speed was around 1400 rpm. The vehicle was tested at the second gear and full throttle acceleration. As shown in Fig. 1, microphones were placed in right ears of the driver and copilot in front of the vehicle. As found from the result, the sound pressure levels (SPL) at the right ear of the driver have a significant peak value at 1400 rpm, while the right ear of the copilot does not. To solve this problem, the second and fourth order sound pressure curves at the driver were extracted, and the corresponding results were then compared with those of overall, as shown in Fig. 2.
Fig. 1Microphone positions for testing the interior noise
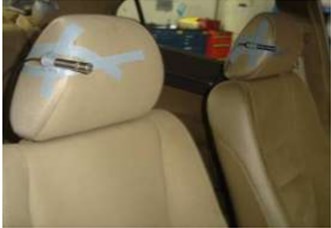
Fig. 2Sound pressure level curves of the driver’s right ear
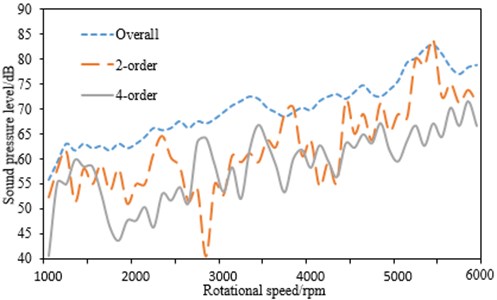
As can be seen from Fig. 2, the roar is at 1400 rpm and it is mainly caused by the second order. The second order noise is mainly from the engine muffler [11]. Therefore, mufflers are necessary to be studied. In addition, the interior noise is also big at about 5500 rpm. However, the engine of the vehicle cannot achieve such a high speed under normal driving, which can be ignored.
2.1. Experiments of the exhaust tailpipe noise
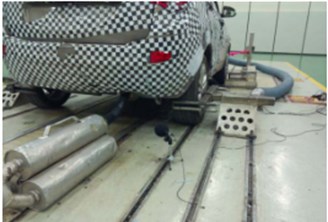
To further verify the effect of the exhaust muffler on the interior noise, the interior contribution experiment was conducted at the semi-anechoic chamber for the exhaust tailpipe noise of a special vehicle. As shown in Fig. 3, the vehicle was fixed on the rotating hub. The right ear of the driver was placed a microphone, and another microphone was arranged at the 50 cm straightly away from the tailpipe and 45 degrees with the axis of the tailpipe.
The experiment was conducted under the second gear and full throttle to collect data between 1000 rpm-6000 rpm. Firstly, the experiment with the original state was conducted, and then the anechoic box was connected to the tailpipe for experiment again, while the microphone position at the tailpipe remained unchanged.
Fig. 3Field test of automobiles with rotating hub
2.2. Analysis of the experimental data
The data obtained by experiments was then processed, whose results were shown in Fig. 4.
As shown in Fig. 4, the roar at 1400 rpm is effectively solved after connecting anechoic box to the tailpipe, indicating that such problem in the vehicle is indeed caused by the irrational structure of mufflers. Therefore, it is necessary to conduct optimization design for the muffler. If only by means of experiments, the design period of mufflers will be lengthened and its cost will be also increased. Therefore, three-dimensional FEM is attempted in the paper for the optimization design of the muffler.
3. Basic theories
3.1. Three-dimensional FEM
Considering two media including air and sound absorption holes, the perforated pipe muffler is divided into two regions and . And the boundary is split into the inlet, outlet, rigid wall and perforated wall, which are represented by , , and , respectively. In all regions, the three-dimensional sound propagation governing equation is Helmholtz equation, as follows.
The following formula can be obtained in the region :
Similarly, the following formula can also be obtained in the region :
wherein, , , and are sound pressures and wave number of air and sound absorption media, respectively.
Fig. 4Noise comparisons before and after connecting anechoic box
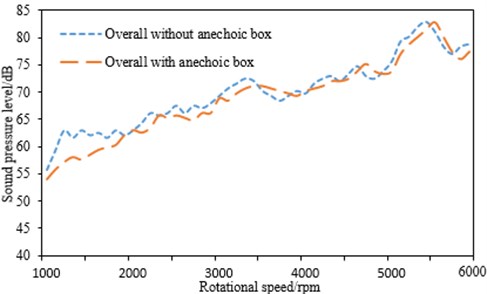
a) Overall SPL before and after connecting anechoic box
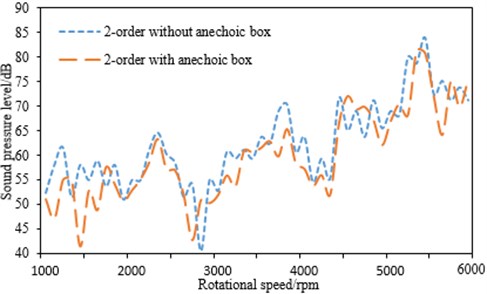
b) The second order state before and after connecting anechoic box
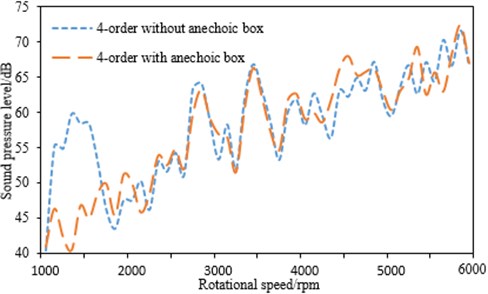
c) The fourth order state before and after connecting anechoic box
The boundary conditions of the sound field computation for mufflers are as follows.
1) The outer surface of mufflers is a rigid wall, whose normal velocity is 0. Therefore, the following equation can be obtained:
2) The inlet of mufflers is defined as the particle velocity boundary condition, which is set here. Therefore, the following equation can be obtained:
3) The outlet of mufflers is set to be full absorption as follows:
4) By means of the acoustic impedance contact of the perforated performances, the vibration velocity and pressure jumping of the normal particle at and of the perforated wall areas shown below:
is the perforated acoustic impedance, and are sound pressures at one side of air and sound-absorbing material in the perforated wall.
The finite element equation is as follows:
wherein:
where is the column vector of the real function.
The sound pressure at each node can be obtained by solving Eq. (7). As a result, transmission loss of the muffler can be computed.
3.2. Transmission loss
Transmission loss is defined as difference between the incident sound power levels at the inlet and transmission sound power levels at the outlet, which can be expressed as follows:
wherein, and are sound pressure and particle velocity at the inlet, respectively. is the sound pressure at the outlet. When the particle velocity and particle velocity at the inlet are given, FEM can be applied to compute sound pressures and at the inlet and outlet. Then, transmission loss of the muffler can be obtained by substituting them into Eq. (16).
4. Numerical computation and experimental verification of transmission loss
4.1. Numerical computation of transmission loss
As can be seen from Fig. 5, the muffler is a three-chamber structure and the intake pipe terminal is close. The airflow is ejected from the small hole, transmitted into the second chamber (which is filled with silencer foam) through the perforated plate, then goes into the first chamber through the perforated pipe again. According to the structure of the exhaust system, it was obtained that this muffler cannot reduce the noise at the low frequency, and the increase of the volume of the exhaust system is the most convenient and effective way to improve sound deadening capacity at the low frequency. However, the improvement of the exhaust system volume cannot be achieved due to the limited chassis space. Therefore, the increase of sound deadening capacity at the low frequency can only be realized by adjusting the internal structure of the exhaust system.
Fig. 5The internal structure of mufflers
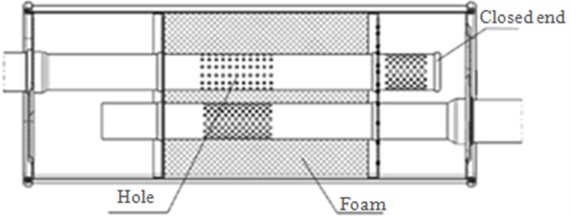
Fig. 6FEM of muffler meshes

Fig. 7FEM perspective model of muffler meshes

Firstly, the geometrical model of the muffler was imported into HYPERMESH. Then, geometry cleanup was conducted for the fillets and small holes of the muffler to improve the quality of the mesh and improve the computational accuracy. The muffler structure was divided into meshes by using tetrahedron elements, and the element size was 3 mm. The internal baffle plates were connected with the chambers by the co-nodes. The internal air was processed using the tetrahedron elements, and the air was connected with the muffler structure also by the co-nodes. For the middle chamber as shown in Fig. 5 in the paper, silencer foam was filled between the perforated pipe and the external structure of the muffler, and it could be also simulated by using the co-nodes. The final mesh model of the muffler was shown in Fig. 6, and it contained 68958 elements and 78539 nodes. The muffler was made of steel. Its elastic modulus was 210 GPa. Density was 7800 kg/m3 and Poisson’s ratio was 0.3. The sound velocity in the internal air was 340 m/s, and the internal air density was 1.225 kg/m3. Fig. 7 showed the transparent version of the mesh model for the muffler, and it can be seen that the muffler had three chambers and two baffle plates.
Fig. 8The path of sound transmission in the muffler
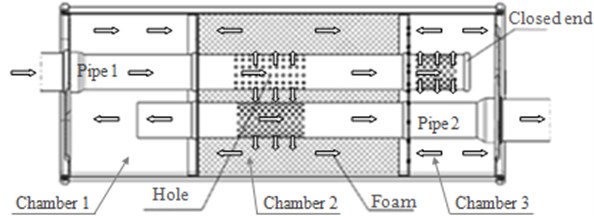
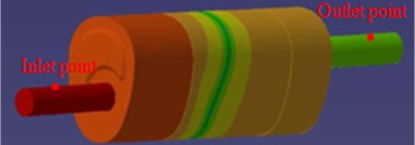
The path of noise propagation inside the muffler was shown in Fig. 8. This muffler had three chambers. The sound firstly went from Pipe 1 into the muffler. After that, part of the sound was transmitted to Pipe 2 and Chamber 2 through the small holes in Pipe1, and other sound was directly transmitted to Chamber 3 through the small holes at the end of Pipe1. Since Chamber 3 was closed, the sound will travel inside it and gradually be dissipated. Through the small holes in Pipe1 and Pipe 2, the sound will go into Chamber 2, and it will be quickly absorbed by silencer foam within this chamber. Part of the sound inside Pipe 2 will enter into Chamber 1 which was also a closed structure, and the sound will then travel within this chamber and gradually be dissipated. In addition, some of the sound from Pipe 2 will directly travel into the surrounding environment. The finite element model of the muffler was built based on the geometric structure, and the internal pipes and holes will be included in the finite element model. Therefore, the finite element model was then imported into the acoustic processing software Virtual.lab, and the material properties were set. Meanwhile, the mesh was preprocessed to get the surface envelope mesh of the muffler, which was used as the acoustics mesh. And the properties of the structural material and the air were then defined. The holes in the two pipes were simulated using admittance, in order to improve the computational efficiency and precision. Then, an excitation was applied to the inlet of Pipe 1 in the finite element model, and two field points were set 50 mm away from the inlet and the outlet, respectively, as shown in Fig. 9. And then, the acoustic characteristics of the muffler were calculated, and the sound pressure contour for the muffler surface was extracted, as shown in Fig. 9. Moreover, the sound pressure level curves for two field points can be extracted, and the sound pressures in the inlet and the outlet were processed to obtain transmission loss of the muffler, as shown in Fig. 10.
Fig. 9The sound pressure contour of the muffler surface
4.2. Experimental verification of transmission loss
As can be seen from Fig. 7, it was known that the internal structure of mufflers was very complex. Therefore, it was necessary to verify transmission loss computed by FEM.
There were two mufflers in front and rear of the vehicle as shown in Fig. 11, which were connected through straight pipe. Then, a speaker was set at one end as the sound source. In addition, both the inlet and outlet studied in this paper were placed a sensor. Finally, MATLAB program was applied for processing sound pressures in the inlet and outlet. Finally, transmission loss of mufflers was obtained and compared with the computational result, as shown in Fig. 12.
Fig. 10Transmission loss curve of mufflers
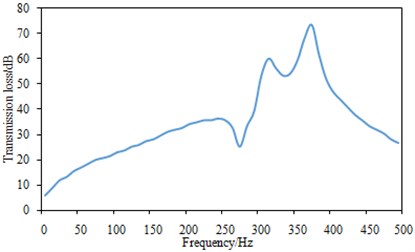
Fig. 11Transmission loss experiment of mufflers
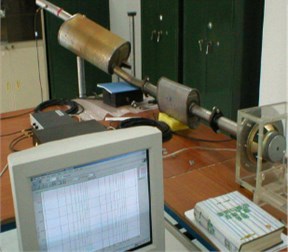
Fig. 12Comparisons between experimental and simulation for transmission loss
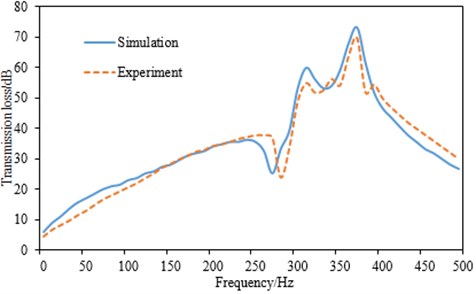
As can be seen from Fig. 12, the experimental and simulation results of transmission loss are differed little, with the maximum difference no more than 5 dB. It is indicated that the computational model in this paper is reliable and can be used for the subsequent optimization analysis.
Transmission loss of the muffler was relatively smooth in Fig. 12, and it was normal. There were indeed a lot of peaks and valley values in transmission loss for the general structures such as the dash panel, the cylinder head cover and other thin-wall parts. And the main reasons were as follows. On the one hand, their structural modals were dense. On the other hand, their structural vibration can excite radiation noises easily. For the muffler studied in the paper, however, the transmission loss curves were relatively smooth, and the corresponding reasons can be obtained from the following points. Firstly, the muffler had multiple resonant chambers, and when sound entered into the resonant chambers, it will lose most of its energy and can hardly go out. As a result, the vibration radiation noises caused by a lot of structural modals cannot be presented. Secondly, only low-frequency noises (below 500 Hz) were studied in this paper, and the quantity of modals for low frequencies was relatively small, so the corresponding transmission loss curves appeared smooth. Actually, transmission loss curves for mufflers in the published papers were also very smooth. For example, by adopting the modal meshing approach, Wu studied transmission loss of the cylindrical expansion-chamber muffler [16]. When the analyzed frequency was below 500 Hz, transmission loss curve was very smooth. Wu also found that the length/diameter ratio of the muffler’s expansion chamber affected the fluctuation level of transmission loss at mid-high frequency, but did not have significant influence on the shape of the low-frequency noises. Chiu conducted experimental and theoretical studies for transmission loss of the multi-chamber muffler [17]. When the analyzed frequency was below 500 Hz, transmission loss curve was also very smooth. Based on the computation fluid dynamics, Middelberg analyzed transmission loss of the muffler with multiple expansion chambers [18], and compared the computational results with the experimental results. The curves for both the experimental results and the numerical results were very smooth. Therefore, transmission loss of the muffler in this paper was also reasonable, and the curves haven’t been processed by any instrument.
5. The structural optimization design of mufflers
As analyzed from the experimental data and transmission loss, the roar is mainly caused by the insufficient sound deadening capacity of the exhaust system at low frequency, and especially the second and fourth order radiation noises at tailpipe are higher. Based on the original mufflers, the structure was improved to solve the above problems.
There were two improvements for mufflers. Firstly, the muffler structure was changed from three chambers to four chambers, and a low frequency resonator was designed by using the fourth chamber. The internal structure of the improved muffler was presented in Fig. 13, and 2, 3 and 4 baffle plates were shown in Fig. 14. Three internal baffle plates were set from front to back inside the muffler, and the internal was divided into four chambers including 9, 10, 11 and 12, respectively from left to right. The front end of mufflers was provided with the inlet pipe 6, and the rear end was arranged the outlet pipe 7. The insert pipe 8 was fixed on baffle plate 2, 3 and 4 by spot welding. The front end of the pipe was connected to the chamber 9, while the rear end was connected to the chamber 12. As a sealed chamber, the chamber 12 and the insert pipe 8 form a low frequency resonator chamber.
Fig. 13Internal structure of the improved muffler
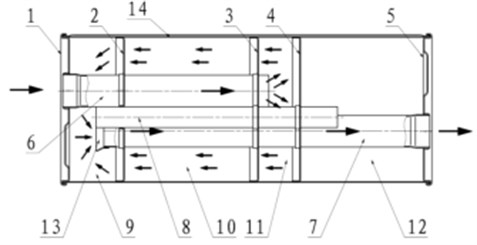
Fig. 14Sectional view of the baffle plate
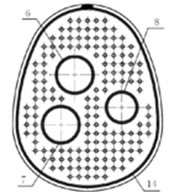
a) Baffle plate 2 and 3
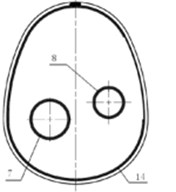
b) Baffle plate 4
Some parameters of the improved muffler cannot be the optimal. As a result, transmission loss of the improved muffler may be not the biggest, so the parameter of the improved muffler should be further optimized.
Transmission loss was one of the important indexes for evaluating the performance of a muffler, and the requirement for light-weight should be also taken into account in the structural design. Therefore, in this paper, the maximization of average transmission loss and the minimization of mass were regarded as the optimization objective of the muffler. The selected optimization variables were as follows: the radius of the inlet pipe, the radius of the middle pipe, the radius of the outlet pipe, the radius of the expansion chamber, the length of Chamber 9, the length of Chamber 10, the length of Chamber 11, and the length of Chamber 12. During the optimization process, it should be made sure that the overall external size of the muffler was not increased, or else the muffler could not be installed to the bottom of the vehicle. Therefore, avoiding the increase of the overall external size for the muffler was regarded as the constraint. The mathematical expression of the optimization was shown as follows:
In Eq. (17), is the total mass of the muffler. is the average transmission loss of the muffler.
Fig. 15The flow of the improved genetic algorithm
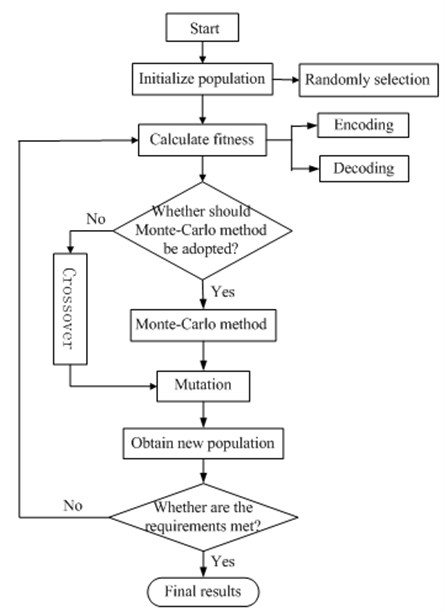
Based on the above analysis, it can be concluded that the optimization of mufflers was a complex problem including multiple targets and multiple variables. And genetic algorithm has been widely applied to solve multi-target optimization. Therefore, genetic algorithm was chosen for optimizing the structure of the muffler in this paper. According to a lot of published paper, the traditional genetic algorithm can easily obtain the locally optimal solution in the search process. That was to say, it will lead to premature convergence and quickly reach 90 % of the optimal solution. To avoid the locally optimal solution, it was necessary to expand the search space and increase the diversity of the population.
The random trial method, also called Monte Carlo method, and it will use relatively less memory, and have good statistical properties. In the paper, while maintaining the crossover rate and mutation rate, the random trial method was adopted to prevent local convergence. In other words, when none change occurred to the optimal individuals in continuous generations, it showed that the algorithm has encountered local extremum, and some measures should be taken to solve this problem. When the above problem happened, random trial operations should be performed on the population, and a large disturbance should be applied to the evolving population, so that the algorithm can get rid of the locally optimal points and start a new search. The specific operations were as follows: to retain only the optimal values and to regenerate the rest of the individuals. The purpose of the random trial operations was to get rid of the slow evolution status as quickly as possible and start a new search, rather than to degenerate the population. The flow of the improved genetic algorithm that has included the random trial method was shown in Fig. 15. In the optimization process, the initial population was 50, the crossover rate was 0.95, and the mutation rate was 0.05. How the fitness value of the genetic algorithm changes with the number of the evolutionary generations has been shown in Fig. 16.
Fig. 16The fitness value change with the evolutionary generation
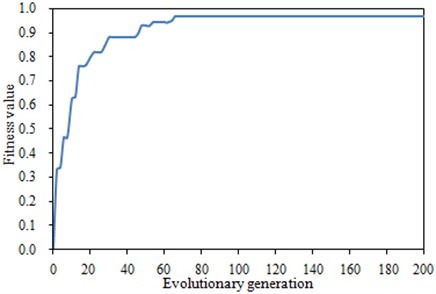
Fig. 17Comparisons of transmission loss before and after optimization
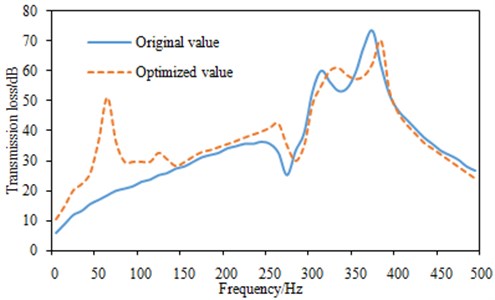
According to Fig. 16, the objective function could have stable values after nearly 80 generations. The structural parameters of the optimized muffler were shown in Table 1. According to Table 1, the total mass of the muffler was decreased by 0.9 kg and the average transmission loss was increased by 3.2 dB, which presented an obvious optimization effect. Based on these parameters, the muffler was re-modeled, thus the four-chamber muffler structure in Fig. 13 in the paper was obtained. Then, the finite element method was used to compute transmission loss of the muffler, and the computational values were compared with those of the original structure, as shown in Fig. 17.
Fig. 18Sound pressure level comparisons of driver’s right ear before and after optimization
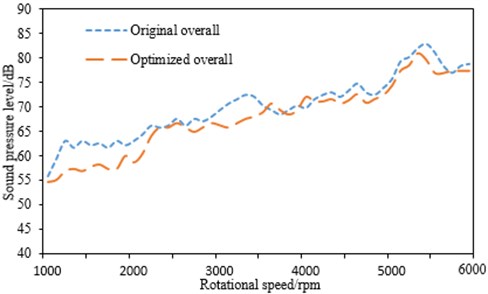
a) Sound pressure levels under overall before and after optimization
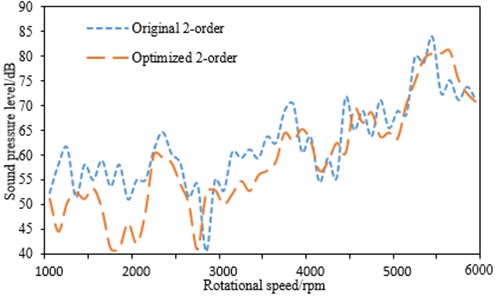
b) Sound pressure levels under the second-order before and after optimization
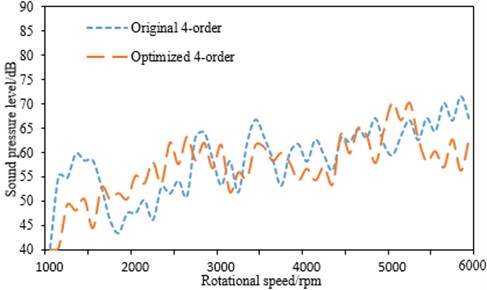
c) Sound pressure levels under the fourth-order before and after optimization
As can be seen from Fig. 17, transmission loss of the optimized muffler is dramatically increased at low frequency. To further verify the actual effect of the optimized muffler, the sample was produced. After subjective evaluation, the roar of the exhaust muffler was disappeared at 1400rpm, and the vehicle experiment was also conducted in a semi-anechoic chamber, which was compared with the original result. In Fig. 18, sound pressures of the driver’s right ear under the second gear and full-throttle acceleration were compared before and after optimization. In Fig. 19, sound pressures of the tailpipe positions under the second gear and full-throttle acceleration were also compared before and after optimization.
As can be seen from Fig. 18, SPL (Sound Pressure Level) at the driver’s ear has been significantly improved around 1400 rpm, and the roar is disappeared. In addition, it is found from Fig. 19 that the radiation noise at the exhaust tailpipe position is reduced by 3 dB-7 dB at 1000 rpm-2000 rpm, the second-order noise is decreased by 5 dB-12 dB at 1200 rpm-2350 rpm, and the fourth-order noise is reduced by 3 dB-7 dB at 1000 rpm-1500 rpm. It is indicated from these results that the optimized muffler in this paper is feasible.
Fig. 19Sound pressure level comparisons of tailpipe positions before and after optimization
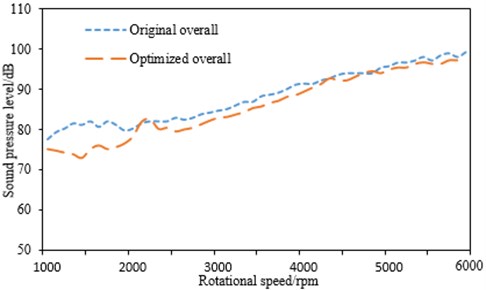
a) Sound pressure levels under overall before and after optimization
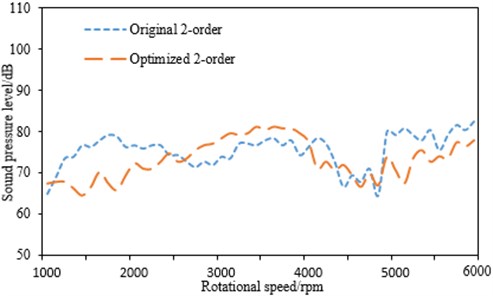
b) Sound pressure levels under the second-order before and after optimization
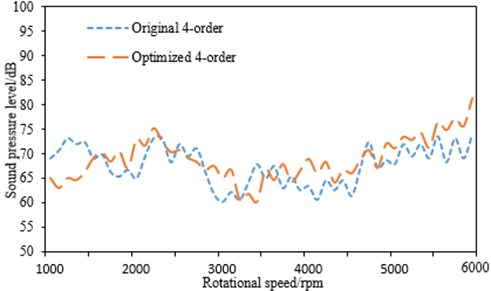
c) Sound pressure levels under the fourth-order before and after optimization
Table 1Comparisons for all parameters before and after the optimization
Variables | Original | Optimized |
Inlet pipe radius / mm | 30 | 28 |
Middle pipe radius / mm | 20 | 13 |
Outlet pipe radius / mm | 30 | 27 |
Expansion chamber radius / mm | 98 | 85 |
Length of chamber 1 / mm | 75 | 50 |
Length of chamber 2 / mm | 75 | 92 |
Length of chamber 3 / mm | 75 | 41 |
Length of chamber 4 / mm | 75 | 85 |
Total length / mm | 300 | 268 |
Total mass / kg | 5.2 | 4.3 |
Average transmission loss / dB | 39.1 | 42.3 |
6. Conclusions
1) Overall SPL of the driver’ right ear is tested and compared with the second and fourth order SPL. As shown from the result, the roar at 1400 rpm is mainly caused by the excessive noise which is from the second order.
2) The anechoic box is placed at the end of the vehicle tailpipe and the corresponding noise is then tested, which is compared with the previous results. It is indicated that after installing the anechoic box, the peak noise at 1400 rpm has been significantly improved, which further shows that the roar at this position is caused by sound deadening capacity of the exhaust system at low frequency.
3) FEM is applied to compute transmission loss of mufflers, whose results are compared with the experimental result. They are consistent with each other, and this shows that the numerical model of transmission loss is reliable and can be used for the subsequent analysis.
4) Based on the original muffler, its structure is improved, but the parameters of the improved muffler cannot be the optimal. As a result, the improved genetic algorithm is adopted to optimize the improved structure. The computational model is then adopted to compute transmission loss of mufflers, whose results are finally compared with the original results. As shown from the results, transmission loss of the optimized structure has been significantly increased.
5) In order to verify the actual effects of the optimized structure, the samples are produced for the actual experiments, whose result is then compared with the original value. The peak noises at both the driver’s right ear and the exhaust tailpipe have been significantly improved, indicating that the proposed optimization in the paper is real and effective.
References
-
Ma D. Y. Theory and design of micro-perforated panel absorber. Science China, Vol. 18, Issue 1, 1975, p. 38-50.
-
Ma D. Y. General theory and design of micro-perforated panel absorber. Acta Acustica, Vol. 22, Issue 5, 1997, p. 385-393.
-
Ma D. Y. Design of micro-perforated panel constructions. Acta Acustica, Vol. 13, Issue 3, 1988, p. 174-180.
-
Zhang X. D., Du J., Ou Y. H. Experimental study on aerodynamic and acoustic performances of mufflers at different air flow speeds. Noise and Vibration Control, Vol. 28, Issue 4, 2008, p. 141-144.
-
Wang Z. X., Qiao W. Y., Li W. L. Application of micro-porous to reducing exhaust noise of APU on MA60 aircraft. Journal of Aerospace Power, Vol. 18, Issue 3, 2003, p. 331-335.
-
Zheng L. X., Li N., Yan C. J. Investigation on noise elimination nozzle with micro-perforated panel in pulse detonation engine. Noise and Vibration Control, Vol. 29, Issue 1, 2009, p. 117-121.
-
Lin L. Y., Sun K., Xiao Q. S. Test and experiment of a micro-punched plate muffler. Journal of HV and AC, Vol. 39, Issue 1, 2009, p. 15-19.
-
Zhang L. Q., Hou H., Yang J. H. Noise control of a range hood by a guide flow dome with micro-perforation. Mechanical Science and Technology for Aerospace Engineering, Vol. 29, Issue 8, 2010, p. 1021-1024.
-
Hou X. J., Tian C. C., Liu Z. E. Design and test of a double layer micro-punch plate muffler. Mechanical Science and Technology for Aerospace Engineering, Vol. 29, Issue 8, 2010, p. 1094-1096.
-
Xiang L. Y., Zuo S. G., Zhang M. H. Study of micro-perforated tube mufflers with adjustable transmission loss. The Journal of the Acoustical Society of America, Vol. 134, Issue 5, 2013, p. 4217-4217.
-
Lu S. L., Liu H. G. Numerical calculation and analysis of engine muffler with 3-D FEM. Transactions of CSICE, Vol. 21, Issue 5, 2003, p. 346-350.
-
Zhong S. H., Jin G. D., Zhang X. G. Research on optimization design of muffler and its performance simulation method. Chinese Internal Combustion Engine Engineering, Vol. 26, Issue 1, 2005, p. 55-60.
-
Ross D. E. A finite element analysis of perforated component acoustic systems. Journal of Sound and Vibration, Vol. 79, 1981, p. 133-143.
-
Ji Z. I., Selamet A. Boundary element analysis of three pass perforated duct mufflers. Noise Control Engineering Journal, Vol. 48, Issue 5, 2000, p. 151-156.
-
Ji Z. L. Acoustic attenuation performance calculation and analysis of straight-through perforated tube silencers. Journal of Harbin Engineering University, Vol. 26, Issue 3, 2005, p. 302-306.
-
Wu C. J., Wang X. J., Tang H. B. Transmission loss prediction on a single-inlet/double-outlet cylindrical expansion-chamber muffler by using the modal meshing approach. Applied Acoustics, Vol. 69, Issue 2, 2008, p. 173-178.
-
Chiu M. C. Shape optimization of multi-chamber mufflers with plug-inlet tube on a venting process by genetic algorithm. Applied Acoustics, Vol. 71, Issue 6, 2010, p. 495-505.
-
Middelberg J. M., Barber T. J., Leong S. S., et al. Computational fluid dynamics analysis of the acoustic performance of various simple expansion chamber mufflers. Proceedings of Acoustics, 2004, p. 123-127.
About this article
This project was supported by Science Research Project of High Education Institutions in Gansu Province (2014A-038), Natural Science Foundation of Gansu Province (1212RJYA010), and the Young Teacher Training Plan of Lanzhou University of Technology (2014-15).
