Abstract
Two major challenges with existing multi-hop WSNs used for structural health monitoring (SHM) are how to increase the data transmission rate (DTR) for large amounts of sampling data and enlarge the data transmission range without degrading link quality. To handle these issues, this paper proposes a new design method of a multi-hop WSN with multi-radio sink node (M-RSN) and double-radio relay node (D-RRN) which can increase the data transfer ability at the sink and extend the monitoring distance without degrading wireless link quality. Additionally, a tight scheduled approach and multi-radio time synchronization method are designed for the stable implementation of the proposed network. To evaluate the effectiveness and robustness of the proposed network designing method, experiments in outdoor environment and for aircraft composite wing boxes monitoring are carried out. The evaluation results have shown the advantages of the proposed methods.
1. Introduction
Structural health monitoring (SHM) based on wireless Sensor Network (WSN) has been considered as an active area in recent years. In comparison with traditional cable-based monitoring systems, WSN-based monitoring systems have advantages of less weight, low-cost manufacturing, distributed operation and more convenient deployment. These advantages make WSN-based monitoring systems more adoptable for many applications [1-4], particularly for SHM area [5-10]. The researches performed so far include various nodes design [5-6], WSN based SHM systems design and their evaluations on different structures [7-10].
However, the implementation of WSN-based SHM monitoring system still meets challenges with improving the data transmission rate (DTR) for large amount of data collection and the reliable communication quality at long data transmission range. High DTR is required in many applied scenarios of WSNs in SHM areas [11-15]. Pakzad et al. reported the application of monitoring the Golden Gate Bridge deployed by a WSN which consists of 64 accelerometers [13]. In the research, the full network produced 20 MB of data and took about 9 hours to transfer the data after a complete cycle of sampling and data collection. Another example was the structure acceleration monitoring at 50 Hz requested in Jindo bridge project [14]. The sensing time lasted for 17 minutes and the sampling data of acceleration at each node was 60 KB. When 70 sensor nodes were deployed on bridge, the whole network generated nearly 4 MB data in 17 minutes. In these researches, the transmission of sensor data cost long transfer time due to the low DTR of WSN.
In WSNs, data from each cluster of sensor nodes are finally received by the sink node. The sink node transfers these data to computer which processes the data more efficiently. Hence, the ability of the sink node plays a significant role in improving DTR of WSNs. Some literatures have reported the improvement of DTR in WSNs by using high-performance sink node [16-20]. Simulations have indicated that multi-channel communication in sink node can improve the DTR by transferring data in different communication channels [21-23]. However, many multi-channel assignments for WSNs are based on the sink node which contains only one radio module. Adya et al. discussed this problem and pointed out that the DTR in network is still limited because the sink node with single radio has to be constantly switched to different channels [22]. Bahl et al. investigated that multi-radio platform can contribute to data capacity improvement in WSNs [24]. Kohvakka et al. [16] and the authors’ group [20] presented the developments of multi-radio sink nodes for IEEE 802.11 and IEEE 805.15.4 respectively. When multiple radios are adopted in the sink node, switching among different channels is eliminated and data flowing can be received constantly from senders to the receiving radio interfaces, which can greatly improve the DTR. Yuan et al. proved that the maximum DTR of a CC2420 transceiver of IEEE 802.15.4 is 135 Kbps [20]. When all the 7 transceivers are operated together, the DTR in the authors’ research can reach 909.3 Kbps. Although these researches have concentrated on the design of the multi-radio nodes, relatively less attention is paid to deep research on designing WSNs based on these nodes.
On the other hand, multi-hop WSN or single-hop WSN with amplified radio output is typically adopted to enlarge the monitoring range. However, by multi-hopping, the wireless link quality including the packet loss rate (PLR) and bit error rate (BER) is commonly degraded through multi-hop routing [25-27]. The BER and PLR are typically used as main indicators for wireless link quality in WSN. Some literatures have reported the PLR and BER evaluation in single-hop network using nodes with CC2420 transceiver [26-27]. Lee Y. D. et al. [26] investigated PLR measurements using MTM-CM2000-MSP nodes. They have evaluated that transceiver transmission resulted in a PLR of 95 % at the distance of 70 m and the BER jumped up suddenly over 50 m with the transmitting power of 0 dBm configured in node. In contrast to single-hop network, the PLR and BER grow gradually as the transmission hop increases in multi-hop network [28-29]. Shah J. P. et al. [29] described a patient’s electrocardiogram (ECG) network using Crossbow MICAz motes and listed the lower PLR achieved in one-hop network than two-hop network. They evaluated 40 % PLR on the third router and over 80 % PLR on fifth router for data delivered. In [26-29], these researches adopts regular single or multi-hop network. In this paper, new network architecture is investigated for reducing the PLR and BER of network.
Some multi-hop communication solutions have also been developed for improving network performance. In SHM area, Nagayama et al. [14] investigated single-sink multi-hop (SSMH) approach based on Ad-hoc On-demand Distance Vector (AODV) routing protocol involved in civil infrastructure monitoring. In an attempt to improve Nagayama’s work, Zilong Zou et al. [30] proposed improved single-sink multi-hop (ISSMH) approach which has a more efficient routing method for stable static routes. In the two approaches, when a node is communicating using one channel, surrounding neighboring nodes communicate using different channels. Consequently, both the sending relay node and receiving relay node in same network layer should collaborate and switch their channels for block-by-block data transport in concert. When the communication channel between two relay nodes is swapped, both nodes should collaborate with each other again. If packet transmission in one node is dropped in communication channel swap, the node remains on previous radio frequency (RF) channel and becomes unreachable. In contrast to the single-sink node in Nagayama and Zilong Zou’s work, M-RSN has all communication channels for clusters and therefore can abandon the functions of communication channel swap. However, till now, no research has been reported on multi-hop WSN design based on M-RSN, although the M-RSN has been proved to be more effective. In addition, some studies have manifested that 2-radio relay node can be used to avoid the channel swap, which makes it suitable for multi-hop WSN communication [31-35]. The 2-radio relay node can also improve the wireless link quality more effectively. Different transceivers in the 2-radio relay nodes are dedicated for data transmission and reception simultaneously which enhances the capabilities of the network. In contrast to the single-radio relay, higher end-to-end DTR and lower channel interference were verified in the 2-radio mesh relay network. Hence, in this paper, to design a high transfer ability multi-hop WSN without degrading the link quality for SHM application, a kind of 2-radio relay node named as D-RRN can be also applied in the designed multi-hop WSN. Consequently, it is interesting to exploit how to design and implement a new multi-hop WSN with the combination of M-RSN and D-RRN.
The article is organized as follows. First, the software and hardware implementations of M-RSN and D-RRN are presented. Then, a new design method for multi-hop network including M-RSN and D-RRN is presented. This method develops multi-radio communication with high-throughout ability by M-RSN and deploys D-RRN as relay node in network for reliable and long-distance communication. Subsequently, a tight scheduled approach combined with time synchronization for the network is discussed. Finally, experiment in outdoor environment verifies the maximum DTR and the wireless link quality of the designed network. Further, in order to verify the ability to develop structural health monitoring systems based on the designed network, a distributed strain WSN-based monitoring system is implemented on a wing box and an unmanned aerial vehicle (UAV) composite wing together which are both real complex aerospace structures.
2. Design of the high-throughput multi-hop WSN
2.1. M-RSN and D-RRN Design
2.1.1. Hardware of M-RSN, D-RRN
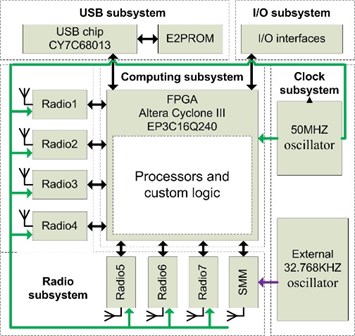
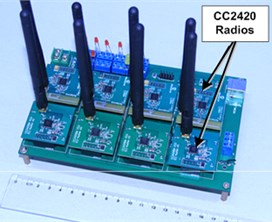
The hardware of M-RSN, presented in Fig. 1(a), mainly contains core processing module, multiple wireless communication modules, universal serial bus (USB) communication module. Fig. 2(a) shows that the dimension of M-RSN [20] is 180 mm×115 mm×30 mm.
Fig. 1Hardware architectures of M-RSN and D-RRN
a) Hardware architecture of M-RSN
b) Hardware architecture of D-RRN
Once M-RSN starts up the supplying power, core processing module initializes and controls the operation of multiple wireless communication modules and USB communication modules. A wireless communication module is in charge of starting network operation by sending command to all sensor node and broadcasts synchronization command periodically to all sensor nodes for synchronizing network. The other wireless communication modules receive data from sensor nodes and transfer sensor data to core processing module. In the end, the USB communication modules in M-RSN get sensor data from the core processing module and upload them to PC monitoring.
The core processing module is the core module of M-RSN which controls the operation of multiple wireless communication modules and USB communication module. It adopts a FPGA chip (EP3C16Q240C8N) from ALTERA Company as the core processor. This chip contains 240 physical pins which can be programmed by EP3C16Q240C8N, and these pins provide enough efficiency of parallel data transmission for multiple wireless communication modules and USB communication module. In this paper, the frequency of external crystal oscillator for M-RSN is 50 MHz and 64 KB Random Access Memory (RAM) is provided for programming the software of the core processing module. Also, the core processing module allows two different configurations to be done by Quartus II software, knows as JTAG mode and Active Serial mode.
The USB module connects to core processing module and PC. This module adopts CY7C68013A chip from Cypress Semiconductor Corporation for uploading data from core processing module to PC. This chip is a low-power version of the EZ-USB FX2LP which is a highly integrated, low-power USB2.0 controller by intergating the USB2.0 transceiver, enhanced 8051 microcontroller and programmable peripheral interface together. The architecture of CY7C68013A can produce maximum data rate of 53 Mbytes per second in theory. The high transmission rate meets the demand for transmitting all data completely from multiple wireless communication modules to PC. The FPGA chip connects to CY7C68013A with SLOE, SLRD and SLWR pins which indicate the state of reading or writing data. The data bus FD [7:0] and address bus FIFOADDR [7:0] are used to data transmission between FPGA chip and CY7C68013A chip. In the paper, the enhanced 8051 controller in CY7C68013A is implemented in slave First-input-First-Output (FIFO) mode. In this mode, FPGA in core processing module can read and write the FIFO buffer in CY7C68013A in the same way as operating an ordinary FIFO.
The multiple wireless communication modules adopt a 2.4 GHz CC2420 radio chip from Texas Instruments (TI) for low-power wireless communication by IEEE 802.15.4 standard. The wireless communication module connects to core processing module with SFD, FIFO, FIFOP and CCA pins which can indicate the state of receiving or sending data. Additionally, the VREG_EN pin can start voltage regulator of CC2420 and produce 1.8 V to put it into proper condition, and RESETn pin can reset wireless communication module. Also, the analog Serial Peripheral Interface (SPI) (pins SI, SO, SCLK and CSn) between wireless communication modules and core processing module are used to write, read buffered data and read status information. In this paper, two kinds of wireless communication modules operate in M-RSN. One wireless communication module with 32.768 KHz oscillator is only used as synchronization manage module (SMM). The other wireless communication modules with 50 MHz oscillator are only used for receiving radio data from sensor nodes. The SMM records timestamp by oscillator’s counting, stores the timestamp into synchronization command and sends synchronization command to sensor nodes. Therefore, the frequency of oscillator in SMM is closely related to time synchronous data acquisition for sensor nodes. In this paper, the oscillator’s frequency of SMM is same as the oscillator’s frequency of all sensor nodes, which is more efficient for calculating and eliminating the clock time differences between SMM and all sensor nodes. If the oscillator’s frequency of SMM and oscillator’s frequency of sensor node are different, each sensor node has to calculate the ratio of the two frequencies for eliminating clock difference after getting the timestamp from synchronization command in each time synchronization processing. However, the calculation of ratio value will increase complexity of synchronization and produce more energy consumption in sensor node. Therefore, in this paper, the frequency of oscillator in SMM is 32.768 KHz which is also adopted in all sensor nodes.
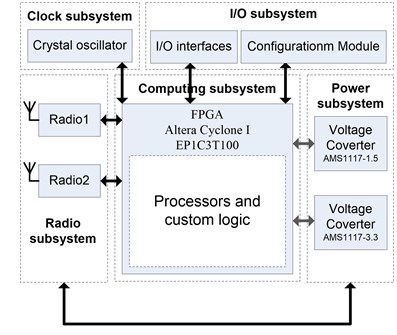
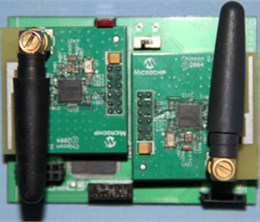
The hardware architecture of D-RRN, as shown presented in Fig. 1(b), mainly contains core processing module and 2 wireless communication modules. As shown Fig. 2(b), the dimension of the D-RRN is 25 mm×30 mm×30 mm. The EP1C3T100 FPGA chip from ALTERA Company Cyclone I with 65 user I/O pins is chosen as the core controller for core processing module. The EP1C3T100 FPGA chip configures available I/O pins to regulate two wireless communication modules in different channels by analog SPI interface (pins SI, SO, SCLK and CSn). The channel of one wireless communication module is set to provide wireless communication links for the sensor nodes and the other wireless communication module provides wireless communication links for the M-RSN. Like wireless communication module in M-RSN, the two wireless communication modules in D-RRN also adopt CC2420 chip.
Fig. 2(c) shows the wireless strain sensor node adopted which are developed by the authors’ group [5]. The node contains strain gauge signal conditioning board and core board. In the core board, a low-power microcontroller MSP430F1611 is selected as processing controller and CC2420 chip is selected as radio transceiver. 4 channel converters with 12-bit analog-to-digital conversions (ADC) precision in MSP430F1611 MCU allow the node to simultaneously sample analog signals from multiple strain sensors. The signal conditioning board is composed of bridge circuit, amplifier and output circuit for strain signals conditioning. In the paper, although only one sampling channel is connected with the strain gauge, the data packet includes all data from the four sampling channels which are provided by the sensor node. The data of the other three sampling channels are set to zero.
Fig. 2Hardware implementations of the M-RSN, D-RRN and strain sensor node
a) M-RSN with multiple radios
b) D-RRN with two radios
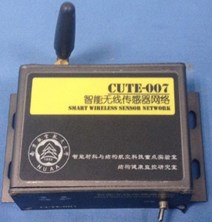
c) Wireless strain sensor node
2.1.2. Software of M-RSN, D-RRN
The software system of M-RSN is divided into sequential processing subsystem and parallel processing subsystem, as shown in Fig. 3(a). Sequential processing subsystem includes logic control layer (LCL) and data communication layer (DCL), and parallel processing subsystem features data processing layer (DPL).
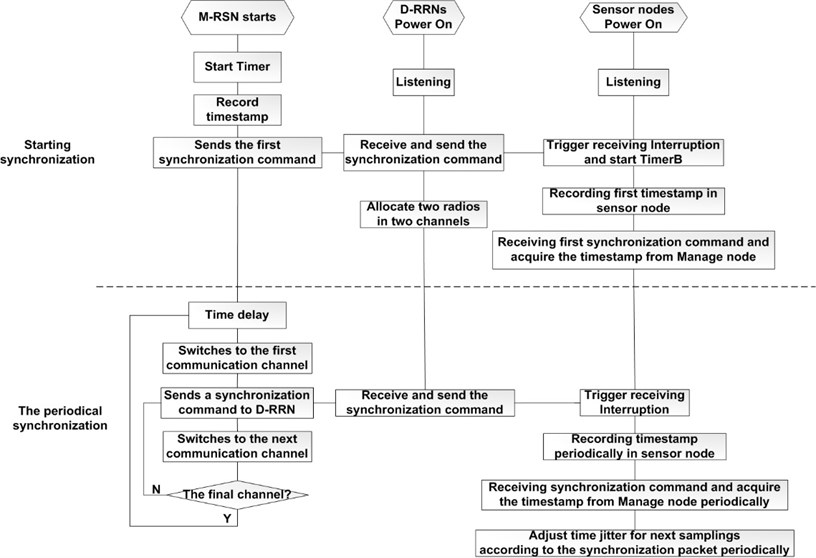
DPL includes data packet processing state machine (DPPSM), radio management state machine (RMSM) and FIFO in different channels. The RMSM initializes the separate wireless communication modules, responds to the interruption from the wireless communication modules simultaneously and distributes data packet to corresponding DPPDM. After DPPDM stores the processing data packets from RMSM to the corresponding FIFOs, all data in FIFOs are formed into a complete stream and then uploaded to LCL. LCL consists of dataflow generation module (DGM), FIFO scanning state machine (FSSM) and FIFO management state machine (FMSM). By merging the data from the FIFOs and forming the data flow in DPL, the DGM reduces the time spent on receiving data from different wireless communication modules and elevates the low efficiency of wireless communication modules. The USB management state machine (UMSM) in DCL connects the USB communication module to core processing module for managing the interface between USB and FPGA. The USB chip set in slavefifo mode controls the DGM to transfer bulks of data to the cache FIFO in the USB chip. The SMM controlled by the FMSM broadcasts the SC with timestamp T0,1 for starting network. And it sends time synchronization command T0,i(i≥2) in Tsync period to sensor nodes via D-RRNs after switches to each channel subsequently. The details processing of SMM is described in Section 2.2.
The software structure of the D-RRN, as described in Fig. 3(b), includes data processing layer (DPL) and data communication layer (DCL). The DPL, as the parallel processing subsystem, coordinates two transceivers to work separately in two channels. Each transceiver consists of 2 FIFOs, 2 data packet processing state machines (SPPSMs) and 2 radio management state machines (RMSMs). The SPPSMs are in charge of relaying synchronous data and sensor data to FIFO1 and FIFO2 respectively, while RMSMs forward the radio data from DCL to SPPSMs. The synchronous data or the sensor data can be transmitted between FIFO1 and FIFO2. To avoid affect the relaying performance of D-RRN, the data from the M-RSN or sensor nodes are not analyzed due to time-consuming data length calculation and data correction examination. Considering that the FPGA chip in M-RSN has higher capability than FPGA controller in D-RRN, data length calculation, analysis and correction are all implemented in M-RSN.
Fig. 3Software structure of the M-RSN and D-RRN
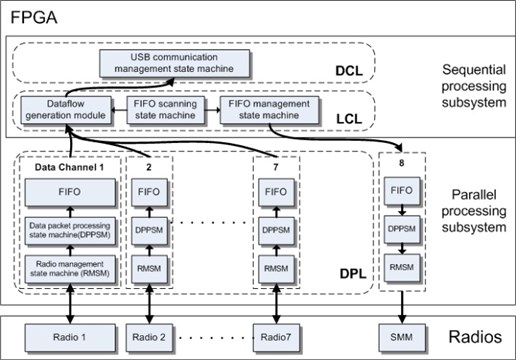
a) Software structure of the M-RSN
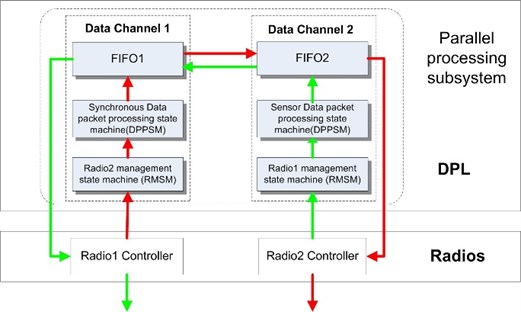
b) Software structure of the D-RRN
2.2. Network framework
To achieve the high DTR multi-hop WSN, a design method for WSN architecture including M-RSN and D-RRN is proposed.
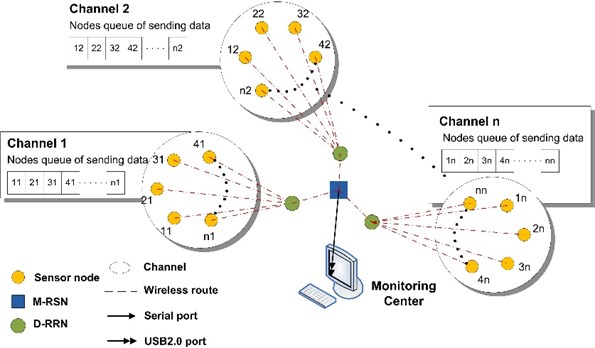
Fig. 4 shows the topology of the presented high DTR multi-hop WSN. In the proposed WSNs topology, groups of sensor nodes arranged into several clusters are densely deployed around specific monitoring areas and report monitoring data to remote station in a multi-hop and multi-radio fashion. Sensor nodes in every cluster are assigned in different channel, send sensor data to D-RRN through Time Division Multiple Access (TDMA) protocol and perform time synchronization for data sampling. In each cluster, D-RRN functions as relay node and uploads the sensor data in the cluster to top layer. In addition, all D-RRNs support synchronization command periodically from top layer relayed to the sensor nodes for sampling synchronization. In the top layer, one M-RSN controls synchronization command and sends it periodically to sensors nodes in all clusters. In addition, the M-RSN aggregates sensor measured data from different clusters via D-RRNs.
The proposed WSN consists of the following types of nodes:
Sensor Nodes: In each cluster, the sensor nodes are in charge of structural parameter monitoring in the same channel. These sensor nodes also need to cooperate to reliably deliver the monitoring data to the D-RRNs. Sensor nodes in different clusters work in different communication channels.
D-RRNs: These are the devices that function as relay node. There are 2 radios equipped in the D-RRNs, namely radio module A and B. Radio module A is responsible for receiving the measured data from the sensor nodes in one cluster within its radio range in the same channel. Radio module B forwards the data towards the next level D-RRNs or M-RSN in the communication channel, which is different from the channel in module A. The channels in two radio modules in D-RRNs are different, which is favorable for the parallel processing algorithm in D-RRNs.
M-RSN: This is the sink node equipped with multiple radios, which has wireless link to the D-RRNs using a cluster-star framework. M-RSN fully supports multi-radio access, multi-point operations and time synchronization mechanism for all sensor nodes. A radio transceiver, namely synchronization manage module (SMM) in M-RSN is in charge of starting the operation of the whole network by sending initial command. The SMM also provides global timestamps periodically for synchronizing the data acquired from all sensor nodes assigned in different channels.
The sensor data uplink stream from sensor nodes to M-RSN and synchronization command downlink stream from M-RSN to sensor nodes are integrated for data stream transmission. In the data stream transmission, D-RRNs relay data uplink stream and data downlink stream at the same time. The sensor data uplink stream is in multi-radio fashion and TDMA protocol for the data uplink stream determines the reliability of data transmission in each channel. The sensor data uplink streams in different clusters are separated and converge on the M-RSN. The synchronization command downlink stream is controlled by M-RSN and reaches all clusters in sequence. Two types of data stream transmission conduct cooperation for tight scheduled approach in network.
Fig. 4The topology of the presented high DTR WSN
2.3. Tight scheduled approach for the network
WSN framework requires scheduled approach for network operation and cooperation. The advantages of tight scheduled approach for network are multiple. Firstly, it increases the efficiency of data transmission by reducing idle listening time of sensor nodes and making full use of data sending time, which is beneficial for high DTR. Then, tight scheduled approach can avoid packet collisions to reduce packet loss which means more nodes can be added into network for increasing the capacity of sensor network. Also, the TDMA protocol and multi-radio time synchronization can be coordinated by the scheduled approach. Therefore, a tightly scheduled approach using TDMA protocol and multi-radio time synchronization is proposed in the monitoring network for high communication reliability and high DTR.
The TDMA protocol allows multiple sensor nodes in the same channel to communicate with base station by transmitting measured data in different time slots during a sample period, ensuring the sending time to be determined more readily due to the absence of back-off delays and network contention [36]. Time synchronization is indispensible in majority of real-time monitoring systems based on WSNs. Time synchronization occurs to adjust time jitter of the sensor node’s clocks, which is necessary to determine the reliability of sensing alignment and facilitate the tight scheduling TDMA protocol of sensor data delivery in each channel. In this paper, multi-radio time synchronization is designed for network. Fig. 5 illustrates scheduled diagram of multi-radio synchronized sensing and transmission operations. To initiate the scheduled diagram, the M-RSN starts clock timer in FPGA chip and records the timestamp in the start command (SC) which is broadcasted by SMM and delivered to D-RRNs. The SC carries the information about sampling rate, number of samples, synchronization interval and timestamp T0,1. After relaying command (RC) to different sensor node clusters (SNCs) by D-RRNs, the D-RRNs allow two radio modules to enter into different communication channel. Upon receiving the SC from D-RRNs, all sensor nodes trigger receiving interruption from listening state, record the initial timestamps T1,1, T2,1,…, Tn,1 in different channels, store the timestamp T0,1 from the start command and configure sampling rate, sampling period, synchronized interval. Then, all SNCs wait for sensing event (SE). Once SE is detected, the SNCs start to acquire data at the setting sampling rate and continue acquisition periodically. Furthermore, all the SNCs forward data acquired within one sample period towards the D-RRNs in the light of TDMA protocol and prepare for the next data transmission.
Fig. 5Schematic diagram of multi-radio synchronized sensing and transmission operations
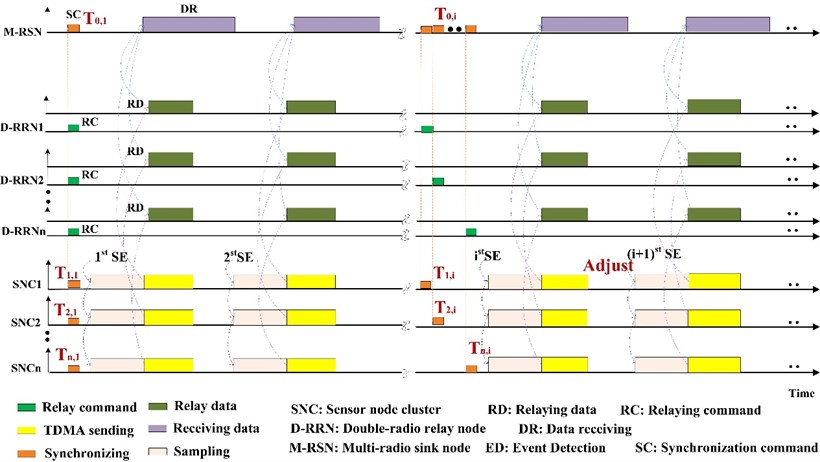
Next, the D-RRNs relay data (RD) from SNCs to M-RSN. In the circularly scheduled approach, as shown in Fig. 6, when switching to one channel, the SMM in M-RSN broadcasts synchronization command including timestamp T0,i(i≥2) to all SNCs via D-RRNs periodically. In each synchronization period, all SNCs store the timestamp T0,i(i≥2) from the synchronization command and record their own timestamps T1,i, T2,i,…, Tn,i(i≥2), calculating the next sampling offset to align the clock of SNCs for time synchronization. The clock time difference between the SMM and the sensor nodes is calculated by Eq. (1):
Each sensor node in all channels adjusts sensing clock time for next sampling according to TΔ in Eq. (1). After broadcasting synchronization packet in one channel, the SMM switches to other channels in sequence and performs the same procedure in corresponding clusters. If all channels have been switched, one round of the time synchronization in network ends and the SMM performs the synchronization at a fixed interval continuously. The maximum time synchronization difference of the designed network is around 60 μs. Due to 32.768 KHZ HOSONIC crystal with a frequency stability of 5 ppm at room temperature in all the Telosb nodes, the crystal drift is close to 60 μs after 12 s. Thus, 12 s is selected as synchronization interval to coordinate the synchronization precision of 60 μs for the network.
Due to independence of the time synchronization, no overlapping time exists between the scheduling of sending in TDMA protocol and scheduling of synchronization command receiving in SNCs, thus assuring the regularity and reliability of network operation.
Fig. 6The mechanism of designing multi-hop and multi-radio synchronization
3. Wireless link quality metrics for the network
The packet loss and bit error cannot be avoided in WSN due to factors such as variable transmit power, multi-hop transmission, channel noise, radio interference and bit synchronization. BER and PLR are 2 typical parameters to represent the link quality. In this paper, the BER and PLR are used to be 2 main parameters to evaluate the wireless link quality of the proposed WSN.
The BER is the number of bit errors divided by the total number of transferred bits during the experiment time, which is given by [27]:
where NRx and NTx represent the number of correctly received bits and the total number of received bits respectively.
The PLR calculated in the central computer is defined as the average of the ratio of NLost to NRecv. The PLR is defined as [37]:
where NLost and NRecv are the number of packet lost and the total number of packet received in M-RSN respectively. NLost is determined by the sequence number of packets. Each missing packet increases the value of the PLR as shown in Eq. (3). The mean μ and standard deviation σ of the PLR are calculated according to Eq. (4) and Eq. (5) respectively. The xi is the measurement of PLR in each channel and n is the number of channel. Furthermore, the μ and the σ indicate the average PLR of network and the similarity of PLR among all channels respectively:
4. Evaluation for the proposed network
To investigate the performance of the designed WSN, in this section, 3 experiments are carried out to evaluate the maximum DTR and wireless link quality and distributed strain monitoring for the proposed network.
4.1. Maximum DTR and wireless link quality evaluation
In order to evaluate the DTR, the baseline DTR between two nodes with single-radio based on IEEE 802.15.4 is discussed first. Theoretically, 250 Kbps is reported between 2 CC2420 radio based nodes. However, Osterlind et al. proved that the maximum DTR of the CC2420 radio is 225 Kbps [38]. If the packet copying is performed between the transceiver and the microcontroller during real data sampling and sending procedure, the maximum DTR is only around 140 Kbps. The maximum DTR of radios is 51.2 Kbps on Telosb platform and 114.2 Kbps on Iris platform respectively [17].
In this paper, when the network works under maximum DTR at different communication distances, besides the DTR, BER and PLR are also measured.
4.1.1. Evaluation experiment setup
The experiment to evaluate the maximum DTR and wireless link quality of the proposed network lasts for 2 hours. The experimental setup, as shown in Fig. 7(a), consists of 7 Telosb nodes, 7 D-RRNs and a M-RSN, equipped with 2.4 G non-directional antennas of 5 dBm. In the experiment, the transmission power level of each Telosb node is configured at 0 dBm. To mitigate the effects of interference among different channels, the Telosb nodes are set to communicate in channel 13, 15, 17, 19, 21, 23, 25 provided by IEEE 802.15.4 protocol respectively, and the D-RRNs work in channel 12, 14, 16, 18, 20, 22, 24 respectively to forward data to the M-RSN. The D-RRNs are arranged in the middle of the Telosb nodes and the M-RSN, as demonstrated in Fig. 7(b). Different arrange distances between leaf nodes and the M-RSN are adopted in the evaluation, including 30 m, 40 m, 50 m, 60 m, 70 m, 80 m, 90 m and 100 m.
Fig. 7DTR experimental setup
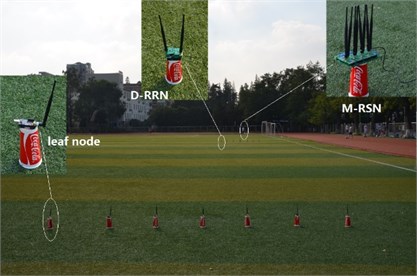
a) Experimental deployment in open field
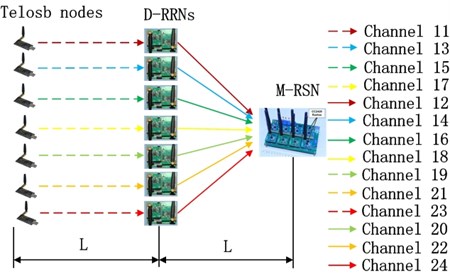
b) The framework of DTR experiment
4.1.2. Software implementation setup
To achieve the maximum DTR evaluation, high data transmitting strategy in Telosb node is developed first, shown in Fig. 8. In the initialization process of the Telosb node, as shown in Fig. 8(a), complicated MAC protocol, route protocol, address recognition and in-line security operations which may influence the realization of largest network data throughput are disabled. The Telosb nodes are initialized at the same setup as reported in [38]. After initialization of the Telosb nodes, a fix data payload is directly buffered into transmit FIFO of the CC2420 chip of Telosb nodes. The fixed data payload consists of first 2-byte of 0x7E and 0x7F, 1-byte of payload length, 1-byte of sequent number, a fixed 112-byte of 0xFF bytes and the end byte 0x7E. The first 2 bytes and the end byte are used for checking the correct receiving of the packet. After the data payload filling is completed, the Telosb nodes start continuous data transmission, as demonstrated in Fig. 8(b).
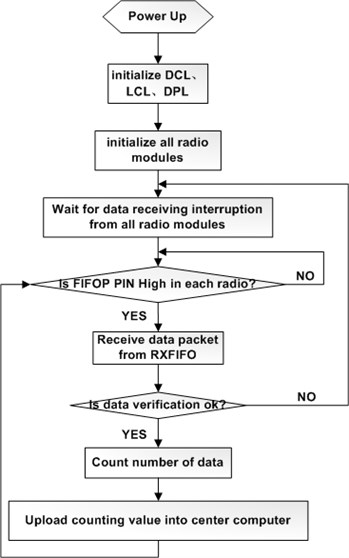
In order to attain the upmost DTR of the M-RSN, the program of the M-RSN is modified. In this evaluation, the DGM in M-RSN, which is engaged in merging a large amount of data packet from the DPL and forming the data flow for data upload and data storage, is disabled. On the other hand, the program disables the HDLC and CRC mechanisms and underlines simplified checking mechanism of data integrity and correction in M-RSN. As shown in Fig. 9, after initializing DCL, LCL and DPL, the M-RSN waits for data receiving interruptions from all radio modules. When data receiving interruption is triggered, the FIFOP pin in CC2420 chip goes high and the M-RSN receives data from RXFIFO. In each data reception, the M-RSN checks the data integrity and correction according to the first two bytes 0x7E and 0x7F, 1-byte of payload length and the end byte 0x7E in the data payload. If the validity of the data integrity and correction is successful, the M-RSN counts the value of packet number and uploads it to the central computer.
Fig. 8Data continuous transmitting process in the Telosb node
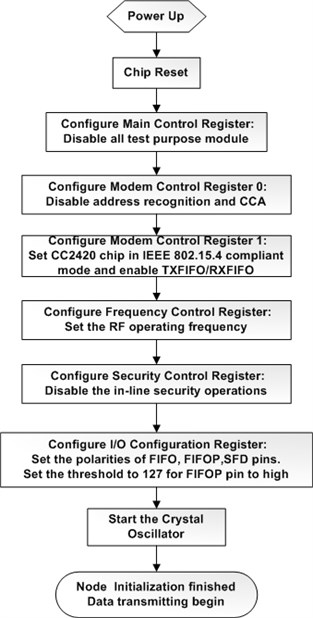
a) The initialization of the Telosb node
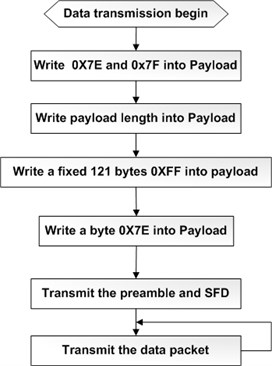
b) The data packet filled and transmitting processing
Fig. 9The data counting process of M-RSN
4.1.3. Evaluation results and discussion
Table 1 shows the relationship between the achieved DTR and the number of radios at different distances. As shown in Table 1, when only one channel is used, the maximum DTR at the distance of 30 m is 136.5 Kbps which is close to the maximum DTR of 140 Kbps [38]. It is obvious that the maximum DTR rises steadily as the number of channel increases. The maximum DTR can reach 861.6 Kbps at the distance of 80 m when 7 radios are used together. With the distance of 30 m and one hop, the DTR can still reach 909.4 Kbps. Compared to 909.3 Kbps at a close communication distance when all the 7 transceivers are operated together [20], the value of 909.4 Kbps means the successful improvement of DTR when hop is added. As the distance increases from 30 m to 100 m, the maximum DTR for one channel drops slightly from 136.5 Kbps to 120.7 Kbps, DTR for 7 channels falls from 909.4 Kbps to 803.2 Kbps due to accumulative drop of the maximum DTR in each channel. However, the maximum DTR are still greatly improved comparing to the singe-radio node with 140 Kbps DTR based WSN.
Table 1Data throughput evaluation results in different channels
Numbers of channels | Maximum DTR (Kbps) in different distances between Telosb and M-RSN | |||||||
30 m | 40 m | 50 m | 60 m | 70 m | 80 m | 90 m | 100 m | |
1 | 136.5 | 134.2 | 133.3 | 133.1 | 131.4 | 129.4 | 125.5 | 120.7 |
2 | 269.4 | 265.3 | 265.1 | 264.7 | 262.5 | 259.7 | 249.2 | 240.5 |
3 | 400.3 | 394.6 | 392.2 | 389.2 | 386.5 | 382.9 | 374.3 | 358.4 |
4 | 524.6 | 516.1 | 514.3 | 510.6 | 506.2 | 500.3 | 489.7 | 468.2 |
5 | 658.3 | 647.5 | 641.3 | 636.5 | 630.6 | 626.1 | 612.4 | 588.1 |
6 | 762.8 | 750.4 | 745.7 | 738.3 | 731.4 | 725.5 | 710.3 | 678.7 |
7 | 909.4 | 887.4 | 880.3 | 873.2 | 865.3 | 861.6 | 843.6 | 803.2 |
In the experiment, the BER and PLR of the network are calculated by Eq. (2) and Eq. (3) respectively. The average BER vs. distance is presented respectively in Fig. 10(a). The BER is close to 0 % within the distance of 80 m with one hop, in comparison with the BER which jumps up suddenly over 50 m without any hop [27]. The BER results demonstrate that almost all packets produced in nodes are successfully transferred to the FIFO of CC2420 transceiver, and prove the high correctness of wireless data packet transmission in the proposed network.
Fig. 10PLR in different channels and BER vs. distance in an open field
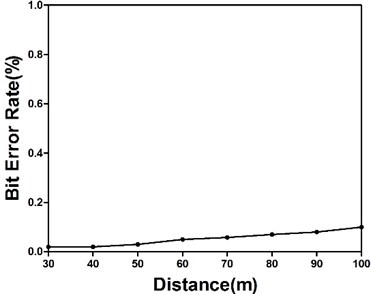
a) BER vs. distance in an open field
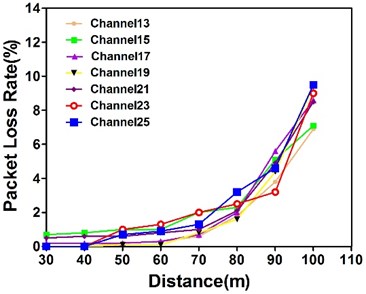
b) PLR in different channels vs. distance in an open field
Fig. 10(b) presents the average PLR in different channels vs. distance. It can be noticed that the average PLR in different channels experiences an upward trend as the distance increases. Within the distance of 80 m and with one hop, the average PLR in different channels increases slightly and is less than 3 % which has been greatly improved compared to reported 68 %-93 % at the distance of 40 m without any hop [28]. After slight increasing, the rise of the average PLR in different channels is particularly noticeable above 80 m, indicating that average PLR in different channels has high wireless link quality within the radio range of 80 m. Furthermore, as mentioned in Section 2.3, the average PLR of network with all channels and the similarity of PLR among all channels is evaluated by μ and σ respectively. In the Table 2, μ is below 2.5 % within the distance of 80 m although it rises gradually, and the corresponding σ is below 0.6. The value of μ represents the low average of the wireless packet loss, revealing the high wireless link quality of network. Meanwhile, σ evaluates the differences of wireless packet loss in each channel. Due to wireless communication in all channels operates in same outdoor environment, it is reasonable that wireless packet loss is almost same in each channel. If the functionality of multiple radios in the sink node is not parallel or the sink node fails to coordinate all multiple radios well, the wireless packet loss is much higher in some channels than other channels which means high σ will be measured in the network. In this experiment, the low measured value of σ shows that the wireless packet loss is distributed evenly in different channels of proposed network, which indicates that wireless link quality is similar in different channels.
Table 2The mean value and standard deviation value of PLR vs. distance
PLR [%] | Distance | ||||||
40 m | 50 m | 60 m | 70 m | 80 m | 90 m | 100 m | |
μ PLR of network | 0.2 | 0.5 | 0.7 | 1.2 | 2.2 | 4.5 | 8.6 |
σ PLR of network | 0.29 | 0.33 | 0.38 | 0.46 | 0.51 | 0.60 | 1.09 |
4.2. Aircraft structural distributed strain monitoring evaluation
In order to verify the tight scheduled and parallel working ability of the designed multi-hop wireless sensor network, a distributed strain WSN-based monitoring system is implemented on a wing box and an UAV composite wing together which are both real complex aerospace structures.
4.2.1. Experiment system setup
Structure strain changes under external or mechanical loads are important testing parameters in SHM. The aircraft static strain test, on-board real-time strain measurement during test flight and certification of a new aircraft are critical in aircraft structure testing. It is important to measure the load strain at key locations during tests, measure strain distributions during compression testing of stiffened panels with damage to validate analytical model predictions.
This experiment consists of 4 sensor nodes clusters in different channels, in which cluster 1, 2, 3, 4 and 5 are in charge of strain monitoring of UAV composite wing structure and cluster 6, 7 are dedicated for the strain monitoring of wing box structure. Each cluster contains 4 strain sensor nodes. Fig. 11(a) demonstrates the arrangements of strain sensor nodes on the wing box structure. The structure includes 5 lines of bolt holes with an interval distance of 280 mm and 6 T shape stiffeners with a interval distance of 130 mm. As shown in Fig. 11(a), a central monitoring area without bolt holes and shape stiffeners is chosen for strain monitoring and its size is 280×130 mm2. In the structure, the strain gauges connected to No. 11, 12, 13, 14, 21, 22, 23, 24, 31, 32, 33, 34, 41, 42, 43 and 44 sensor nodes are placed on the monitoring area. Although each sensor node interfaces with four sampling channels with 10-bit sampling resolution, only one sampling channel is connected to a strain gauge and the sampling data in other three channels are set to zero.
The UAV composite wing structure and the arrangement of nodes are shown in Fig. 11(b). No. 61, 62, 63, 64, 71, 72, 73, 74 strain gauges and No. 1, 2, 3, 4, 5, 6, 7, 8 fiber bragg grating sensors are placed on the beam in UAV composite wing structure. Each fiber bragg grating sensor is deployed besides each strain gauges for strain data comparison. As spectral filter, fiber bragg grating sensor is based on the principle of Bragg reflection. The gratings are printed in the core of optical fiber in a parallel and close line. The gratings alternate regions of high and low refractive indices when a periodic ultraviolet light is imposed on optical fibers. The wavelength is known as the bragg wavelength λB and is given by λB=2nΛ where n is the average refractive index and Λ is the grating period. When load is applied to the UAV composite wing structure, 8 grating is strained and the peak reflected wavelength is changed. In this experiment, change of reflected wavelength without temperature compensation is given by:
where λB is the initial reference wavelength, ΔλB is the wavelength shift, neff is the effective index of the refraction of the core, v is poisson’s ratio of fibre, p1 and p2 are gauge constants of the strain optic tensor, and FG represents in total the gauge factor of fibre. As fiber bragg grating sensor, Micron os3610 is chosen with the size of 19 mm×250 mm. The strain ranges from –2500 με to +2500 με and the strain sensitivity is 1.2 pm/με. The gauge factor FG equals to 0.8 [39]. A high speed optical sensing interrogator unit (SM130-700 Micron Optics, scanning rate 1kHz, 8 optical channels, center wavelength of 1550 nm, wavelength ranges from 1510 nm to 1590 nm) is used to demodulated the bragg wavelength shift ΔλB, and then strain ε is calculated by Eq. (6). In this way, the fiber bragg grating works as strain sensor.
Fig. 11Strain monitoring experiment setup for aircraft structure
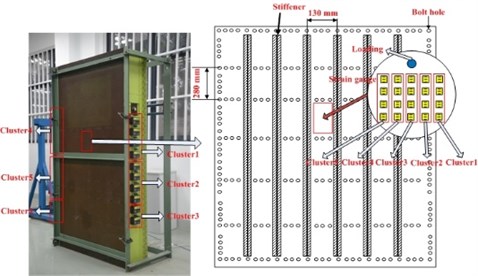
a) Experiment arrangement of the wing box
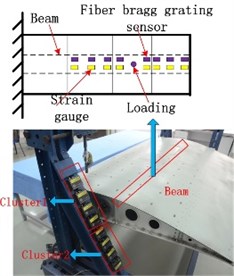
b) Experiment arrangement of the UAV composite wing
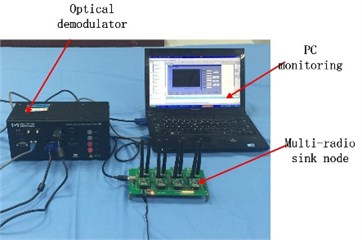
c) Monitoring center setup
Two loading equipments (CHHBL2) are used to change the strain distribution in UAV composite wing structure and wing box structure respectively. When concentrated load applied on structure is changed, the strain distribution will be changed. Two loads are exerted by screw rod and increased with screw rod rotated. Initially, screw rod is rotated for two cycles to serve as preload on wing box or UAV composite wing. Then, the load increases gradually with rotating the screw rod. Once the strain displayed on the computer is stable, it will be sampled for 5 seconds and averaged. The averaged strain value is used as final strain value. In Fig. 11(c), D-RRNs, M-RSN, SM130-700 optical sensing interrogator unit and PC monitoring are deployed together for the distributed strain monitoring of the wing box structure and UAV composite wing structure.
4.2.2. Results and discussion
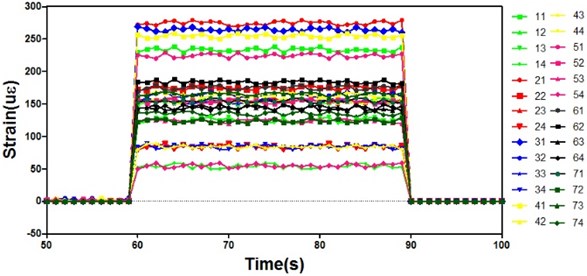
The distributed strain test result of 28 curves from 28 strain nodes in 7 different channels is shown in Fig. 12(a). Each curve demonstrates strain value of a sensor node for one strain gauge attached on the UAV composite wing structure or the wing box structure. Each plot value is an average value of 50 sampling point data. Initially, no load is applied on the two structures, so the strain values from all sensor nodes are zero. At time 60 s, two loads are respectively applied on the two structures simultaneously and all the 28 strain nodes have simultaneous outputs. Since different strains are produced at different positions on the two structures, the strain value output of each node is different. When time arrives at 90 s, all loads are removed from two structures. Under this circumstance, each sensor node in the network is able to monitor the loading changes at the same time. In the processing, the change data are successfully forwarded to the M-RSN via D-RRNs and displayed in the central computer system.
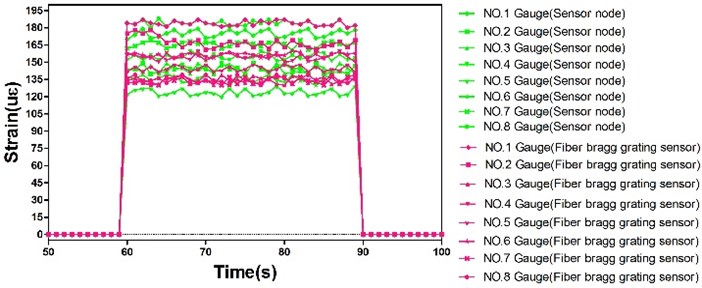
Besides the strain monitoring experiment above, in UAV composite wing structure, another strain monitoring experiment is carried out by 8 fiber bragg grating sensors connected to the SM130-700 optical sensing interrogator unit. The loading process is repeated and the strain measurement is implemented again. Then, as shown in Fig. 12(b), 8 strain testing results from SM130-700 optical sensing interrogator unit are compared to the strain results of No. 61, 62, 63, 64, 71, 72, 73 and 74 sensor nodes obtained by designed multi-hop network. It is concluded that the strain data obtained from the designed multi-hop network are almost the same as that of optical demodulator, verifying the accuracy of the designed multi-hop network. All monitoring experiments last for 24 hours continually without failure.
Fig. 12Strain monitoring results for aircraft structure
a) Strain results from 28 nodes in 7 channels
b) The comparison of strain results between strain gauges and fiber bragg grating sensor gauge
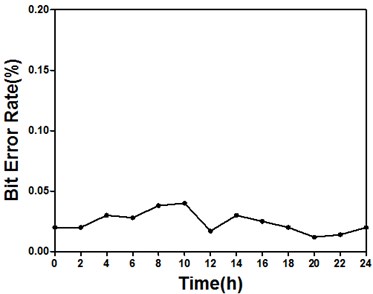
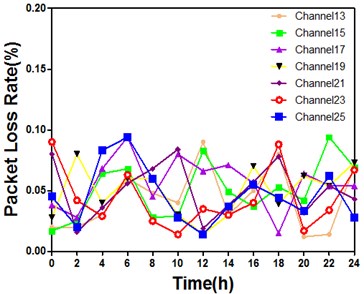
Additionally, the wireless link quality within 24 hours of all sensor nodes deployed in two structures is shown in the Fig. 13. The PLR in different clusters is below 0.1 % and the BER of network is below 0.05 % respectively, indicating high wireless link quality of the designed network in distributed strain experiment.
These results further prove the multi-radio simultaneous communication ability and high wireless link quality of the developed multi-hop monitoring network applied in the UAV composite wing structure and the wing box structure.
Fig. 13The wireless link quality of all sensor nodes in wing box and UAV composite wing
a) BER of all sensor nodes vs. time
b) PLR in different channels vs. time in two structures
5. Conclusions
To solve the bottleneck problem of high DTR and reliable multi-hop WSN-based SHM, this paper proposes a new design of multi-hop WSN. Two special nodes, M-RSN and D-RRN increasing the data transfer ability at the sink and extending the monitoring distance without degrading wireless link quality, are proposed for multi-hop WSN. Additionally, a tight scheduled approach and adequate multi-radio time synchronization are introduced for the proposed network. Experimental validations in outdoor environment, on wing box and UAV composite wing structure show the high DTR and reliable communication performance in multi-hop WSN-based SHM. This kind of multi-hop WSN shows its great potential applied value and easily deployment in large-scale SHM applications. In the future, we will extend the scale of multi-hop network and improve the data transfer ability of the approach to reduce transmission time for SHM applications.
References
-
Jämsä J., Luimula M., Pieskä S., et al. Indoor positioning using symmetric double-sided two-way ranging in a welding hall. Journal of Vibroengineering, Vol. 14, Issue 1, 2012, p. 27-32.
-
Kurata N., Spencer B. F. Jr., Ruiz-Sandoval M. Risk monitoring of buildings with wireless sensor networks. Structural Control and Health Monitoring, Vol. 12, Issue 6, 2005, p. 315-327.
-
Yedavalli Rama K., Rohit K. Belapurkar Application of wireless sensor networks to aircraft control and health management systems. Journal of Control Theory and Applications, Vol. 9, Issue 1, 2011, p. 28-33.
-
Wireless Interconnectivity and Control of Active Systems (WICAS), (EPSRC Project EP/Foo477X/1). Roll-Royce Control and Systems University Technology Centre, 2007.
-
Wu J., Yuan S.F., Zhao X. A wireless sensor network node designed for exploring a structural health monitoring application. Smart Materials and Structures, Vol. 16, 2007, p. 1898-1906.
-
Lynch J. P., et al. Design of a wireless active sensing unit for localized structural health monitoring. Structural Control and Health Monitoring, Vol. 12, Issues 3-4, 2005, p. 405-423.
-
Liu C., He X. Wireless sensor integration for bridge model health monitoring. Journal of Vibroengineering, Vol. 15, Issue 2, 2013, p. 1028-1040.
-
Wu J., Yuan S. F. Design and evaluation of a wireless sensor network based aircraft strength testing system. Sensors, Vol. 9, Issue 6, 2009, p. 4195-4210.
-
Lynch J. P., Wang Y., Loh K., Yi J. H., Yun C. B. Wireless structural monitoring of the Geumdang Bridge using resolution enhancing signal conditioning. Proceedings of the 24th International Modal Analysis Conference, 2006.
-
Liu Zhiqiang, Yu Yan, Liu Gao Design of a wireless measurement system based on WSNs for large bridges. Measurement, Vol. 50, 2014, p. 324-330.
-
Cosar E. I., Bocca M., Eriksson L. M. High speed portable wireless data acquisition system for high data rate applications. Proceedings of the ASME 2009 International Design Engineering Technical Conferences and Computers and Information in Engineering Conference, 2009.
-
Kim S., Pakzad S., Culler D. Health monitoring of civil infrastructures using wireless sensor networks. Proceedings of the 6th International Conference on Information Processing in Sensor Networks, 2007, p. 254-263.
-
Pakzad S. N., Fenves G. L., Kim S., Culler D. E. Design and implementation of scalable wireless sensor network for structural monitoring. Journal of Infrastructure Systems, Vol. 14, 2008, p. 89-101.
-
Nagayama T., Moinzadeh P., Mechitov K., et al. Reliable multi-hop communication for structural health monitoring. Smart Structures and Systems, Vol. 6, Issues 5-6, 2010, p. 481-504.
-
Corke Peter, Wark Tim, Jurdak Raja, Moore Darren, Valencia Philip Environmental wireless sensor networks. Proceedings of the IEEE, 2010, p. 1903-1917.
-
Kohvakka M., Arpinen T., Hannikainen M., Hamalainen T. High-performance multi-radio WSN platform, REALMAN. Proceedings of the 2nd ACM International Workshop on Multi-hop Ad Hoc Networks: From Theory to Reality, 2006.
-
Jurdak R., Klues K., Kusy B., Richter C., Langendoen K., Brunig M. Opal: a multiradio platform for high throughput wireless sensor networks. IEEE Embedded System Letters, Vol. 3, Issue 4, 2011, p. 121-124.
-
Gummeson J., Ganesan D., Corner M. D., Shenoy P. An adaptive link layer for heterogeneous multi-radio mobile sensor networks. Proceedings of the IEEE JSAC, 2010.
-
Popovici E., Boyle D., O’Connell S. The s-Mote: a versatile heterogeneous multi-radio platform for wireless sensor networks applications. Proceedings of the 20th European Conference on Circuit Theory and Design, 2011.
-
Yuan S. F., Wang Z., Qiu L. A multi-radio sink node designed for wireless SHM applications. Smart Structures and Systems. Vol. 11, Issue 3, 2013, p. 261-282.
-
Vassis D., Kormentzas G., Skianis C. Performance evaluation of single and multi-channel actor to actor communication for wireless sensor actor networks. Ad Hoc Networks, Vol. 4, 2006, p. 487-498.
-
Adya A., Bahl P., Padhye J., Wolman A., Zhou L. A multi-radio unification protocol for IEEE 802.11 wireless networks. Proceedings of the First International Conference on Broadband Networks, 2004, p. 344-354.
-
Campbell C. E. A., Khan S., Singh D. Multi-channel multi-radio using 802.11 based media access for sink nodes in wireless sensor networks. Sensors, Vol. 11, Issue 5, 2011, p. 4917-4942.
-
Bahl P., Adya A., Padhye J., Wolman A. Reconsidering wireless systems with multiple radios. ACM SIGCOMM Computer Communication Review, Vol. 34, Issue 5, 2004, p. 39-46.
-
Xia F., Tian Y. C., Li Y., Sung Y. Wireless sensor/actuator network design for mobile control applications. Sensors, Vol. 7, 2007, p. 2157-2173.
-
Lee Y. D., Jeong D. U., Lee H. J. Performance analysis of wireless link quality in wireless sensor networks. Proceedings of 5th international conference on Computer Sciences and Convergence Information Technology (ICCIT), 2010, p. 1006-1010.
-
Pustchi Navid, Korkmaz Turgay Improving packet reception rate for mobile sinks in wireless sensor networks. Proceedings of World of Wireless, Mobile and Multimedia Networks, 2012, p. 1-9.
-
Petracca M., Litovsky G., Rinotti A., et al. Perceptual based voice multi-hop transmission over wireless sensor networks. IEEE Symposium on Computers and Communications, 2009, p. 19-24.
-
Shah J. P., Aroul P., Hande A., et al. Remote cardiac activity monitoring using multi-hop wireless sensor networks. Engineering in Medicine and Biology Workshop, 2007, p. 142-145.
-
Zou Z., Nagayama T., Fujino Y. Efficient multihop communication for static wireless sensor networks in the application to civil infrastructure monitoring. Structural Control and Health Monitoring, Vol. 21, Issue 4, 2014, p. 603-619.
-
Hethuin S., Tonnerre A., Duprez A. Double Radio Relay Station. WIPO Patent 2009121730, 2009.
-
Zeng X., Sun L., Li S. The design of a double-radio RF transmission node. Proceedings of the International Conference on Electronics, Communications and Control, 2012, p. 306-309.
-
Yucek T., Arslan H. A survey of spectrum sensing algorithms for cognitive radio applications. IEEE Communications Surveys and Tutorials, Vol. 11, Issue 1, 2009, p. 116-130.
-
Lv P., Wang X., Xu M. Virtual access network embedding in wireless mesh networks. Ad Hoc Networks, Vol. 10, Issue 7, 2009, p. 1362-1378.
-
Dhananjay A., Zhang H., Li J., et al. Practical, distributed channel assignment and routing in dual-radio mesh networks. ACM SIGCOMM Computer Communication Review, Vol. 39, Issue 4, 2009, p. 99-110.
-
Linderman L. E., Mechitov K. A., Spencer Jr B. F. Real-Time Wireless Data Acquisition for Structural Health Monitoring and Control. Newmark Structural Engineering Laboratory, University of Illinois at Urbana-Champaign, 2011.
-
Kim S., Brendle C., Lee H. Y., et al. Evaluation of a 433 MHz band body sensor network for biomedical applications. Sensors, Vol. 13, Issue 1, 2013, p. 898-917.
-
Osterlind F., Dunkels A. Approaching the maximum 802.15.4 multi-hop throughput. Proceedings of the 5th ACM Workshop on Embed, Networked Sensors, 2008.
-
Sensing Instrumentation and Software ENLIGHT, User Guide Revision 1.1018. Micron Optics Inc., Atlanta, USA, 2008.
Cited by
About this article
This work is supported by the Seventh Framework Program (Grant No. FP7-PEOPLE-2010-IRSES-269202), the National Science Fund for Distinguished Young Scholars (Grant No. 51225502), Foundation of Graduate Innovation Center in NUAA (Grant No. kfjj130102), the Prioritized Academic Program Development of Jiangsu Institutions of Higher Educations, Foundation of Graduate School in NUAA (Grant No. 011022).
Shang Gao, Shenfang Yuan: designed and performed research; Lei Qiu, Biyun Ling, Yuanqiang Ren: analyzed data; Shang Gao, Biyun Ling: wrote the paper.
