Abstract
This article presents experimental studies on deep groove ball bearing vibrations and the results of simulation. A special test stand was designed to find failure modes. Acceleration, displacement, loading forces, shaft speed, acoustic pressure and temperature were measured. The measured parameters were not constant during the experiment; thus a number of state indicators were found. The amplitude of displacement is sensitive to rolling bearing degradation. At the same time, acceleration is sensitive to the defects of the races, whereas temperature is not. Moreover, acoustic pressure provides valid information about the defects of the races.
1. Introduction
Machines generate vibrations, noise, and heat, which are parasitic phenomena. Moreover, rolling bearing vibrations influence both the precision and quality of products. Finally, vibrations are used in machinery diagnostic to estimate their lifetime and find failures, and thus rolling bearing vibrations are an important topic [1].
Vibrations depend on the dynamic properties of machines, for example: excitations, stiffness, mass and damping, thus vibrations can be simulated and changed [2]. Two main methods are used in machinery diagnostics. The first method is based on experimental data, which are processed in order to find failure modes (state indicators) [3-7]; whereas the second method is based on modelling mechanical systems and simulation vibrations. In this article, the first method is presented. The main aim of this article is to present and compare signals, which can provide information about failures, and can be state indicators.
2. The test stand
The main idea of experimental investigations is to observe and measure the degradation of ball bearings. Four ball bearings 608Z were loaded by a spring force, that was regulated and measured. The bearings were mounted by pressing them onto the shaft, and, at the same time, they were mounted in housings with a loose fit. The two bearing housings were mounted onto the upper aluminium profile; next two housings were mounted to the lower aluminium profile (Fig. 1). The lower aluminium profile was mounted onto a concrete block. This block was seated on four rubber supporting elements. An asynchronous motor drove the shaft and bearings. The motor was mounted onto a separate concrete block, which was seated on four rubber supporting elements. The motor drove rolling bearings with a shaft and two flexible couplings, which reduces vibrations and forces.
The following parameters were measured: the acceleration of the ball bearing housings, the relative displacement between two housings, two loading forces, shaft speed, and acoustic pressure generated by the test stand, the temperatures of the shafts, bearings, and housings (Fig. 1). Acceleration was measured with sensors: a Dytran model 3225F1 in x-direction, and a PCB model T352C33 in y-direction and z-direction (Fig. 1b). At the same time, the relative displacement was measured with Peltron PSx1 sensors. Simultaneously, the loading forces were measured with the load cell HBM S9M/1KN. Next, the shaft speed was measured with a hall sensor. Then, the acoustic pressure was measured with a G.R.A.S. Type 26CA microphone. Finally, the temperature was measured with a FLIR AX5 infrared camera. The afore-mentioned sensors were connected to an LMS SCADAS MOBILE and computer.
Fig. 1The test stand with sensors
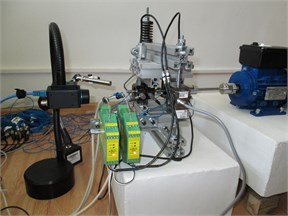
a)
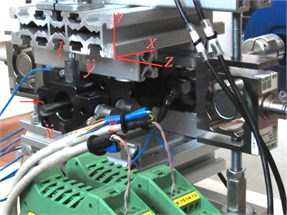
b)
3. Experimental results
First, the rolling bearings 608Z were loaded with a force of 864 N, within fifteen minutes. Then, the loading force was reduced to 331.5 N and data acquisition began (t1=0). The shaft speed was 2953.9 rpm during the experiments. In this article, time histories are presented for two time instances t1=0 h and after t2=65.472 h, for the rolling bearing indicated with an arrow in Fig. 1(b).
3.1. Time histories of acceleration and theirs spectrums
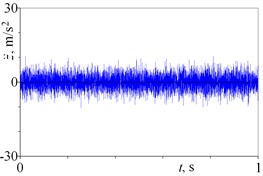
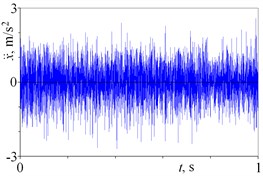
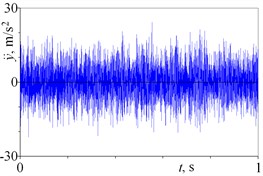
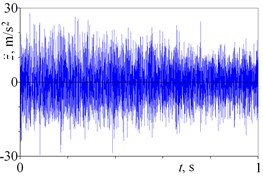
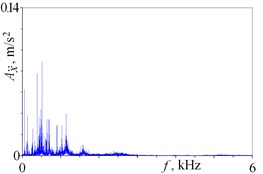
The time histories of acceleration are presented in Fig. 2, for the three directions x-y-z, and two time instances. As is evident from this figure, the vibration amplitudes rise and are bigger for t2=65.472 h than for t1=0 h. This shows that vibration amplitudes reflect the degradation of the rolling bearings. In this case, the amplitude in z-direction is the largest. Three amplitudes are widely used: average amplitude (AAVG, AxAVG=Σ|xi-xmean|/j), root mean square amplitude (ARMS), and peak-to-peak amplitude (AP-P, AxP-P=(xmax-xmin)); thus they were calculated for the presented time histories (Table 1). As is evident from the obtained results, the presented amplitudes rise over two times. Moreover, the increases are the largest for peak-to-peak amplitude and z-direction, thus, these amplitudes should be used as a state indicator (e.g. A¨xP-P and A¨zP-P,).
Table 1Amplitudes of vibration obtained for three directions and two time instances
Time instances | t1=0 h | t2=65.472 h | ||||
Directions | x | y | z | x | y | z |
Average amplitude, m/s2 | 0.22 | 2.08 | 2.27 | 0.52 | 4.85 | 5.80 |
RMS amplitude, m/s2 | 0.28 | 2.57 | 2.83 | 0.66 | 6.05 | 7.29 |
Peak-to-peak amplitude, m/s2 | 1.95 | 17.99 | 20.96 | 5.28 | 46.51 | 57.34 |
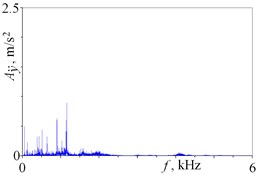
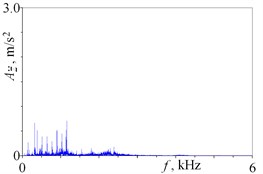
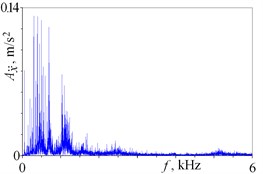
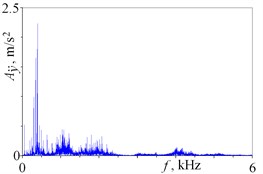
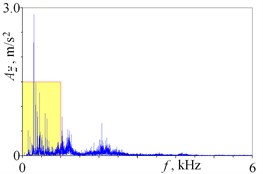
The time histories can be analysed with the Fourier transform, which provides an opportunity to find more state indicators and defects. As is evident from the obtained results, the largest amplitudes are observed for frequencies being below f<1 kHz; thus these peaks should be studied (Fig. 3). Some peaks are observed for frequencies being lager than f>1 kHz, and a number of them reflect natural frequencies, but they are not studied in this article. The spectrums obtained for y-direction and z-direction are similar. Nevertheless, the largest amplitude is observed for z-direction, and as A¨zP-P was indicated as a failure mode, this spectrum is studied below; whereas the shape of the spectrum presented in Fig. 3(d) suggests wear.
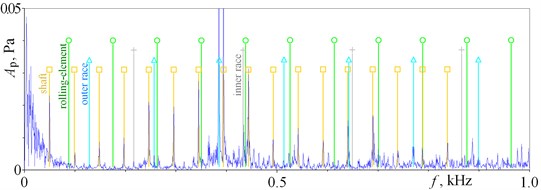
The magnified part of the spectrum obtained for the time history of acceleration ¨z and t2=65.472 h (Fig. 3(f)) is depicted below (Fig. 4). Characteristic defect frequencies (CDF) are indicated with vertical lines, which usually show good agreement with peaks in the spectrum. First, the shaft frequencies are indicated with squares and yellow lines; good agreement with peaks leads to conclusion, that the shaft was unbalanced or curved. Next, ball spin frequencies are indicated with circles and green lines; but they do not match, thus the rolling elements should be in good shape. Nevertheless, if a defect of ball does not touch a race, which is possible, then this defect is not observed. Then, the ball bearings passing frequencies outer race are indicated with triangles and sky blue lines. Good agreement between these frequencies and peaks suggests clearance and outer race defects. Finally, ball bearings passing frequencies of an inner race are indicated with crosses and grey lines, but they do not match well, because sleep changes frequencies. Summarising, defects of the shaft and outer race were found with spectral analysis.
Fig. 2Time histories of acceleration obtained for two time instances: a), b) c) t1= 0 h and d), e), f) t2= 65.472 h, and three directions x-y-z
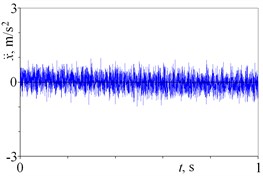
a)
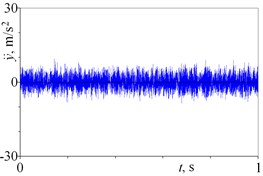
b)
c)
d)
e)
f)
Fig. 3Spectrums of time histories of acceleration obtained for two time instances: a), b) c) t1= 0 h and d), e), f) t2= 65.472 h and three directions x-y-z
a)
b)
c)
d)
e)
f)
3.2. Time histories of relative displacement
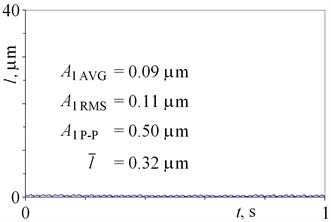
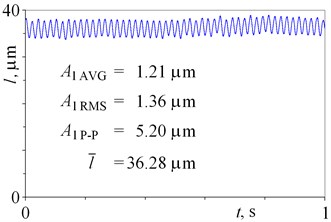
The time histories of the relative displacement between two housings l, which were measured with a LVDT (Linear Variable Differential Transformer) sensor (Fig. 1(b)), are depicted in Fig. 5. As is evident from the obtained results, amplitudes of vibration and average relative displacement ˉl rise. These amplitudes are over ten times lager for t2=65.472 h than for t1=0 h, and thus are good state indicators. Moreover, the average relative displacement ˉl provides an opportunity to estimate clearance. Nevertheless, shaft displacement is difficult to measure because the displacement is small, the shaft rotates, and the sensors are relatively large, thus proper sensors should be used. Because of these difficulties, this parameter is not usually measured.
Fig. 4Spectrum of time history of acceleration z¨ obtained for t2= 65.472 h
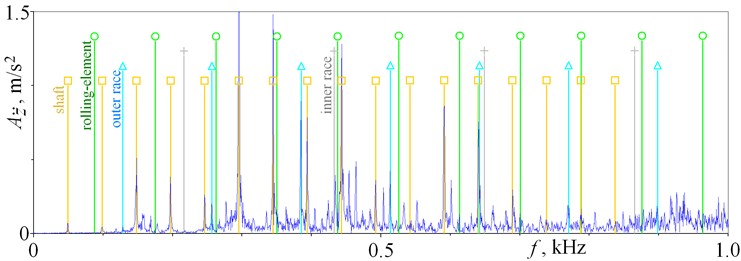
Fig. 5The time histories of the relative displacement between two housings obtained for two time instances a) t1= 0 h and b) t2= 65.472 h
a)
b)
3.3. The time histories of acoustic pressure and their spectrums
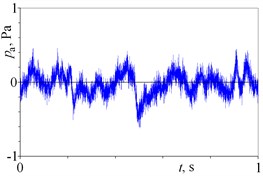
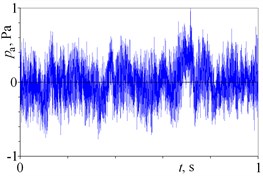
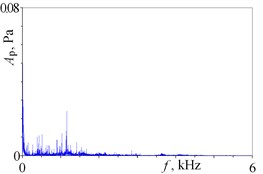
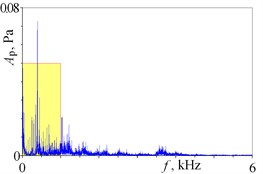
Acoustic pressure (noise) is usually neglected in machinery diagnostics, but in this section it has been studied. The time histories of acoustic pressure are depicted in Fig. 6(a), (b). As is evident from the obtained results, high frequency sounds are louder for t2=65.472 h than for t1=0 h. Moreover, low frequency noise is large (Fig. 6(a)), thus filtration and the Fourier transform should be used to obtain more information. The spectrums of the time histories of acoustic pressure (Fig. 6(c), (d)) are similar to the spectrums of the time histories of acceleration (Fig. 3), and thus should be analysed. The spectrum presented in Fig. 6(e) is very similar to the one in Fig. 4, and shows good agreement with characteristic defect frequencies. Defects of the shaft, outer race and inner race are obvious, whereas defects of the rolling elements are difficult to find. As is evident from the presented results, sounds emitted by this test stand provide valid information, which was not expected. Nevertheless, a microphone measures sounds emitted by all test stand, thus indication of defective rolling bearings is difficult. This is a disadvantage of this method.
3.4. Thermo-graphic analysis
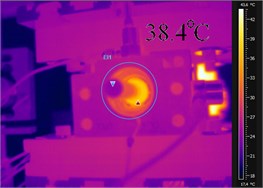
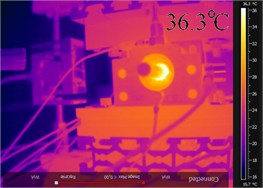
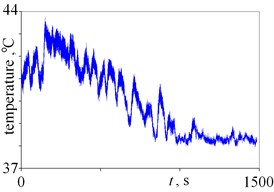
Temperature distribution is depicted in Fig. 7(a), (b). As is evident from the obtained results, the maximal temperature of a rolling bearing dropped from 38.4 °C to 36.3 °C. Moreover, the natural fluctuation of temperatures observed during twenty minutes is 5.8 °C (Fig. 7(c)). Finally, a number of factors influence the obtained results, for example, the loading force, lubricant parameters, air temperature, surface effects and thermal emissivity; thus temperature is not the best state indicator.
Fig. 6The time histories of acoustic pressure obtained for two time instances: a) t1= 0 h and b) t2= 65.472 h and their spectrums obtained for time instances: c) t1= 0 h and d), e) t2= 65.472 h
a)
b)
c)
d)
e)
Fig. 7Thermo-graphic pictures obtained with a FLIR AX5 camera for a) t1= 0 h and b) t2= 65.472 h, and temperature fluctuation of rolling bearings measured for c) t= 3.61 h
a)
b)
c)
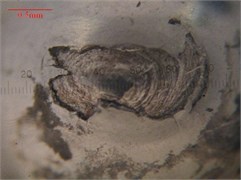
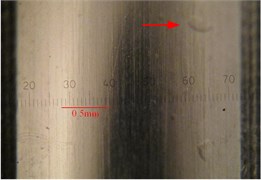
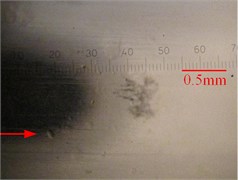
Fig. 8Surfaces of: a) a ball, b) outer race, c) inner race
a)
b)
c)
3.5. Microscopic investigation
Microscopic investigation of rolling bearings, which was executed after the tests, provides valid information. It provides an opportunity to see the real defects. Fatigue of the balls (pitting) is depicted in Fig. 8(a). In consequence, defective balls and their fragments defect the inner race and outer race, thus indentations are observed in Fig. 8(b), (c). Finally, wearing of the shafts was found. These defects-apart from the defected balls, were found with spectral analysis (see Figs. 4, 6(e)), which shows good agreement between signals and the found defects. Thus, spectral analysis is very useful.
4. Conclusions
A number of signals were measured and analysed, which leads to the following conclusions.
• Accelerations of housing provide valid information, and reflect degradation of rolling bearings. Peak-to-peak amplitudes rise over two times, see e.g. A¨xP-P and A¨zP-P; whereas the spectrum of acceleration provides an opportunity to find defective elements based on characteristic frequencies. Three defective elements were found.
• The relative displacement between two housings is a very good state indicator. The amplitudes rise over ten times, and are thus sensitive to the destruction process. Moreover, an increase of clearance can be estimated. Nevertheless, shaft displacement is difficult to measure because: displacement is small – just a few m, shaft rotates, and sensors are relatively large. Therefore, sensor selection is a key factor.
• Sounds emitted by this test stand provide valid information, especially in the spectrum, which was not expected. This source of information was usually neglected in machinery diagnostics, but nowadays is studied.
• The temperature of the rolling bearings is not the best state indicator, because is not very sensitive to defects. Moreover, loading force, lubricant parameters, air temperature, surface effects and thermal emissivity influence any obtained results.
Summarising, there are good agreement between defects and signals, which leads to the conclusion that the presented results and methods are valid.
References
-
Cempel C. Diagnostyka Wibroakustyczna Maszyn (Vibration Diagnostics of Machines), PWN, Warsaw, 1989, (in Polish).
-
Kostek R. Simulation and analysis of vibration of rolling bearing. Key Engineering Materials, Vol. 588, 2013, p. 257-265.
-
Żółtowski B., Castaneda L. Sistema portail de diagnostico para el sistema metro de Medellin. 8th Congresso International de Mantenimiento, Bogota, Columbia, 2006.
-
Żółtowski M. Investigations of harbour brick structures by using operational modal analysis. Polish Maritime Research, Vol. 21, 2014, p. 42-54.
-
Żółtowski M. Assessment state of masonry components degradation. Applied Mechanics and Materials, Vol. 617, 2014, p. 142-147.
-
Żółtowski B., Żółtowski M. Vibrations in the assessment of construction state. Applied Mechanics and Materials, Vol. 617, 2014, p. 136-141.
-
Żółtowski M., Żółtowski B., Castaneda L. Study of the state Francis Turbine. Polish Maritime Research, Vol. 20, 2013, p. 41-48.
-
Zhang Z., Chen Y., Cao Q. Bifurcations and hysteresis of varying compliance vibrations in the primary parametric resonance for a ball bearing. Journal of Sound and Vibration, Vol. 350, 2015, p. 171-184.
-
Kostek R. Direct numerical methods dedicated to second-order ordinary differential equations. Applied Mathematics and Computation, Vol. 219, 2013, p. 10082-10095.
-
Kostek R. An analysis of the primary and superharmonic contact resonances – part 2. Journal of Theoretical and Applied Mechanics, Vol. 51, 2013, p. 687-696.
-
Krzemiński-Freda H. Łożyska Toczne (Bearings). PWN, Warsaw, 1985, p. 51-66, (in Polish).
