Abstract
Vibration-based non-destructive testing (NDT) is one of the most widely used diagnostic methods of composite structures. The parameters of modal analysis may affect the accuracy of damage detectability, localization and identification. The aim of this paper is to investigate an influence of such parameters on results obtained after modal analysis of a composite structure and wavelet-based processing. Four parameters were taken into consideration: a frequency resolution of a frequency response function, a number of averaging cycles, a type of an excitation signal and a number of measurement points. The series of tests were performed on a composite sandwich structure with a honeycomb-type core using scanning laser Doppler vibrometer. The discussed results can be considered as recommendations for performing NDT of composite structures using vibrations in terms of parameters of modal analysis.
1. Introduction
Composite structures have a widespread application in engineering constructions due to their very well strength properties with a simultaneous low mass as well as corrosion and fatigue resistance. These major advantages enable application of composite elements in many branches of industry, such as automotive, marine, aircraft and aerospace ones, where high safety and reliability of constructions are extremely required. Therefore, structural diagnostics of composites and thus early detection of the possible damage occurrence is very important both at the manufacturing stage as well as during their operation. Damage may cause changes in structural parameters, namely the local changes of mass, damping, stiffness and flexibility of a structure, which are taken into consideration during structural damage identification (SDI). One of the most widely used non-destructive testing (NDT) methods developed to-date is a group of techniques based on measurements of vibrations.
The common vibration-based NDT methods are based on natural vibration characteristics of a structure. Following the categorization proposed by Yan et al. in [1], they cover techniques based on change of natural frequencies, used e.g. in [2-4], mode shapes [5, 6], change of structural flexibility [7] or stiffness [8], frequency-response functions [9], statistic information [10] and power flow [11]. A review of more examples of approaches can be found in [12, 13]. Regarding the methods of data acquisition, i.e. performing the measurements of vibrations, the most widely used sensors employed in modal testing are accelerometers, applied e.g. in [14]. They allow for quick testing, however it is performed in a contact manner, which causes a mass of an accelerometer to have an influence on a vibration response of a tested structure. This drawback may cause hiding of the information about damage presence and its location. Several other factors may also affect the measurement accuracy, namely requirements for cable connections, environmental temperature, electrical inference, etc. An alternative to accelerometers is a laser Doppler vibrometer (LDV), often used by the first author of this paper [15-18] and other researchers, e.g. [19, 20], in structural damage assessment problems. Using LDVs is time-consuming but has a very valuable advantage since a laser beam is employed for measurements which makes this method non-contact. Elimination of influence of measurement device on a tested structure allows for significant improvement of a quality of measured vibration signals. For the aim of obtaining the highest possible accuracy of the measurements, tested structures must be prepared in order to ensure their appropriate reflectivity by adhering a reflective tape to their top or covering them with an anti-glare spray. Another testing approach can be performed with use of measurements devices that are embedded into a structure, e.g. piezoelectric patches and transducers (PZTs) [21, 22] and fiber Bragg grating sensors (FBGs) [23, 24]. These are capable not only for SDI problems but also for continuous structural health monitoring (SHM). Damage identification using such sensors is based on observation of a character of propagation of inputted waves in tested structures. Any disturbs in these waves may indicate a damage presence. The two latter methods, however, besides their high accuracy, are capable to analyze only a structure in which sensors were previously located (during the manufacturing). Their application to other structures subjected to testing is not possible if the sensors were not stored inside the structure at the manufacturing stage. This is a serious drawback of such an approach.
Since identifying damage in composite structures is very important at its earliest possible stage of initiation, to prevent its further propagation, even the smallest structural changes are necessary to be detected. The vibration-based testing methodology is generally global, i.e. the measured characteristics are related to the entire tested structure. Thus, using such the approach, only damage detection is theoretically possible. In practice, a great variation of structural properties of composites, e.g. dependence of manufacturing parameters, make the global approach inefficient. In order to make the vibration-based methods local, i.e. with a possibility of damage localization and identification, advanced signal processing methods should be applied to modal shapes. Among numerous signal processing techniques, the wavelet transform is one of the most suitable due to its very high sensitivity to local singularities in signals. Owing to this advantage, wavelet transform has been employed in many researches on SDI and SHM, e.g. [25-27] as well as numerous works of the first author of this paper, summarized in the review paper [28].
Nevertheless, effectiveness of damage detection in composite elements using modal analysis depends on its parameters, which are the subject of this paper. One of the crucial factors which may have a significant influence on accuracy of damage detection is a sampling distance, i.e. the number of measurement points in a grid set to determine a scanning area of a tested structure. The preliminary studies on influence of density of sampling in SDI problems in beam-like structures using wavelet analysis have been reported. Ho and Ewins [29] investigated the influence of sampling distance on damage index, defined as the ratio of the modal stiffness of the damaged structure to the undamaged one. They found that the lower spatial resolution of mode shapes, the lower sensitivity of a damage index to damage it is. Hong et al. [30] studied the effectiveness of a wavelet transform in damage detection by means of its capability to estimate the Lipschitz exponent. The results showed that insufficient number of sampling points may lose relevant information that may indicate damage presence. The same conclusions were reported in the study of Douka et al. [31]. The research of Zhong and Oyadiji [32], based on empirical observations, confirmed that lower spatial sampling distance provides higher accurate crack location. However, since modal analysis of a structure with a dense net of measurement points is time-consuming, setting the largest possible number of measurement points is not a proper solution. Sazonov and Klinkhachorn [33] proposed the formulas determining the optimal sampling distance that minimize the effects of measurement noise and maximize sensitivity to damage and accuracy of damage localization.
The second important parameter that may affect accuracy of damage detectability is a type of selected excitation function, which is the mathematical signal used for the input to excite a structure by a measurable dynamic force. For the purpose of excitation of a structure various signals can be employed. In general, excitation methods can be divided into random techniques (these are pure-random, pseudo-random and periodic-random ones), sinusoidal testing (swept-sine, chirp – i.e. logarithmically swept sinewave) and transient testing (impact – hammer tests, step relaxation tests). A detailed comparison of these methods can be found in a study of Ramsey [34], related to testing of a linear system, where among above mentioned excitation types all of them, except for pure random, gave correct results whereas for systems with distortion, periodic random turned out to be the most advantageous. Another examples connected with use of excitation functions are modal tests of beams, where Rucevskis and Wesolowski [35] as well as Cao and Qiao [36] used a periodic chirp (sweep sine) signal, and tests of plates of the first author of this paper [15] where a pseudo-random noise was applied. There are no strict recommendations for the type of excitation to use in SDI problems.
Another important parameter is a frequency resolution of a frequency response function (FRF). The frequency resolution of the analysis determines the accuracy of the frequency measurement. Better accuracy can be reached by reducing the frequency range of the baseband measurement. This aspect was also undertaken in the study of Ramsey [34], where the author draws attention to the necessity of selection of the adequate frequency resolution for achieving reliable results. However, for the best of authors’ knowledge, a study on influence of a value of this parameter on damage detectability has not been investigated yet.
Finally, accuracy of damage detection using modal analysis is also dependent on a number of averaging cycles of frequency responses. For the aim of reducing the statistical variance of a measurement performed with a random excitation function and reducing the effects of nonlinearities, it is essential to employ an averaging process. Therefore, by averaging obtained data several times, statistical reliability can be increased and random noise associated with nonlinearities reduced. Nevertheless, similarly to the previously described parameter, no study on the impact of a number of averaging on damage detectability in the investigated SDI problems has been found in available literature.
Taking into consideration that, for the best of authors’ knowledge, no comprehensive analysis has been developed to-date, which is targeted at influence of various parameters of modal analysis on damage detectability the authors decided to undertake such a study. There have been four parameters investigated: a frequency resolution, a number of averaging cycles, a type of excitation signal and a number of measurement points. The results of this analysis are recommendations for performing NDT of composite structures using vibrations in terms of parameters of modal analysis. Taking into account that carrying out the modal analysis is very time-consuming it is advisable to use such a set of parameters for which damage is sufficiently detectable but scanning does not last too long. Therefore, the authors intend to check the limits of values of parameters above which the results cease to be better. The recommendations are based on comparative studies obtained from measurements that have been accomplished by the experimental studies. Additional advantage of the presented study is that a two dimensional plate structure was tested, instead of one dimensional beams, which has not been investigated by any of the previously mentioned researchers.
2. Materials and methods
2.1. Sample structure
In order to test the parameters of modal analysis the composite sandwich structure with well-detectable damage was selected. The plate with spatial dimensions of 300×300 mm was manufactured and supplied by PPHU Surfpol (Rawa Mazowiecka, Poland). It consists a honeycomb-type core with a single cell diameter of 2.5 mm and a thickness of 3 mm manufactured from the aramid paper saturated by phenolic resin; and face sheets manufactured in the form of glass fiber-reinforced laminate made of plain weave glass fabric and epoxy resin LG 385 with a hardener HG 385 manufactured by GRM Systems s.r.o. (Olomouc, Czech Republic). A total thickness of a sandwich structure is 4.1 mm. The lamination process was performed following the vacuum-assisted resin transfer molding method.
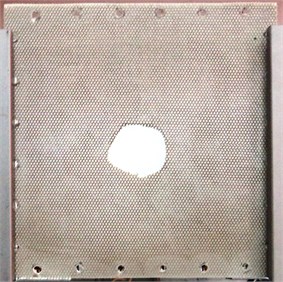
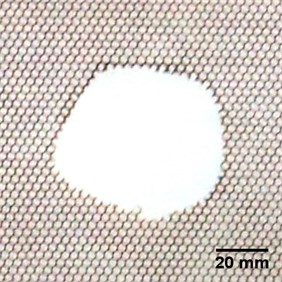
The artificial damage was introduced in the structure during the manufacturing process before the laying-up with face sheets in the form of local partial lack of a core with irregular boundary located in the geometrical center of the plate. An overall view of a tested plate as well as magnified photograph of a damage are shown in Fig. 1. 24 holes were drilled around the perimeter of the tested plate in order to clamp it on the boundary for vibration tests.
Fig. 1Overall view and magnification of the tested plate
2.2. Modal analysis and parametric studies
The vibration tests were performed using two LDVs, where the scanning LDV Polytec® PSV-400 was used for measurements of vibration velocity of a tested plate, while the point LDV Polytec® PDV-100 was focused on the surface of a clamping frame and used for reference measurements in order to separate vibrations of the tested structure and vibrations of the clamping frame. Due to clamping the scanning area of the plate was reduced to 250×250 mm. The scanning LDV was connected with a vibrometer controller Polytec® OFV-5000 with built-in velocity decoder and a PC. In order to ensure the good quality of measurement signal the tested plates were covered by Helling® anti-glare spray dedicated for the laser scanning. The clamping frame was mounted on the electrodynamic shaker TIRA® TV-51120 which excited the specimen by defined signal generated directly from the software dedicated for scanning LDV and amplified by the power amplifier TIRA® BAA 500. A photograph of the experimental setup is available in [18].
The performed parametric study covers an analysis of the following four parameters of modal analysis: frequency resolution of a FRF, number of averaging cycles in each measurement point, a type of excitation signal and a number of measurement points. As a reference set of parameters the following one was assumed: frequency resolution of 1 Hz, 5 averaging cycles, excitation by pseudo-random signal and 64×64 equidistant measurement points. The mentioned parameters were varied during experimental studies as follows: frequency resolution – 0.5, 1, 2, 4 and 8 Hz; number of averaging cycles – 3, 5, 8 and 10 cycles, considered excitation signals – pseudo-random, periodic chirp and white noise signals; number of measurement points – 16×16, 32×32, 64×64 and 128×128 points. In each tested case the frequency bandwidth was set in the range of 200-1600 Hz.
From the obtained FRFs the high-magnitude modal shapes were selected for the damage identification procedure using the following rule: if the magnitude of velocity of vibration was higher than 20 % of maximal magnitude in FRF, then the modal shape was taken into consideration, otherwise the modal shape was omitted in the tests due to high noise ratio, which may influence on the detectability of the damage. The selected modal shapes were imported into Matlab® environment for further processing.
2.3. Wavelet analysis and image processing
In order to identify the damage and evaluate its extent for the considered cases the single-level Undecimated Discrete Wavelet Transform (UDWT) was used. The selection of UDWT is justified by a lack of decimation procedure (the resulting sets of coefficients do not reduce their dimensions after decomposition) and shift invariance. The decomposition was performed using B-spline wavelet of order 2. In order to determine the damage extent correctly, the absolute values from the sets of detail coefficients of considered modal shapes (according to the aforementioned selection rule) were added up.
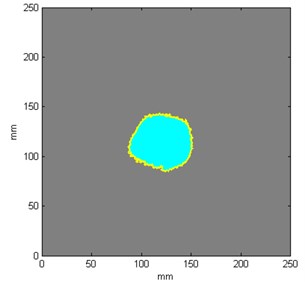
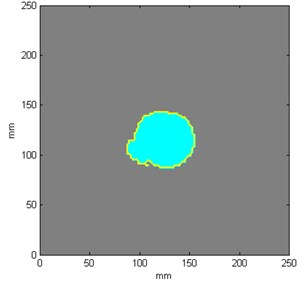
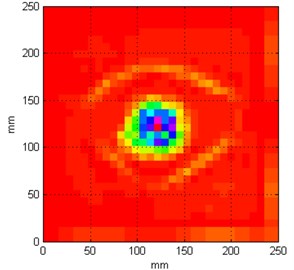
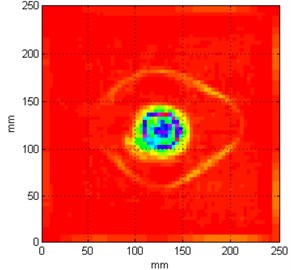
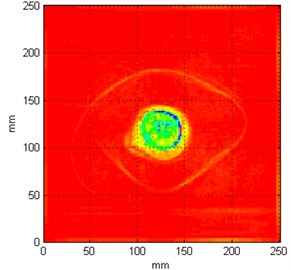
In the next step the true damage extent was determined from the photograph (see Fig. 1) and from the obtained sets of coefficients using methods of image processing in order to evaluate the differences between the true and identified damage extent. The procedure was as follows. Firstly, the image was normalized to the range of values of pixels of a grayscale image, i.e. to [0, 255]. Then, the resulting image was thresholded by several multi-levels using Otsu’s method [37]. This operation returned the image segmented into the undamaged regions and several separate damaged regions (depending on their colors as seen in Fig. 6). Then, the image was binarized by merging the segments of damaged regions together and separating them from the undamaged region (the background seen as red color with a yellow contour line in Fig. 6). A subsequent operation was morphological filling of small areas in order to eliminate some separate pixels that may have left from the background and remain only the region representing a hole inside the tested structure. The last step was to extract the boundary of this region and calculate its surface area in px2, which was afterwards converted into mm2. Exemplary results of determination of the true and identified damage extent are presented in Figs. 2(a) and 2(b), respectively. The above-presented procedure was used in the next studies focused on evaluation of influence of parameters of modal analysis on accuracy of damage identification.
Fig. 2Results of determination of a) true, b) identified damage extent
a)
b)
3. Results and discussion
3.1. Frequency resolution
The selection of an appropriate frequency resolution in the considered frequency range determines how accurately the resonance peaks are estimated. This, in turn, influences on the accuracy of estimation of a modal shape and its magnitude which have a direct connection with identification of a damage and determination of its extent. The analyses were performed following the description in Section 2.2 and the resulting FRFs are presented in Fig. 3 with accompanying values of natural frequencies for considered modal shapes stored in Table 1.
The obtained results show that the differences between natural frequencies acquired for various frequency resolutions are merely within the range of 0.1-1.2 %, which is thus of little significance. As far as the damage is concerned, in all cases it was detected and localized properly. The accuracy of the method was determined by correctness of damage identification, i.e. the precision of the attained damage extent. Since during wavelet transform the obtained sets of coefficients are blurred around the identified damage, which is caused by several factors (processing penalty caused by vanishing moments of applied wavelet as well as mechanical nature of a structural response in the area of local lack of a core which cause the extended structural softening), this effect expands the area indicating the damage presence in a resulting image. Taking this fact into consideration, damage index is expected to be higher than 100 %. Damage index is the ratio of the identified damage to the true damage extent, whereas the true damage of the tested plate has a surface area of 2720.47 mm2. However, resulting damage index should be close to 100 %, the more the results are far from this value (both much higher or much lower) the less accurate identification it is. In the following study in this subsection, the damage extent for various frequency resolutions was identified approximately as between 3754-3967 mm2, which represents the damage index of about 138-146 %. The best results were obtained for 2 Hz and 1 Hz. However, no linear trend (neither declining nor increasing) can be observed which means that setting a high frequency resolution will not ensure better results in damage identification. The authors conclude that there is no need of selecting a high frequency resolution, which significantly reduces the duration of analysis.
Fig. 3FRFs for the tested structure determined with various frequency resolution
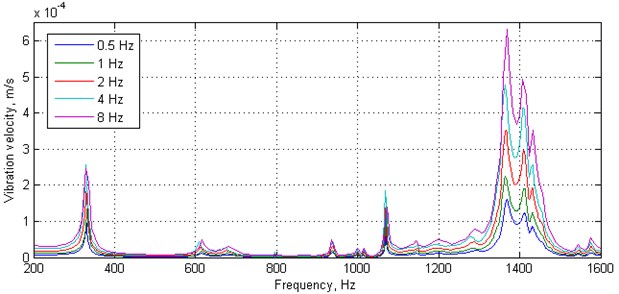
Table 1Comparison of natural frequencies and determined damage extent – frequency resolution
Frequency resolution | Mode 1, Hz | Mode 2, Hz | Mode 3, Hz | Mode 4, Hz | Mode 5, Hz | Damage extent, mm2 | Damage index, % |
0.5 Hz | 330.5 | 1070 | 1370 | 1412 | 1432 | 3890.99 | 143.03 |
1 Hz | 332 | 1069 | 1365 | 1411 | 1431 | 3773.53 | 138.71 |
2 Hz | 330 | 1070 | 1366 | 1410 | 1430 | 3753.66 | 137.98 |
4 Hz | 328 | 1069 | 1364 | 1408 | 1432 | 3952.03 | 145.27 |
8 Hz | 328 | 1072 | 1368 | 1408 | 1432 | 3967.29 | 145.83 |
3.2. Number of averaging cycles
The number of averaging cycles during modal analysis means that every defined measurement point is remeasured several times and the obtained FRFs are averaged. Obviously, when the number of averaging cycles increases a statistical variance of a measurement is reduced proportionally. The averaging allows reducing measurement noise and nonlinear effects as well as smoothing the resulting FRF, however this also increases the duration of measurements, and, as in the previous study, influences on the accuracy of determination of resonance peaks. In order to evaluate an influence of number of averaging cycles on damage detectability the next series of tests with parameters described in Section 2.2 were performed. The resulting FRFs are presented in Fig. 4 and the obtained natural frequencies for these cases are presented in Table 2.
Similarly, to the previously described tests, also in this case, differences between acquired natural frequencies are very small, namely in the range of 0.1-0.9 %. Damage extent and its index was identified as approximately between 3774-4013 mm2 and 139-148 %, respectively. These results show that a large number of averaging is not required since the best and simultaneously very similar results were obtained for averaging 5 and 10 times. It can be also noticed that there is a significant difference (almost 9 % of damage index) between averaging 3 and 5 times, which indicates that a 3 averaging cycles are not sufficient due to significant influence of measurement noise. Taking all observations into consideration, 5 averaging cycles turned out to be optimal since it has brought much better results than 3 and very similar results to the higher number of averaging cycles. Therefore, extending the duration of analysis by increasing the number of averaging cycles can be eliminated.
Fig. 4FRFs for the tested structure determined with various number of averaging cycles
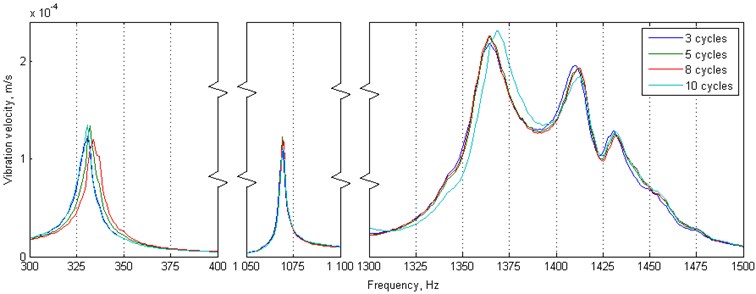
Table 2Comparison of natural frequencies and determined damage extent – averaging cycles
No. of average cycles | Mode 1, Hz | Mode 2, Hz | Mode 3, Hz | Mode 4, Hz | Mode 5, Hz | Damage extent, mm2 | Damage index, % |
3 | 331 | 1069 | 1364 | 1410 | 1431 | 4013.06 | 147.51 |
5 | 332 | 1069 | 1364 | 1411 | 1431 | 3773.53 | 138.71 |
8 | 334 | 1069 | 1364 | 1413 | 1432 | 3799.44 | 139.66 |
10 | 331 | 1070 | 1368 | 1413 | 1431 | 3768.92 | 138.54 |
3.3. Type of excitation signal
The influence of a type of excitation signal on resulting FRFs, modal shapes, and consequently, damage detectability is studied in this section. In order to excite a tested structure in a broad frequency band the input signal should be non-stationary. Usually, three types of signals are used for an excitation (mentioned in Section 2.2). Additionally, a transient signal can be used to excite a structure, however such excitation is applied during impact hammer tests, and considering the large number of measurement points during structural damage identification tests impact hammer testing is not appropriate and was not considered in this study. All of the considered signals allow exciting many modes of a structure simultaneously, however each of the considered excitation signals provides different valuable properties. The pseudo-random signal allows minimizing leakages resulting from Fast Fourier Transform (FFT) and it is one of the fastest ways to achieve statistically accurate transfer function. The main drawback of this excitation signal is that it always repeats with every measurement cycle, thus the reduction of distortions and nonlinearities as a function of number of averaging cycles is slow. The periodic chirp is a sine signal with variable frequency. This signal has the advantages of a pseudo-random signal and additionally allows for effective reduction of distortions and nonlinearities. Its only drawback is that testing using this type of signal is not as fast as when using pseudo-random signal. The white noise signal is a pure random signal whose main drawbacks are difficult control and leakages. The first drawback means that a tested structure is not excited in an optimum manner since the white noise signal is not periodic. The second one is also connected with periodicity, i.e. due to this property FRFs contain leakages resulting from FFT.
Analyzing the obtained FRFs in Fig. 5 one can observe that the most disturbances are observable for the white noise signal, while the smoothest FRF was obtained for pseudo-random signal. The natural frequency values in the most cases are the same. One can also observe that in the case of periodic chirp the 5th considered mode is poorly detectable which makes the pseudo-random signal the best candidate for structural damage identification in the light of accuracy of a frequency response.
Fig. 5FRFs for the tested structure determined with various types of excitation signal
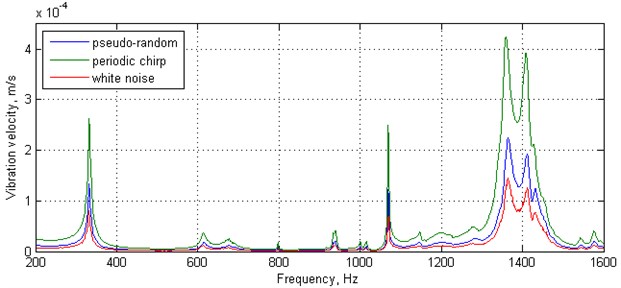
Table 3Comparison of determined damage extent and index with various types of excitation signal
Excitation signal | Damage extent, mm2 | Damage index, % |
Pseudo-random | 3773,53 | 138.71 |
Periodic chirp | 3662,11 | 134.61 |
White noise | 1693,73 | 62.26 |
The obtained results of damage extent and damage index (see Table 3) confirmed that the white noise signal is not adequate to use in modal analysis of structures since it has brought a poor damage detectability (only approx. 62 % of the true damage extent, i.e. almost 1694 mm2, was identified). The periodic chirp and pseudo-random signals returned very good and similar results (about 3662 mm2 and 3774 mm2, which represent damage index of 135 % and 139 %, respectively).
3.4. Number of measurement points
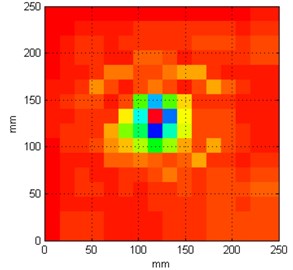
The number of measurement points has the most crucial influence on damage detectability comparing to the previously discussed parameters. By increasing the number of measurement points the accuracy of damage identification increases, however this growth is connected with extension of duration of measurements and in the case of testing of 2D structures this increase is in power relation with number of measurement points. In order to evaluate how this parameter influences on damage detectability series of tests with parameters described in Section 2.2 were performed. The resulting sets and the accompanying estimates of damage extent are presented in Fig. 6 and Table 4, respectively.
Analyzing the results summarized in Table 4 one can see a strong influence of a number of measurement points on accuracy of damage identification. There is a clear linear trend observed – the more measurement points the better results in damage identification it is. The best efficiency were obtained for the test with the grid of 128×128 measurement points, which returned the closest damage extent (almost 3055 mm2) to the true damage, representing its 112 %. Results for a grid of 64×64 measurement points could also be regarded as satisfactory since a shape of damage also can be identified (see Fig. 6(c)), however blurring of resulting set of coefficients is still much greater (damage extent is larger by 718.8 mm2 when compared to the previously described case). The grids of measurement points with 16×16 or 32×32 have brought the results of a poor quality and much distorted damage extent. Nevertheless, such parameters could be applied in some initial stages of NDT, when it would be necessary just to detect a damage quickly and exact localization and identification would not be then required.
Table 4Comparison of determined damage extent with various grids of measurement points
Grid of measurement points | Damage extent, mm2 | Damage index, % |
16×16 | 5615.23 | 206.41 |
32×32 | 4455.57 | 163.78 |
64×64 | 3773.53 | 138.71 |
128×128 | 3054.73 | 112.29 |
Fig. 6Resulting sets of coefficients for different grid of measurement points
a) 16×16
b) 32×32
c) 64×64
d) 128×128
4. Conclusions
The presented study covers analysis of influence of parameters of modal analysis on accuracy of damage detectability in composite plates. As an example, the composite sandwich structure with a honeycomb-type core was tested using scanning LDV. The influence of four parameters on damage detectability were studied: a frequency resolution of a FRF, a number of averaging cycles, a type of an excitation signal and a number of measurement points. The obtained results show that increasing the frequency resolution does not bring better results and no tendency could be observed regarding the identification of damage extent. Taking into consideration the fact that an increase of the frequency resolution is associated with an increase of the duration of analysis, no high frequency resolution is needed to determine proper damage extent. From the tested numbers of averaging cycles, 5 turned out to be optimal since it has brought much better results than for averaging 3 times and very similar results for higher numbers of averaging. Regarding again the duration of analysis it is not necessary to average measurements more than 5 times. Another finding are that pseudo-random noise and periodic chirp are the best choices for a type of excitation signal, whereas a white noise turned out to be unsuitable. The last series of tests proved the expected outcomes that the more measurement points the better results in damage identification it is. One can conclude that the most important parameter of the mentioned ones is a density of measurement points, and the value of this parameter can be increased by the cost of decreasing the others in order to obtain the most accurate results in suitable time. The authors hope that the presented study will help other researchers in determining the optimal parameters of modal analysis of structures depending on their needs, i.e. whether one needs to obtain accurate damage identification or just initial, imprecise but fast damage detection.
References
-
Yan Y. J., Cheng L., Wu Z. Y., Yam L. H. Development in vibration-based structural damage detection technique. Mechanical Systems and Signal Processing, Vol. 21, 2007, p. 2198-2211.
-
Ferreira A. J. M., Fasshauer G. E. Analysis of natural frequencies of composite plates by an RBF-pseudospectral method. Composite Structures, Vol. 79, 2007, p. 202-210.
-
Xu G. Y., Zhu W. D., Emory B. H. Experimental and numerical investigation of structural damage detection using changes in natural frequencies. ASME Journal of Vibration and Acoustics, Vol. 129, 2007, p. 686-700.
-
Thalapil J., Maiti S. K. Detection of longitudinal cracks in long and short beams using changes in natural frequencies. International Journal of Mechanical Sciences, Vol. 83, 2014, p. 38-47.
-
Pandey A. K., Biswas M., Samman M. M. Damage detection from changes in curvature mode shapes. Journal of Sound and Vibration, Vol. 145, Issue 2, 1991, p. 321-332.
-
Roy K., Ray-Chaudhuri S. Fundamental mode shape and its derivatives in structural damage localization. Journal of Sound and Vibration, Vol. 332, Issue 21, 2013, p. 5584-5593.
-
Pandey A. K., Biswas M. Damage detection in structures using changes in flexibility. Journal of Sound and Vibrations, Vol. 169, Issue 1, 1994, p. 3-17.
-
Yan A. M., Golinval J. C. Structural damage localization by combining flexibility and stiffness methods. Engineering Structures, Vol. 27, Issue 12, 2005, p. 1752-1761.
-
Sampaio R. P. C., Maia N. M. M., Silva J. M. M. Damage detection using the frequency-response-function curvature method. Journal of Sound and Vibration, Vol. 226, Issue 5, 1999, p. 1029-1042.
-
Fugate M. L., Sohn H., Farrar C. R. Vibration-based damage detection using statistical process control. Mechanical Systems and Signal Processing, Vol. 15, Issue 4, 2001, p. 707-721.
-
Li T. Y., Zhang T., Liu J. X., Zhang W. H. Vibrational wave analysis of infinite damaged beams using structure-borne power flow. Applied Acoustics, Vol. 65, Issue 1, 2004, p. 91-100.
-
Fritzen C.-P. Vibration-based structural health monitoring – concepts and applications. Key Engineering Materials, Vols. 293-294, 2005, p. 3-20.
-
Doebling S. W., Farrar C. R., Prime M. B. A summary review of vibration-based damage identification methods. The Shock and Vibration Digest, Vol. 30, 1998, p. 91-105.
-
Ratcliffe C., Heider D., Crane R., Krauthauser C., Yoon M. K., Gillespie Jr. J. W. Investigation into the use of low cost MEMS accelerometers for vibration based damage detection. Composite Structures, Vol. 82, 2008, p. 61-70.
-
Katunin A. Damage identification in composite plates using two-dimensional B-spline wavelets. Mechanical Systems and Signal Processing, Vol. 25, Issue 8, 2011, p. 3153-3167.
-
Katunin A. Identification of stiff inclusion in circular composite plate based on quaternion wavelet analysis of modal shapes. Journal of Vibroengineering, Vol. 16, Issue 5, 2014, p. 2545-2551.
-
Katunin A. Stone impact damage identification in composite plates using modal data and quincunx wavelet analysis. Archives of Civil and Mechanical Engineering, Vol. 15, Issue 1, 2014, p. 251-261.
-
Katunin A. Vibration-based spatial damage identification in honeycomb-core sandwich composite structures using wavelet analysis. Composite Structures, Vol. 118, 2014, p. 385-391.
-
Stanbridge A. B., Ewins D. J. Modal testing using a scanning laser Doppler vibrometer. Mechanical Systems and Signal Processing, Vol. 13, Issue 2, 1999, p. 255-270.
-
Siringoringo D. M., Fujino Y. Experimental study of laser Doppler vibrometer and ambient vibration for vibration-based damage detection. Engineering Structures, Vol. 28, Issue 13, 2006, p. 1803-1815.
-
Katunin A., Dragan K., Dziendzikowski M. Damage identification in aircraft composite structures: A case study using various non-destructive testing techniques. Composite Structures, Vol. 127, 2015, p. 1-9.
-
Chierichetti M., Grappasonni C., Coppotelli G., McColl C. A modal approach for dynamic response monitoring from experimental data. Mechanical Systems and Signal Processing, Vol. 48, Issues 1-2, 2014, p. 199-217.
-
Measures R. M. Smart composite structures with embedded sensors. Composites Engineering, Vol. 2, Issues 5-7, 1992, p. 597-618.
-
Capoluongo P., Ambrosino C., Campopiano S., Cutolo A., Giordano M., Bovio I., Lecce L., Cusano A. Modal analysis and damage detection by fiber Bragg grating sensors. Sensors and Actuators A, Vol. 133, 2007, p. 415-424.
-
Yan Y. J., Yam L. H. Online detection of crack damage in composite plates using embedded piezoelectric actuators/sensors and wavelet analysis. Composite Structures, Vol. 58, Issue 1, 2002, p. 29-38.
-
Bayissa W. L., Haritos N., Thelandersson S. Vibration-based structural damage identification using wavelet transform. Mechanical Systems and Signal Processing, Vol. 22, 2008, p. 1194-1215.
-
Fan W., Qiao P. A 2-D continuous wavelet transform of mode shape data for damage detection of plate structures. International Journal of Solids and Structures, Vol. 46, Issues 25-26, 2009, p. 4379-4395.
-
Katunin A. Nondestructive damage assessment of composite structures based on wavelet analysis of modal curvatures: state-of-the-art review and description of wavelet-based damage assessment benchmark. Shock and Vibration, 2015, p. 735219, (in Press).
-
Ho Y. K., Ewins D. J. Numerical evaluation of the damage index. 2nd International Workshop on Structural Health Monitoring, 1999, p. 995-1011.
-
Hong J.-C., Kim Y. Y., Lee H. C., Lee Y. W. Damage detection using the Lipschitz exponent estimated by the wavelet transform: applications to vibration modes of a beam. International Journal of Solids and Structures, Vol. 39, Issue 7, 2002, p. 1803-1816.
-
Douka E., Loutridis S., Trochidis A. Crack identification in beams using wavelet analysis. International Journal of Solids and Structures, Vol. 40, Issues 13-14, 2003, p. 3557-3569.
-
Zhong S., Oyadiji S. O. Crack detection in simply supported beams using stationary wavelet transform of modal data. Structural Control and Health Monitoring, Vol. 18, Issue 2, 2011, p. 169-190.
-
Sazonov E., Klinkhachorn P. Optimal spatial sampling interval for damage detection by curvature or strain energy mode shapes. Journal of Sound and Vibration, Vol. 285, Issues 4-5, 2005, p. 783-801.
-
Ramsey K. A. Effective measurements for structural dynamics testing – part 2. Sound and Vibration, Vol. 10, Issue 4, 1976, p. 18-31.
-
Rucevskis S., Wesolowski M. Identification of damage in a beam structure by using mode shape curvature squares. Shock and Vibration, Vol. 17, Issues 4-5, 2010, p. 601-610.
-
Cao M., Qiao P. Integrated wavelet transform and its application to vibration mode shapes for the damage detection of beam-type structures. Smart Materials and Structures, Vol. 17, Issue 5, 2008, p. 055014.
-
Otsu N. A threshold selection method from gray-level histograms. IEEE Transactions on Systems, Man, and Cybernetics, Vol. 9, Issue 1, 1979, p. 62-66.
About this article
The presented research was partially financed by the National Science Centre (Poland) granted according the decision No. DEC-2011/03/N/ST8/06205 and from the statutory funds of the Faculty of Mechanical Engineering of the Silesian University of Technology.
