Abstract
The finite element model of dash panel was built and its reliability was then verified by the comparison between the simulation and the experimental results. Subsequently, FE-SEA simulation model of dash panel was built and then compared with the structure-acoustic coupling method as well as the experimental results. As a result, the superiority and reliability of FE-SEA method for predicting the sound insulation performance of dash panel are shown. In addition, the sound insulation performance of the original steel dash panel was also calculated and compared with magnesium alloy dash panel, and the results show that the sound insulation performance of magnesium alloy dash panel has reached the level of steel dash panel. The mentioned analysis shows that magnesium alloy material has a low noise characteristic and it can also achieve light-weight. Then, sound package was applied to dash panel to calculate its sound insulation performance, and the results are found that sound insulation performance is not significantly improved at low-frequency range. Reversely, it will be reduced with increasing of sound package thickness. However, improvement of sound insulation performance is very obvious at high frequency range. In order to evaluate the comprehensive performance in terms of noise reduction and lightweight, noise reduction efficiency was proposed and calculated. This research does also provide a reference for the acoustic design of magnesium alloy components.
1. Introduction
In recent years, the global automotive industry has achieved the goal of lightweight by using new materials. Aluminum alloy, magnesium alloy and the other light metals have gradually replaced the traditional steel bodies and been widely used in automotive field. The automotive industry has become a major drive for increasing of magnesium alloy application [1]. Magnesium alloy is featured with low density, high stiffness and strength, as well as excellent damping performance. As a result, it is widely used to reduce vibration and noise. Currently, magnesium alloy has been used successfully for dash panel. Many companies such as General Motors, Mercedes-Benz and Chrysler, have adopted dash panel with die-cast magnesium alloy [2]. In the near future, dash panel based on plastics, steel and the other materials will be replaced by magnesium alloy [3].
Dash panel is the barrier between engine and cab for an automotive, and sound insulation performance has a direct influence on ride comfort of passengers. As a result, design of sound insulation performance for dash panels is very important.
The finite element method (FEM) and boundary element method (BEM) as well as statistical energy analysis (SEA) method are very important techniques to predict sound insulation performance of structures at present. FEM and BEM can obtain an accurate result at low-frequency range. However, they may be failed to obtain a good result at high-frequency range because there are a lot of degrees of freedom and modals. SEA method is based on a large number of modal information and applicable to the high-frequency range with intensive modals. As a result, the accurate results can’t be obtained at low-frequency range with discrete modals. Hybrid finite element-statistical energy analysis (Hybrid FE-SEA) method was proposed by Shorter and Langley [4-5] to solve problems of mid-frequency. FE subsystem and SEA subsystem were built in Hybrid FE-SEA model, respectively. Sound insulation performance was solved through coupling between FE subsystem and SEA subsystem.
Vaz [6] solved problems of sound insulation performance at mid-frequency by using Hybrid FE-SEA method. Blanchet [7] have researched the radiated noise of the stiffened plates by means of Hybrid FE-SEA method. The current researches which mainly focused on problems of sound field at mid-frequency. However, sound transmission characteristics of the thin-walled components have not been attached enough attention at present, especially in automotive industry.
Sound insulation performance of magnesium alloy dash panel is predicted by using Hybrid FE-SEA method in this paper and then compared with the results which are calculated by using structure-acoustic coupling method and the experimental value. Then, magnesium alloy dash panel will be compared with steel structures with the same surface density in order to show its superiority. Finally, magnesium alloy dash panel is optimized through applying sound package. The comprehensive performance in terms of noise reduction and lightweight is evaluated by noise reduction efficiency. This research does also provide a reference for the acoustic design of magnesium alloy components.
2. Basic theories of FE-SEA method
2.1. Reciprocal relation between two subsystems
The system will be divided into many mesh elements when its dynamic response is analyzed by using the finite element method, and each node of the system will have displacement on its corresponding degrees of freedom. The displacement q of the boundary degree of freedom can be expressed as follows [8]:
f is the external excitation and D is the stiffness matrix.
The elastic waves generated by boundary harmonic vibration are propagated through the system and then reflected at the boundary. In the dynamic stiffness matrix D, the un-reflected part is defined as the direct dynamic stiffness matrix Ddir. There is a reverberation force frev between the boundary force Ddirq and the actual boundary force Dq:
Then, Eq. (2) is substituted into Eq. (1), and we can obtain the following formula:
The subscript rev represents “reverberation” and the subscript dir represent “direct”.
Based on the wave propagation theory, if sound field is a diffusion field, and then Eq. (4) and Eq. (5) can be obtained, as shown in the following:
where E[] is the mean value of all structures. E is the vibration energy of panel subsystems. n is the modal density of subsystems. The superscript T is the transposition of matrix. Im is the imaginary part. Eq. (5) shows the reciprocal relation of the diffusion field.
2.2. System equations of Hybrid FE-SEA method
The coupling effect between FE subsystem and SEA subsystem can be expressed by Eq. (5). And the response of the deterministic system can be expressed as the following formulas:
where Dd is the dynamic stiffness matrix of the finite element model subsystems. Sff is the cross spectrum of excitation forces which is applied to the finite element subsystem. D(k)dir is the average dynamic stiffness matrix of subsystem k. And Ek is the vibration energy of subsystem k. nk is the modal density of subsystem k. ω is the circular frequency. The subscript qq represents the deterministic system. The subscript ff represents cross spectrum. Both the subscript k and superscript (k) represent the kth subsystem. The subscript d represents the dynamic stiffness. The subscript t represents the total dynamic stiffness. Due to the power balance of each subsystem, the power balance equation of the FE-SEA coupling system is shown as Eq. (8) [9]:
where ηj is the damping loss factor of subsystem j. Pj is the input power of subsystem j. Pm,j is the input power generated by the force which was applied on the deterministic system. ηjk is the coupling loss factor of subsystems j and k. The subscripts j and k represent jth subsystem and kth subsystem, respectively. The energy response of the system can be obtained by Eq. (8), and the response of the deterministic system can be obtained by Eq. (6).
3. Verification of the finite element model for dash panel
Magnesium alloy dash panel is a die casting component and the wall thickness of the junction between the edge and the other components is 5 mm, which has been shown as green part in Fig. 1. A stiffener is fixed on dash panel, which has been shown as blue part in Fig. 1. Thickness of the other regions is 3 mm, which has been shown as red part in Fig. 1. Thickness of the entire dash panel structure is relatively uniform and it is also much smaller than the overall structure size. As a result, Tri3 and Quad4 elements were selected to obtain the finite element model of dash panel. Finally, 19,729 nodes and 19,665 elements were obtained for dash panel. Rbe2 element was selected to simulate the connection between dash panel and steel stiffener. The finite element model of dash panel has been shown in Fig. 1.
In order to verify the accuracy of the finite element model and the material definitions, free modal experiment of dash panel was carried out. Dash panel was suspended by elastic tethered to simulate the free boundary. The natural vibration frequency of the elastic tethered was much smaller than the first-order natural frequency of dash panel, and the influence of structure support on the experimental modal results was avoided. Vibration signal of one point was collected for each hit so as to avoid the influence of the additional mass and constraints generated from the excessive sensors on the measurement results.
Fig. 1The finite element model of dash panel
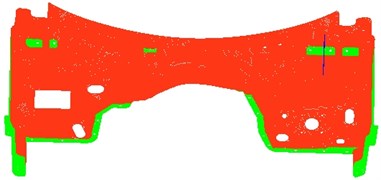
Table 1Comparison between the experimental modal and the simulation one of dash panel
Order | Experiment value / Hz | Simulation value / Hz | Relative error / % |
1 | 16.0 | 16.5 | 3.1 |
2 | 22.0 | 22.3 | 1.4 |
3 | 24.1 | 23.4 | –2.9 |
4 | 29.1 | 29.5 | 1.4 |
5 | 53.5 | 55.6 | 3.7 |
6 | 57.3 | 56.7 | –1.0 |
It is shown in Table 1 that the relative errors between experiment and simulation value are controlled within the allowable engineering range of 5 %. Consequently, it can be proved that the finite element model was reliable and can be used for the subsequent acoustic analysis.
Modes of the top-six orders have been extracted as shown in Fig. 2. It can be found that the most serious vibration areas of dash panel always appeared at both ends.
Fig. 2Modes of the top-six orders for dash panel
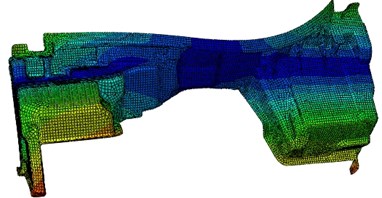
a) 16.5 Hz
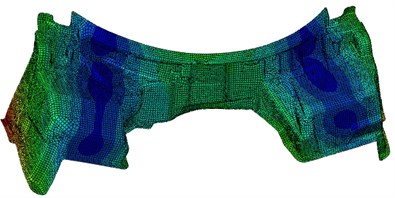
b) 22.3 Hz
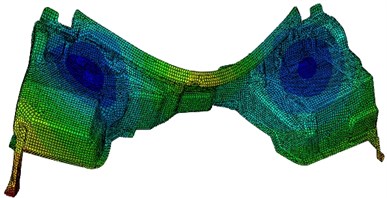
c) 23.4 Hz
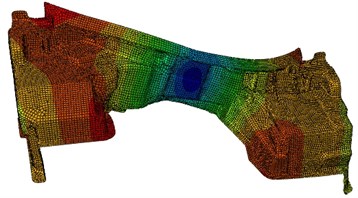
d) 29.5 Hz
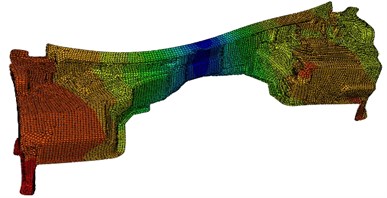
e) 55.6 Hz
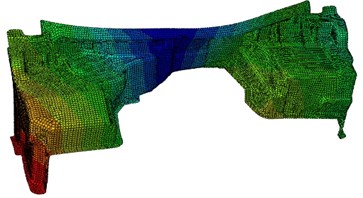
f) 56.7 Hz
4. Comparison of sound insulation performance between experiment and simulation for dash panel
Based on the finite element model, acoustic simulation model of magnesium alloy dash panel was built and then compared with the experimental results to predict its reliability.
4.1. Sound insulation performance experiment of dash panel
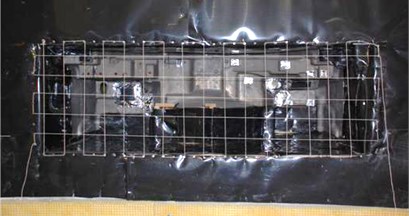
The experimental environment of sound insulation performance for magnesium alloy dash panel was composed of a reverberation chamber and anechoic chamber, as shown in Fig. 3. Magnesium alloy dash panel was fixed on the window between the reverberation chamber and anechoic chamber. To prevent the sound transmits to the anechoic chamber through the gap between dash panel and window, the chloroprene rubber was used to seal it. In order to make sure that the subsequent simulation can be achieved easily, dash panel was approximately in the free boundary during the experiment. In addition, silicone was used to seal some holes on dash panel to avoid sound leakage.
During the experiment, microphones were reasonably arranged in the reverberation chamber and anechoic chamber, respectively. And then the average incident sound pressure ¯pincident and transmission sound pressure ¯ptransmission of two rooms were measured. It should be emphasized that each microphone in the anechoic chamber should be placed on the imaginary hemispherical envelope surface which covered dash panel as far as possible. In this way, the sound pressure through the dash panel could be measured in all directions. Then, the averaging results were more reliable. A total of 132 microphones were arranged in the anechoic chamber. It was believed the wall between two rooms was rigid. Therefore, the sound field in the anechoic chamber was completely formed by the sound transmitted through the reverberation chamber. As a result, the sound pressure in the anechoic chamber was the transmission sound pressure completely.
Pink noise source was arranged in the reverberation chamber during the experiment. The sound pressure of each microphone was measured in the reverberation chamber and anechoic chamber when there was a stable reverberation effect in the reverberation chamber. Each data was recorded for 8 s and measured 3 times, and sampling frequency was 65536 Hz. Finally, the average sound pressures in two rooms were taken as the incident and transmission sound pressure, respectively, which was substituted to the following formula to calculate sound insulation performance [10]:
where S is the surface area of dash panel. S0 is the imaginary envelope surface area in the anechoic chamber.
Fig. 3The sound insulation performance experiment of dash panel
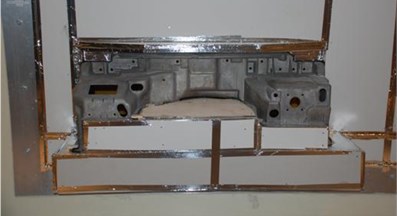
a) The side of the incident sound field (reverberation chamber)
b) The side of the transmission sound field (anechoic chamber)
4.2. Structure-acoustic coupling model of dash panel
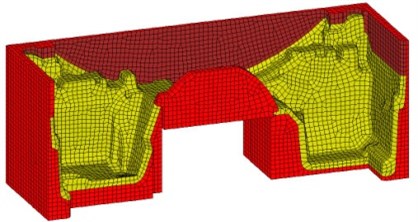
Based on the finite element model, structure-acoustic coupling model of dash panel was built to calculate sound insulation performance. The boundary element mesh model has been shown in Fig. 4(a), and the field point mesh model has been shown in Fig. 4(b).
Fig. 4Structure-acoustic coupling model of dash panel
a) Boundary element mesh model

b) Field point mesh model
4.3. FE-SEA model of dash panel
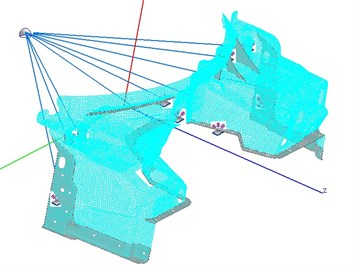
The mesh model was imported into the professional acoustics software to build FE subsystem of dash panel as shown in Fig. 5. Regions of different thickness were divided into the separate FE face, and finally dash panel was divided into nine FE faces. Then each FE face was applied a DAF and SIF to simulate the reverberation chamber and anechoic chamber, respectively [11]. Material parameters of magnesium alloy dash panel were consistent with the experimental one. The boundary condition was set as free boundary. Finally, Hybrid FE-SEA model of dash panel was obtained as shown in Fig. 6.
Fig. 5FE subsystem model
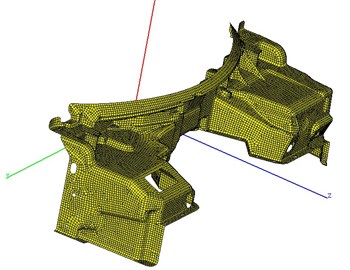
Fig. 6Hybrid FE-SEA model of dash panel
4.4. Comparison between simulation and experiment results
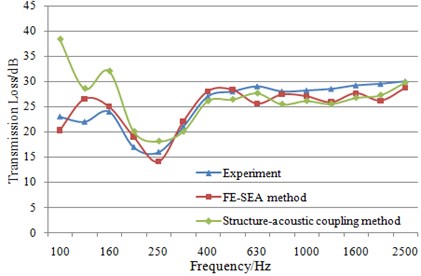
The simulation results were compared with the experimental one to verify the accuracy of the simulation model as shown in Fig. 7.
As seen from Fig. 7, results have a large difference between the structure-acoustic coupling method and experiment when analysis frequency was less than 200 Hz. In this frequency band, sound insulation performance of the structure is mainly determined by the boundary condition and modal density. During the experiment, dash panel is connected with windows by rubber, which is not a completely free boundary. Although the simulation model tries to simulate the experimental boundary condition as much as possible, the accurate results can’t be obtained. In addition, due to that there is high modal density in this band, and the structure-acoustic coupling method may not be applicable. Sound insulation performance of the structure will be less affected by the boundary condition when analysis frequency is more than 200 Hz, and the result accuracy calculated by structure-acoustic coupling method will be higher. Compared with the experimental values, sound insulation performance of dash panel predicted by FE-SEA method has a higher consistency. Although FE-SEA method can’t simulate the experimental boundary condition completely, its adaptability to the high modal density in this band is very stronger. In addition, FE-SEA method has added the excitation source to FE face directly, so that the sound can only be passed through dash panel structure rather than holes on dash panel, which is consistent with the experimental conditions. Therefore, FE-SEA method is better for calculating sound insulation performance of dash panel.
Fig. 7Comparison of sound insulation performance between simulation and experiment
5. Comparison of sound insulation performance between magnesium alloy and steel dash panel
Thickness of the original steel dash panel is 0.9 mm, so the surface density of magnesium alloy dash panel is 74 % of that of the steel dash panel. FE-SEA model was also built for steel dash panel. Elasticity modulus is 2.1×10¹¹ Pa. Poisson’s ratio is 0.30. Density is 7800 kg/m3, and the structural damping loss factor of steel is 3×10⁻⁴. Then, sound insulation performance of steel dash panel was obtained and compared with that of magnesium alloy dash panel, as shown in Fig. 8.
Fig. 8Comparison of sound insulation performance between two dash panels
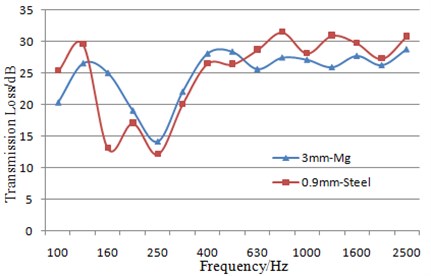
As shown in Fig. 8, steel dash panel has a good sound insulation performance at middle and high-frequency ranges. According to the acoustic theories, sound insulation performance at middle and high-frequency ranges depended on mass. Mass of magnesium alloy dash panel is 74 % of that of steel dash panel. As a result, sound insulation performance of magnesium alloy dash panel is lower than that of steel dash panel. However, the minimum value of magnesium alloy dash panel is higher than that of steel dash panel. At low frequency range, magnesium alloy dash panel has a better sound insulation performance. The reason is that magnesium alloy has a higher stiffness and its damping loss factor is three times of steel. Magnesium alloy dash panel will have a better sound insulation performance and better restraint for the low-frequency booming noise of the automotive. The overall sound insulation performance of magnesium alloy dash panel has also reached the requirements of the original steel dash panel.
6. Optimization of sound insulation performance for magnesium alloy dash panel
Acoustic optimization mainly includes the structural improvement and sound package, where the structural improvement is relatively difficult. As a result, sound package was selected to optimize magnesium alloy dash panel. It was shown in Fig. 9 that sound package was made of hard rubber, glass wool and dash panel.
Fig. 9The structure component of sound package
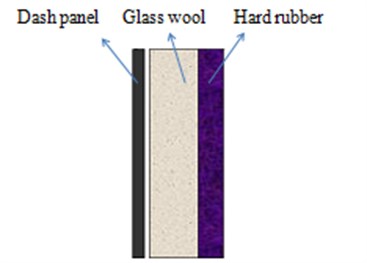
Three kinds of sound packages structures were designed, where thickness of hard rubber layers was 2 mm, glass wool layer was 5 mm, 10 mm and 20 mm, respectively.
Density of hard rubber layer is 1000 kg/m3. Young’s modulus is 2.3×10⁹ and Poisson’s ratio is 0.4896. Glass wool layer is made of sound-absorbing material. Fluid medium is air and fluid density is 1.225 kg/m3. Sound velocity of fluid is 340 m/s. Porosity is 0.99. Flow resistivity is 9000 rayl/m. Tortuosity factor of the structure is 1. Characteristic length of the viscoelasticity is 1.92×10⁻⁴ m. Thermodynamic characteristic length is 3.84×10⁻⁴ m. Material density is 16 kg/m3. Young’s modulus is 1×10⁵ and Poisson’s ratio is 0.3.
Three kinds of sound packages were applied to one side of dash panel, respectively. And then, the composite dash panel was obtained. Its FE-SEA model was built to predict sound insulation performance. Finally, the simulation results of three kinds of sound packages were compared with the bared dash panel, as shown in Fig. 10.
Fig. 10Comparison of sound insulation performance before and after applying sound package
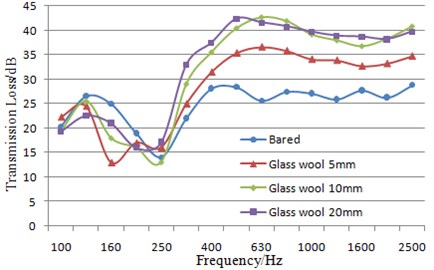
It can be seen from Fig. 10 that sound insulation performance is improved obviously at middle and high-frequency range after applying sound packages. The reason is caused by sound absorption effect of glass wool and vibration attenuation of damping materials. In addition, it can be also seen from Fig. 10 that sound insulation performance is not always improved with increasing of sound package thickness. Sound insulation performance generated by sound package which glass wool thickness is 10 mm and 20 mm is significantly better than that of 5 mm glass wool above 250 Hz. However, sound insulation performance generated by sound package of 10 mm and 20 mm is similar. In the range of 100-250 Hz, with increasing of glass wool thickness, sound insulation performance is weakened rather than enhanced, which proves that sound package doesn’t produce improvement for sound insulation performance at this frequency band. The main reason is that the composite dash panel at this frequency will generate resonance.
Currently, there are more and more requirements for lightweight. Therefore, the comprehensive performance of each scheme need be evaluated in terms of noise reduction and lightweight. To solve this problem, noise reduction efficiency was proposed as an evaluation index [12]. It is defined as the ratio between the increased average value of sound insulation performance and the increased mass when we have adopted some noise reduction measures:
where EM is the noise reduction efficiency (dB/kg). RdB is the increased average value of sound insulation performance. AM is the increased mass. The noise reduction efficiency of three kinds of sound packages was solved as Fig. 11. It could be seen from the figure that the noise reduction efficiency is largest when the glass wool thickness is 10 mm. This scheme is most prominent in terms of noise reduction and lightweight.
Fig. 11Comparison of noise reduction efficiency between three kinds of sound packages
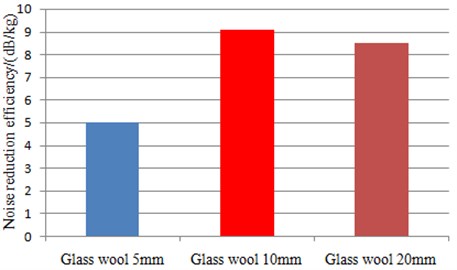
Fig. 12Sound pressure contour of dash panel before and after applying sound package
a) Sound pressure contour of the bared dash panel at 500 Hz
b) Sound pressure contour after applying sound package at 500 Hz
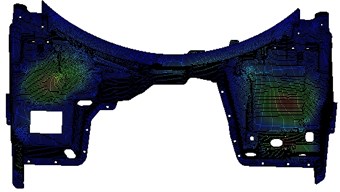
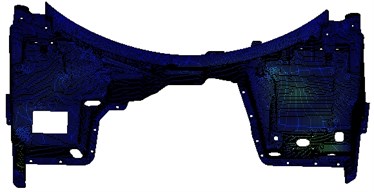
To further verify noise reduction effect which was made by sound packages, sound pressure contour of the composite dash panel which glass wool thickness was 10 mm was extracted and compared with that of the bared dash panel at 500 Hz, as shown in Fig. 12. Before applying sound package, there are two regions, and their sound pressure contours on dash panel are relatively high as Fig. 12(a). This is mainly because thickness of magnesium alloy dash panel is only 3 mm and it is relatively thin. In addition, these regions are relatively smooth and there is no any rib. As a result, the vibration here is relatively large at the same excitation, and then they have the higher sound pressure. The sound pressure contour here has been obviously improved as Fig. 12(b) when sound package which glass wool thickness is 10 mm is applied to it. This is mainly because the porous material of sound package can absorb sound well, and sound is very difficult to transfer to dash panel. On the other hand, there is also a damping layer in sound package and it can be used to reduce vibration. Therefore, sound pressure here has been obviously improved after applying sound package.
7. Conclusions
1) The simulation modal of magnesium alloy dash panel is calculated and then compared with the experimental one in this paper. The relative errors are controlled within the allowable engineering range, which indicates that the finite element model is reliable and can be effectively used to solve the subsequent problems. This step is necessary for a complex simulation model.
2) Sound insulation performance experiment is carried out for magnesium alloy dash panel, and then compared with the results of structure-acoustic coupling method as well as hybrid FE-SEA method, respectively. As a result, the superiority and the reliability of FE-SEA method for predicting sound insulation performance of dash panel are shown. Therefore, FE-SEA method should be firstly selected to solve sound insulation performance of a complex model.
3) In addition, sound insulation performance of the original steel dash panel is also calculated and compared with that of magnesium alloy dash panel, and the results show that sound insulation performance of magnesium alloy dash panel has achieved the level of steel dash panel. In addition, mass of magnesium alloy dash panel is significantly lower than that of steel structure. This proves that magnesium alloy dash panel has a low noise characteristic when it can achieve lightweight. For the other structures, light metal can be used to replace the original materials to realize lightweight.
4) Sound packages with different thicknesses are applied to magnesium alloy dash panel. Then the composite dash panel is obtained and FE-SEA method is adopted to calculate its sound insulation performance. It is shown that sound insulation performance of dash panel has been obviously improved after applying sound package. To evaluate the comprehensive performance of three kinds of sound packages in terms of noise reduction and lightweight, the noise reduction efficiency is calculated. The results show that the comprehensive performance is best when glass wool thickness is 10 mm. For the other similar structures, this paper can provide a reference to solve sound insulation performance.
References
-
Sun Q. X., Zhan Z. X., Li J. J. Current state and development prospects for magnesium alloys used in cars. Inner Mongolia Science Technology and Economy, Vol. 9, 2008, p. 73-76.
-
Chen X. R., Hao Z. Y., Yang C. Simulation on sound insulation performance of an automotive dash by structure-sound interaction method. Journal of Vibration and Shock, Vol. 28, Issue 8, 2009, p. 154-157.
-
Chen L. H. Magnesium die-casting alloys and their applications in automotive industry. Foundry, Vol. 10, 1999, p. 45-47.
-
Shorter P. J., Langley R. S. Vibro-acoustic analysis of complex systems. Journal of Sound and Vibration, Vol. 288, 2005, p. 669-699.
-
Cotoni V., Shorter P. Numerical and experimental validation of a hybrid finite element-statistical energy analysis method. Journal of Acoustic. Society of America, Vol. 122, Issue 1, 2007, p. 259-270.
-
Vaz I., Pan J. Vibro-acoustic modeling of the APAMAT II test system. SAE Paper, 2009-01-2210, 2009.
-
Blanchet D., Hal W. V., Caillet A. Effect of beading on radiation noise. SAE Paper, 2010-01-1407, 2010.
-
Shorter P. J., Langley R. S. On the reciprocity relationship between direct field radiation and diffuse reverberant loading. Acoustical Society of America, Vol. 117, Issue 1, 2005, p. 85-95.
-
Robin S. L., Julio A. Hybrid deterministic statistical analysis of vibro-acoustic systems with domain couplings on statistical components. Journal of Sound and Vibration, Vol. 321, 2009, p. 893-912.
-
He L., Zhu H. C., Qiu X. J. Acoustic Theory and Engineering Applications. Science Press, Beijing, 2006, p. 168-169.
-
VAone User Guide. VAone, 2007.
-
Chen X. Research on analysis and control of car interior noise based on SEA method. Jilin University, Changchun, 2008.
