Abstract
Firstly, the simulation modal of the dash panel is computed and then compared with the experimental one in this paper to verify its reliability. Then, hybrid FE-SEA model of the dash panel is built to compute its transmission loss. There is an obvious valley value in the computational result. In order to solve this problem, it is necessary to conduct sound transfer path analysis, and the key region is obtained. Topology optimization is conducted on this region, and transmission loss of the optimized structure is then computed and compared with that of the original structure. Transmission loss in the mid-low frequency is improved obviously. Sound package is also applied in the key region of the dash panel, and transmission loss is also computed and compared with that of the original and optimized structure. The results show that topology optimization is better for improving noise at the mid-low frequency. Finally, the optimized results are verified by the experiment.
1. Introduction
Noise in the vehicle can be blocked by some panels, and the dash panel is used to isolate engine and the cabin. As a result, it is particularly important to research its characteristics. The dash panel is usually a complex structure, and some researchers have claimed that absorption materials may not have good effects on low-frequency noise, even may cause the deterioration of the sound insulation performance for a composite structure [1]. The roar of the engine is the main noise source that influences the cabin. And because of its high amplitude, it is not suitable for sound absorption methods to reduce the noise [2]. Therefore, the structural optimization design of the dash panel has a great significance.
In this paper, hybrid FE-SEA method is adopted for computing transmission loss of the dash panel [3, 4]. How to determine the weak region of transmission loss in the low frequency is the important point for the acoustic optimization design. As a result, it is necessary to conduct sound transfer path analysis. In this paper, sound transfer path analysis is conducted by modal and panel contribution analysis [5]. Currently, panel contribution analysis is mainly applied in the interior sound field of the vehicle [6-9]. In this paper, one obvious valley value is obtained firstly. Then, in order to find the key region which causes the obvious valley value, the dash panel is divided into eight panels to conduct panel contribution analysis.
The structural optimization can be divided into size optimization, shape optimization and topology optimization. Topology optimization refers to finding the optimal distribution of the structural materials to meet the objective requirement for a certain boundary conditions. The structural topology optimization is widely used [10-13], including strength, stiffness, vibration and noise.
In this paper, topology optimization is conducted to optimize transmission loss of the dash panel. Based on topology optimization, the key modal frequency is maximized to improve transmission loss of the dash panel.
2. Verification of the finite element model for the dash panel
The magnesium alloy dash panel is a die casting and integrally molded. There are many holes and corners on the dash panel. Before dividing the mesh, the geometric structure shall be cleaned to avoid effects on the quality of the subsequent mesh and the computational accuracy. After that, the finite element model based on the geometric model is shown in Fig. 1. The thickness of the red part is 3 mm, mainly using the quadrilateral element. However, in some special regions, there are some triangular elements. The thickness of the green part is 5 mm and for this part, because of the connection with the vehicle frame, the requirement of the rigidity is relatively more. So the thickness is bigger than the other regions. The mesh of this part is mainly the quadrilateral elements. As the magnesium alloy dash panel is integrally molded, there is no welding. Therefore, the connection between the green and the red part is simulated by the common nodes. In addition, the blue part is ribs. As can be seen from Fig. 1, there are many regions which are close to the flat on the magnesium alloy dash pane with poor stiffness. Therefore, it is necessary to set some ribs to improve its stiffness. Finally, the finite element model of the dash panel has 47264 elements and 57504 nodes.
Fig. 1Mesh model of magnesium alloy dash panel
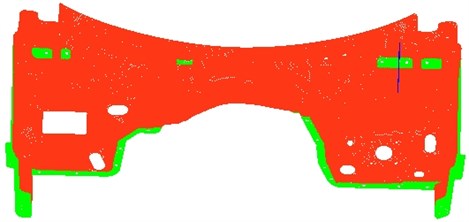
As shown in Fig. 1, the structure of the magnesium alloy dash panel is relatively complex, so the accuracy of the finite element model should be verified by the experiment. Material property of the magnesium alloy is as follows: ρ=1780 kg/m3, E= 44.8 GPa, μ= 0.35. The top six modals of the magnesium alloy dash panel can be computed through importing the material property into the mesh model in Fig. 1, and it is then imported into ABAQUS. Before the modal test of the magnesium alloy dash panel is conducted, the dash panel should be hung up through a flexible rope to simulate the freedom state. An acceleration sensor is located on it, and multi-points should be excited to capture all the modals of the dash panel. The experimental results are then compared with the simulation value as shown in Table 1.
Table 1Comparison between the experimental and simulation modal of the dash panel
Order | Experiment value / Hz | Simulation value / Hz | Relative error / % |
1 | 16.0 | 16.5 | 3.1 |
2 | 22.0 | 22.3 | 1.4 |
3 | 24.1 | 23.4 | -2.9 |
4 | 29.1 | 29.5 | 1.4 |
5 | 53.5 | 55.6 | 3.7 |
6 | 57.3 | 56.7 | -1.0 |
As can be seen from Table 1, the experimental value is very close to the simulation value. The relative error is within 5 %, and the error is acceptable for such a complex model. This shows that the finite element model of the dash panel proposed in this paper is reliable, which can be effectively used for the subsequent analysis. In addition, the modes of the dash panel for the top six orders are extracted as shown in Fig. 2. As can be seen from Fig. 2, regions with higher vibration on the dash panel are mainly at both ends, for the reason that there are larger flat structures with lower stiffness.
Fig. 2Modes of the dash panel for the top six orders
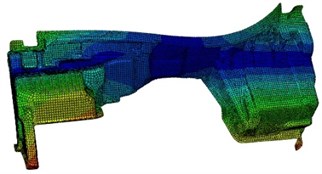
a) 16.5 Hz
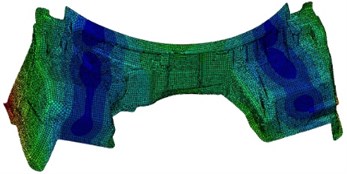
b) 22.3 Hz
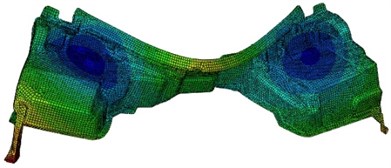
c) 23.4 Hz
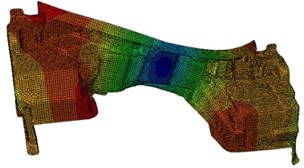
d) 29.5 Hz
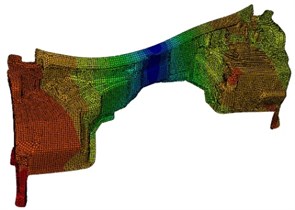
e) 55.6 Hz
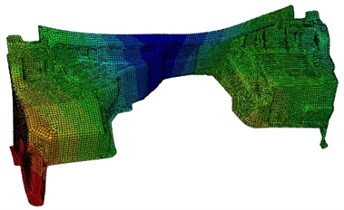
f) 56.7 Hz
3. Transmission loss of the dash panel
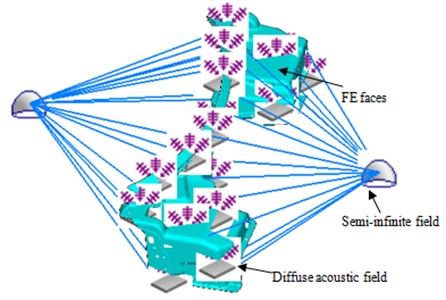
The mesh model in Fig. 1 is imported into VAONE. Afterwards, the whole model is divided into 15 sub-structures according to the properties of the mesh and the panel characteristics. Then, each sub-structure is individually selected and a button is clicked in the software to automatically generate the corresponding FE subsystem. Finally, according to the whole mesh model, FE subsystem is generated as shown in Fig. 3. In VAONE, FE face is generated automatically by FE subsystem at the same time. So there will be 15 FE faces in the final model. The acoustic excitation is applied to each FE face to simulate the actual excitation of the region. Semi-infinite fluid is built at the incident side and the transmission side of the dash panel to simulate the experimental environment. After that, all FE faces are connected to two semi-infinite flow fields to simulate the sound propagation process. The semi-infinite flow field (SIF) model is equivalent to SEA subsystem, and FE subsystem has been built in the above analysis. Therefore, SEA subsystem and FE subsystem will exist at the same time while building a dash panel model. As a result, hybrid FE-SEA model is obtained as shown in Fig. 4. This hybrid model can accurately compute acoustic characteristics of the dash panel in the mid-low frequency, because FE subsystem can effectively capture the low-frequency characteristics and SEA subsystem can capture the characteristics in the mid-high frequency. And the traditionally finite element method can only be used to compute the characteristics in the low frequency accurately. Because the dash panel structure is very complex, there are a lot of modes and the finite element method can’t compute the model with many modes. If the finite element method is applied compulsively, the computational results will be inaccurate. This further shows advantages of hybrid FE-SEA method in this paper.
Fig. 3FE subsystem model of the dash panel
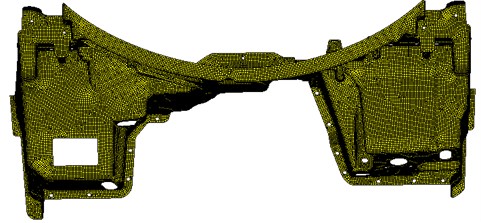
Fig. 4hybrid FE-SEA model of the dash panel
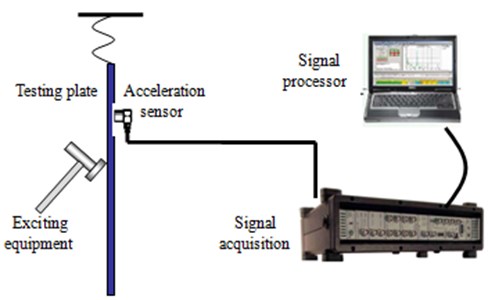
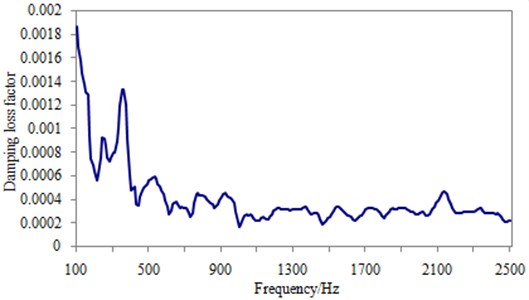
Factors which can affect the acoustic characteristics of the dash panel besides mass and stiffness, there is the damping loss factor. In order to obtain the damping loss factor of the dash panel, the experiment is conducted by means of applying the pulse decay method, and the corresponding test schematic diagram is as shown in Fig. 5. The dash panel is hanging with a flexible rope, and six vibration acceleration sensors are located on the reasonable positions. Then, the force is applied in multiple points for the transient excitation, so the vibration attenuation processes of each point are recorded, in order to capture the vibration characteristics of the whole regions on the dash panel. Each point which is recorded 2 s for vibration attenuation process at one time and the whole measurement process should be done three times. The sampling frequency is 16384 Hz.
Fig. 5Test process of the damping loss factor for the dash panel
Finally, combining with the data processing method of pulse decay method, the frequency domain and time domain response curve of the dash panel are obtained as shown in Fig. 6. The final damping loss factor can be obtained by processing the time domain response curve, as shown in Fig. 7.
Fig. 6Time-frequency response curve of the dash panel
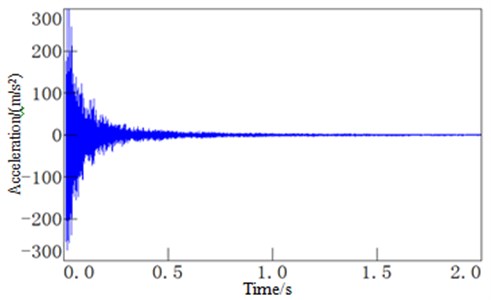
a) Time-domain response curve
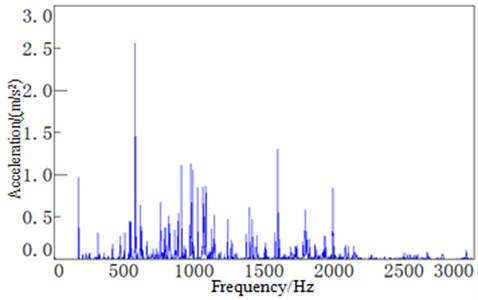
b) Frequency-domain response curve
Fig. 7Damping loss factor of the dash panel
Transmission loss of the dash panel is computed by the following formula:
The incident sound power of the dash panel is [14] as follows:
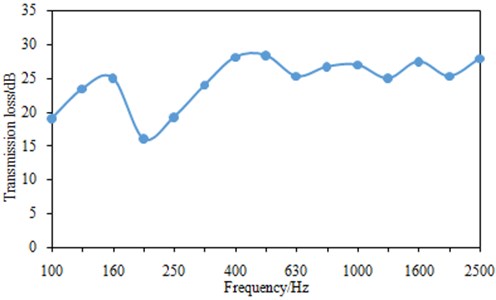
Pa is sound pressure amplitude in the incidence side. ˉPa is the effective value of sound pressure in the incidence side. ρ0 is air density. c0 is sound velocity in air. S is surface area of the dash panel. Wout is sum of the incidence sound power which can be obtained from SIF in Fig. 4. Transmission loss under 1/3 octave for the dash panel can be obtained finally as shown in Fig. 8. It can be seen that transmission loss curve doesn’t have many peak or valley values, mainly because the computational result is under 1/3 octave.
Fig. 8Transmission loss of the dash panel under 1/3 octave
4. Transmission path analysis of noise for the dash panel
Transmission loss curve under 1/3 octave cannot accurately reflect the characteristic of the dash panel at a certain frequency. In order to solve this question, the corresponding equal-bandwidth curve is numerically computed, as shown in Fig. 9. The results of the frequency spectrum curve have a lot of peak and valley values, because modal density of the dash panel is very high in the analyzed band.
Fig. 9Frequency spectrum curve of transmission loss
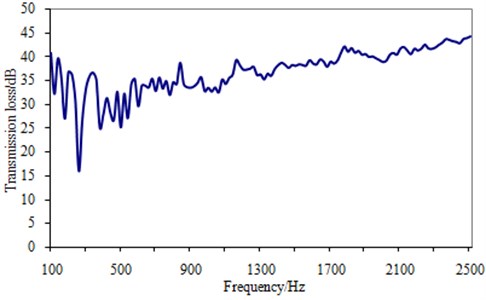
As shown in Fig. 9, there is an obvious valley value within the frequency band, which corresponds to the natural frequencies of the dash panel. In order to verify which modals are associated with the valley value, the modal contribution of the dash panel is analyzed, and only the modal at 275 Hz is adopted for computing transmission loss. And the obtained curve is compared with the overall transmission loss curve, as shown in Fig. 10.
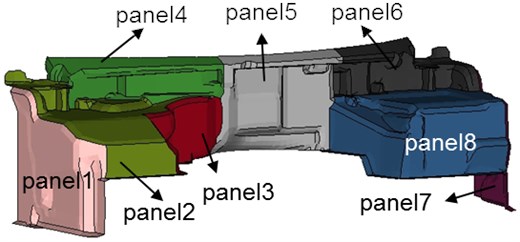
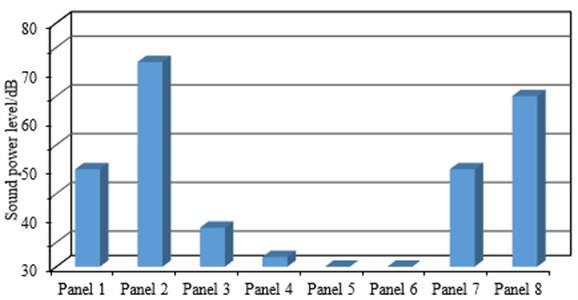
In order to find the key region which causes the obvious valley value at 275 Hz, panel contribution analysis is conducted. The dash panel is divided into eight panels, as shown in Fig. 11. Based on hybrid FE-SEA model, sound power levels of eight panels in the transmission side can be obtained, respectively. As a result, sound power levels of eight panels at 275 Hz can be extracted as shown in Fig. 12.
Fig. 10Modal contribution analysis of the dash panel for transmission loss
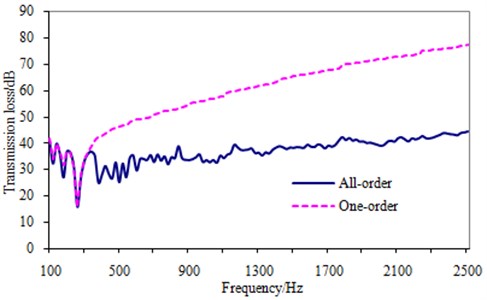
Fig. 11Panel distribution of the dash panel
According to Fig. 12, sound power levels of panel 2 and 8 are relatively high. As a result, panel 2 and 8 are the key region which causes the obvious valley value. So topology optimization should be conducted on panel 2 and 8.
Fig. 12Sound power levels of eight panels at 275 Hz
5. Topology optimization of the dash panel
In this paper, the variable thickness method is used to conduct topology optimization, and the element thickness is taken as the design variable in the variable thickness method. The element with thickness which is more than the upper limit will be deleted to realize topology optimization. As shown in Fig. 10, it can be seen that the modal at 275 Hz can cause a serious valley value. Therefore, this paper will improve this frequency and avoid resonance to improve transmission loss. In addition, when the structural optimization is conducted, the requirements of lightweight should be also considered. Finally, minimizing the total mass and improving the modal frequency at 275 Hz are regarded as the optimized objectives. During optimization, the thickness of each element is used as the design variable, the upper limit is 4 mm and the lower limit is 2 mm. Moreover, stress of each element should be less than the safety stress as constraint. The material properties of the dash panel before and after optimization don’t change, so the total mass of the dash panel will depend on its volume. The final optimization model is as follows:
In the formula, hi is the thickness of the ith element, si is the area of the element, V is the actual volume of the structure, σi is the stress of the ith element, h0 is the upper limit of the element thickness.
5.1. Process of topology optimization
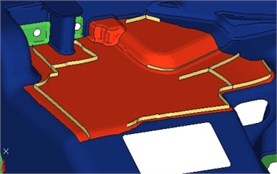
The objective function is the maximization of the key frequency. Design variables are the red region as shown in Fig. 13. The initial thickness in the red region is set as 3 mm, and the stress is taken as the constraint condition. The lower limit is 2 mm, and the upper limit is 4 mm.
Fig. 13The optimized region in the dash panel
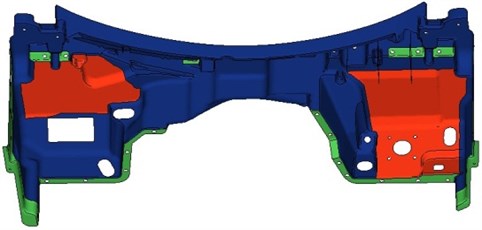
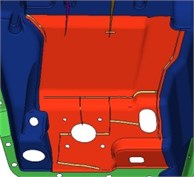
Fig. 14Result of topology optimization
5.2. Optimized results
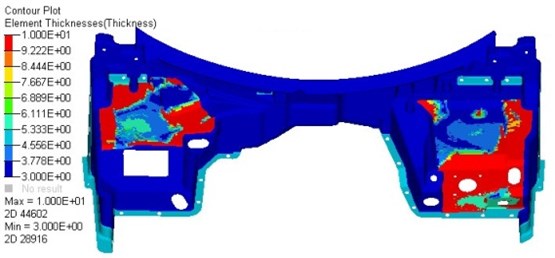
After five iterations, the objective function is convergent, and the corresponding optimization result is shown in Fig. 14. It is shown in the figure that the thickness in the red region is 3 mm, and the dark blue is the region which thickness is closed to 2.5 mm.
5.3. Optimization design of the dash panel
According to the result of topology optimization, optimization design is conducted on the dash panel by arranging some ribs, as shown in Fig. 15.
Fig. 15Position of some ribs in the dash panel
5.4. Analysis of transmission loss after optimization
The modal of the re-designed dash panel is computed, and the results show that the key modal is 285.4 Hz. It is more than the original value. As a result, transmission loss of the dash panel is also computed and compared with that of the original structure, as shown in Fig. 16. In order to further show the advantage of the structural optimization, transmission loss under 1/3 octave is also computed, as shown in Fig. 17.
Fig. 16Comparison of transmission loss before and after optimization
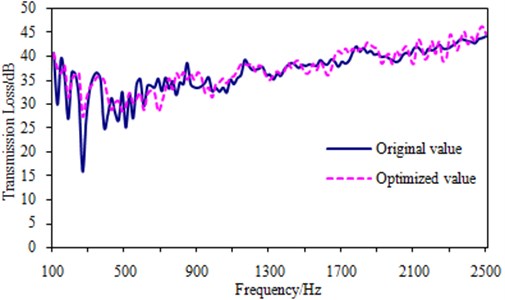
As can be seen from Fig. 16, transmission loss at the valley value is increased by 10 dB. In addition, transmission loss at the most frequencies is also improved. This result can be clearly found in Fig. 17 that transmission loss is improved obviously. According to the structural acoustic, transmission loss is mainly affected by the natural frequency in the mid-low frequency. The key frequency is increased by the structural optimization. Meanwhile, the response amplitude of the key region is also reduced and stiffness is improved. As a result, transmission loss in the mid-low frequency is improved obviously.
According to the biot-allard [14] theory, sound package is applied on the key region of the dash panel, and the structure of sound package has four layers, as shown in Fig. 18. The dash panel layer is 3 mm. The damping layer is 4 mm. The porous material layer is 5 mm, and the constraint layer is 4 mm. Then, transmission loss of the composite dash panel is computed and compared with that of the original and optimized dash panel, as shown in Fig. 19.
Fig. 17Comparison of transmission loss under 1/3 octave before and after optimization
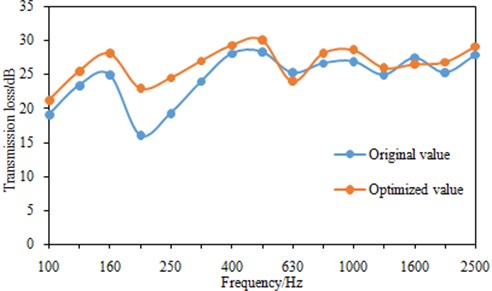
Fig. 18Structure of sound package

Fig. 19Comparison of transmission loss between structural optimization and sound package
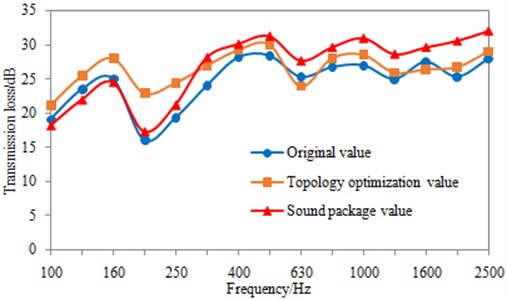
In Fig. 19, sound package has not any significant effect on transmission loss in the mid-low frequency. When frequencies are less than 160 Hz, transmission loss is reduced. It is because there are some resonances between the dash panel and sound package.
In addition, transmission loss of topology optimization in the mid-low frequency is improved obviously. Meanwhile, the increased mass of topology optimization is less than that of sound package. It can meet the requirement of lightweight and reduce cost.
6. Verification of the optimized results
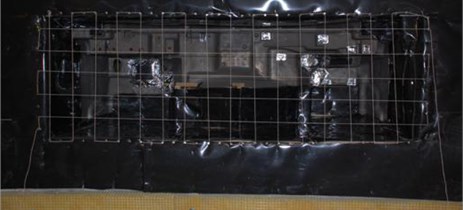
The reliability of the computational results for topology optimization should be verified. After optimization, the transmission loss experiment of the magnesium alloy dash panel applies the anechoic chamber method, and the experimental environment is created by an anechoic and reverberation chamber. The magnesium alloy dash panel is installed the window between the anechoic and reverberation chamber, as shown in Fig. 20. The gap between the window and the panel is sealed by sludge to prevent sound from passing through it. In addition, the wall between the reverberation chamber and the anechoic chamber can be considered as rigid, and the sound cannot spread out by the wall vibration. The excitation sources at the side of the reverberation chamber are generally including white noise and pink noise, and the excitation frequency band of white noise is relatively narrow, which cannot meet the experimental requirements. Therefore, this experiment chooses pink noise as the excitation source, and the distribution of pink noises is mainly in the mid-low frequency. It is consistent with the analyzed band of the dash panel. Pink noises are located in the reverberation. When the reverberation time is stable, transmission loss experiment can be only conducted. Five microphones are arranged in the reverberation chamber to test sound pressure levels in the incident side. After that, sound pressure levels of five microphones are averaged, and then the average sound pressure levels ¯pincident are obtained. An envelope surface is woven at the transmission side near the dash panel. Then 132 microphones are arranged on the envelope surface to test each sound pressure spread from each direction. Finally, the same method is taken to average sound pressure levels in the transmission side to obtain the average transmission sound pressure levels ¯ptransmission. The average sound pressure levels in the incident side and transmission side are imported the following formula [15]:
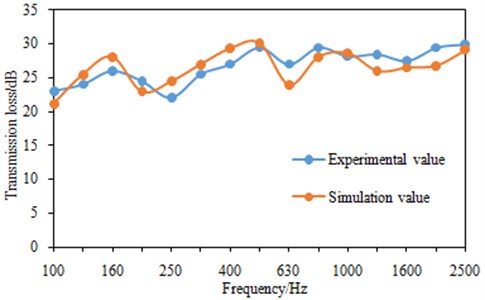
where S is the surface area of the dash panel. In the finite element software, it can be directly computed. S0 is the imaginary envelope surface area in the anechoic chamber, and it can be directly obtained during the measurement of transmission loss. Therefore, transmission loss of the dash panel can be obtained finally. And then comparison is carried out with the optimized result in Fig. 17, as shown in Fig. 21. As can be seen from Fig. 21, the experimental and simulation values are close to each other in the analyzed band. It shows that the optimization strategy and results are reliable.
Fig. 20Transmission loss experiment of the dash panel
7. Conclusions
1) The simulation modal of the magnesium alloy dash panel is computed and then compared with the experimental one in this paper. The relative errors are controlled within the allowable engineering range, which indicates that the finite element model is reliable and can be effectively used to solve the subsequent problems. This step is necessary for a complex simulation model.
2) Hybrid FE-SEA model is built to compute transmission loss of the dash panel. As can be seen from the computational results, there is an obvious valley value. In order to solve this problem, it is necessary to conduct sound transfer path analysis. In this paper, sound transfer path is finally conducted by modal and panel contribution analysis. Finally, the key region is obtained.
3) Topology optimization is conducted on the key region, and transmission loss of the optimized structure is then computed and compared with that of the original structure. The results show that transmission loss in the mid-low frequency is improved obviously.
Fig. 21Comparison of transmission loss between experiment and simulation under 1/3 octave
4) In order to show the advantage of the structural optimization, sound package is also applied in the key region of the dash panel, and transmission loss is computed and compared with that of the original and optimized structure. The results show that the structural optimization can make up the defect of sound package for improving noise in the mid-low frequency.
5) Transmission loss experiment is conducted for the optimized structure to verify the reliability, and results show that they are consistent with each other and the optimization method is reliable.
References
-
Chen X. R. Investigation on NVH Performance of Automotive Magnesium Alloy and Acoustic Optimization Design for Magnesium Dash. Zhejiang University, Hangzhou, 2011, (in Chinese).
-
Ma T. F., Lin Y., Peng Y. H. Simulation and experimental study of car interior low frequency noise. Chinese Mechanical Engineering, Vol. 16, Issue 16, 2005, p. 1489-1492., (in Chinese).
-
Mao J., Hao Z. Y., Lu Z. G. Sound insulation numerical calculation of an automobile magnesium alloy dash based on FE-SEA hybrid method. Journal of Zhejiang University (Engineering Science), Vol. 46, Issue 12, 2012, p. 2184-2120, (in Chinese).
-
Li M., Lu Z. G. Transmission loss research of dash panel based on the hybrid FE-SEA method in mid-frequency. Ship Science and Technology, Vol. 34, Issue 11, 2012, p. 32-36.
-
Zhao J., Zhou H., Liang Y. Z. Vehicle panel acoustic contribution and optimization. Journal of Mechanical Engineering, Vol. 46, Issue 24, 2010, p. 96-100, (in Chinese).
-
Ding W., Chen H. Research on the interior noise contributed from a local panel’s vibration of an elastic thin-walled cavity. Applied Acoustics, Vol. 63, Issue 1, 2002, p. 95-102.
-
Kim K. C., Kim C. M. Process of designing body structures for the reduction of rear seat noise in passenger car. International Journal of Automotive Technology, Vol. 8, Issue 1, 2007, p. 67-73.
-
Jin X. X., Bai S. Y., Ding Y. L. Computer simulation on acoustic contribution of vibrating body panels. Automotive Engineering, Vol. 22, Issue 4, 2000, p. 235-239., (in Chinese).
-
Wolff O., Sottek R. Panel contribution analysis-an alternative window method. SAE Paper, 2005-01-2274, 2005.
-
Bendsoe M. P., Kikuchi N. Generating optimal topologies in structural design using a homogenization method. Computer Methods, Vol. 71, 1988, p. 197-224.
-
Eschenauer H. A., Olhoff N. Optimization procedures in structural design. American Society of Mechanical Engineers, Vol. 54, Issue 4, 2001, p. 331-390.
-
Rozvany G. Aims, scope, methods, history and unified terminology of computer-aided topology optimization in structural mechanics. Structure Multidisciplinary Optimization, Vol. 21, 2001, p. 90-108.
-
Xia T. X., Yao W. X. A survey of topology optimization of continuum structure. Advances in Aeronautical Science and Engineering, Vol. 2, Issue 1, 2011, p. 1-12. (in Chinese).
-
Allard J. F., Dazel J. O. Rayleigh waves in air saturated axisymmetrical soft porous media. Journal of Applied Physics, Vol. 106, Issue 1, 2009, p. 1-8.
-
Du G. H., Zhu Z. M., Gong X. F. Acoustic Basis. Nanjing University Press, Nanjing, 2001.

