Abstract
To solve the problem of damage due to large dynamic stress of the lateral plates during working process of the vibration screen, it is necessary to calculate and analyze natural modes and distribution of dynamic stress of lateral plates, which is shown in results that the lateral plate structure shall be optimized. In this paper, with the total weight of the lateral plates for the banana-shaped vibration screen as the optimization objective, frequency constraints as the status variables, optimization for multi-frequency constraints is conducted based on the improved genetic algorithm. Next, a mathematical model of structure parameter optimization for the lateral plates of the vibration screen under frequency constraints is established to carry out optimization design in order to obtain a structure with smaller dynamic stress and lower weight. Sensitivity analysis is added into the improved genetic algorithm, and the optimization efficiency is increased simultaneously. The structure frequency is optimized by means of the improved genetic algorithm. Then, a modal experiment is carried out to the entire vibration screen so as to verify reliability of the finite element model, and the natural characteristics of the vibration screen before and after optimization are analyzed, and the top 6 orders natural frequency and vibration modes of the entire vibration screen are calculated, so as to indicate that optimized vibration screen is improved in terms of material saving, stiffness and stability. In addition, noise is directly related to vibration. As a result, the change of the vibration screen should be also analyzed. Noise of the vibration screen is also tested by sound array technology. Results showed that the radiated noise is reduced after optimization, and optimization in this paper is feasible.
1. Introduction
During working process, the vibration screen bears large exciting force, and strong inertia force shall be distributed on the lateral plates and the beam. The vibration screen also carries out elastic deformation motion while doing rigid body motion. The elastic vibration of the screen body results in huge dynamic stress of the lateral plates, which is prone to causing fatigue cracks, thus leading to damage to the lateral plates of the vibration screen. The objective of the dynamical optimization for the vibration screen is to ensure high fatigue resistance and long working life. Therefore, the vibration screen structure is required to be reasonably designed to enable it to have sufficient stiffness, to ensure the frequency of its elastic vibration modal away from the working frequency of the vibration exciter. Meanwhile, the dynamic stress during vibration shall be reduced.
An effective way to improve the reliability of the lateral plates of the vibration screen is to solve the problem of large stress of the lateral plates during vibration process [1, 2]. In mechanical structures, stiffened plate is one of the common and effective ways to control the stress level of the structure. However, the structure sizes of the stiffened plate and its arrangement on primary materials have always been the difficulties for designing the structure of lateral plates [3, 4]. The position, sizes and thickness of the stiffener are generally designed according to the experience of engineering technicians, which lacks of theoretical basis. Researches on the structural strength of vibration screen only include strength calculation and analysis without considering the influence of dynamic characteristics.
Most of existing literatures on optimization analysis on the vibration screen carry out researches in terms of technological parameters such as a screen surface length, dip, screen hole dimensions and throwing index etc. For instance, Wang [5] carried out multilevel optimization on the established comprehensive mathematical model of screening efficiency to improved screening efficiency and found the optimal values of each parameter during screening process. Delaney [6] analyzed and researched the relationships between screening efficiency and screen surface length under each parameter conditions by taking screen surface length as the entry point, and concluded the general rule relationship between the screen surface length and the screening efficiency. Liu [7] and Dong [8] established related concepts to describe layering and screening phenomena, and found the relationships between them and the vibration parameters as well as structure parameters. However, there are few literature researches on dynamic stress analysis and optimization of lateral plates of the vibration screen. To solve the problem of damage due to large stress of the lateral plates during operation process, it’s necessary to calculate and analyze natural modes and distribution of dynamic stress of lateral plates. In this paper, with the total weight of the lateral plates for the banana-shaped vibration screen as the optimization objective, frequency constraint as the status variables, optimization for multi-frequency constraints was conducted based on the improved genetic algorithm. Next, a mathematical model of structure parameter optimization for the lateral plates of the vibration screen under frequency constraints is established to carry out optimization design in order to obtain a structure with smaller dynamic stress and lower weight.
2. Dynamic characteristic analysis of lateral plates
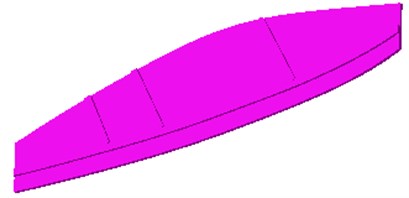
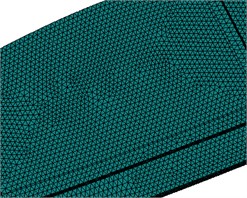
Lateral plates of vibration screen have a complicated banana-shaped structure which is 7.41 m long, 3.25 m wide and 14 mm thick. Due to the complicated structure and large difference between length and width, the lateral plate can be easily damage during working process. Therefore, 10-node tetrahedral units are used for mesh division so as to obtain fine elements with a regular shape. A finite element mesh model is shown in Fig. 1(a), which have 104,153 elements and 170,632 nodes. A partially enlarged model is shown in Fig. 1(b).
Fig. 1Finite element model of lateral plates
a) Finite element mesh model
b) Partially enlarged model of finite elements
2.1. Modal analysis of lateral plates
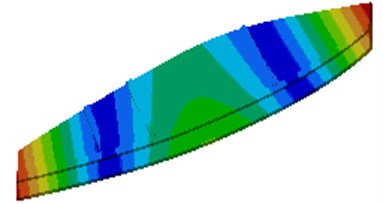
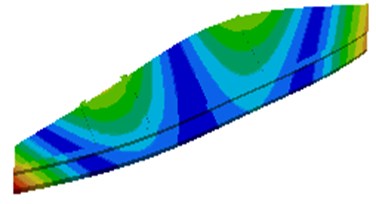
Modes reflect natural characteristics of the lateral plate and can provide certain reference for structural optimization. Based on the finite element model, rigid body modes for the top 6 orders are solved as shown in Fig. 2.
It is shown in Fig. 2 that the 3rd order deformation frequency of the lateral plate is very close to the working frequency 12.17 Hz. Under effect of dynamic stress, large deformation will appear in the middle of lateral plates, which likely causes damage of the lateral plate. As a result, the structure should be improved.
Fig. 2The top 6 orders natural modes of lateral plates
a) The 1st order
b) The 2nd order
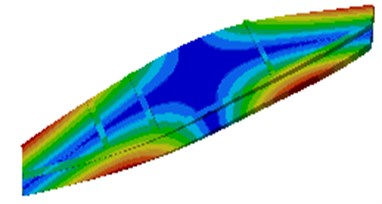
c) The 3rd order
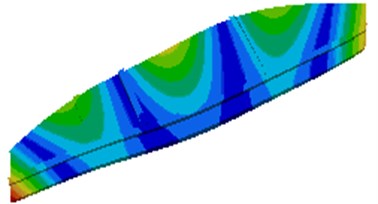
d) The 4th order
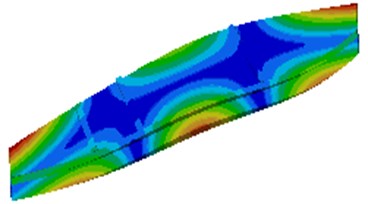
e) The 5th order
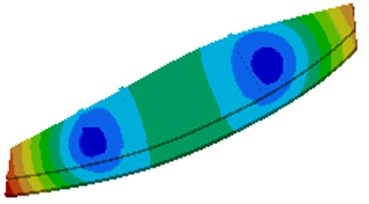
f) The 6th order
2.2. Dynamic stress analysis of lateral plates
During working process, the vibration screen bears large exciting force, and huge inertia force is distributed on the lateral plate, thus, generating large dynamic stress on the lateral plate and beam. Dynamic harmonic response analysis can obtain responses of the vibration screen structure at any moment, including stress distribution and deformation situations. Thus, whether the structure satisfies conditions can be judged by these responses.
The vibration screen is influenced by exciting force, distribution inertia force, gravity and spring supporting counterforce, and damping force is very small influences on the system which can be neglected. Dynamic stress analysis is carried out when the vibration screen moves to the lowest position. Exciting force and inertia force are the maximum values at this moment. Dynamic stress distribution of lateral plates is shown in Fig. 3.
Fig. 3Dynamic stress distribution of lateral plates
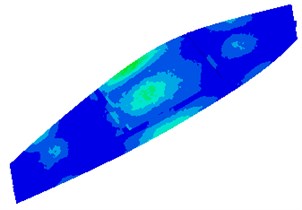
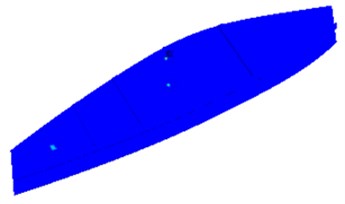
It is shown in Fig. 3 that dynamic stress is distributed widely on the whole lateral plate, wherein stress concentration appears on some parts. In practical working process, the lateral plate would likely be damaged.
3. Optimization of lateral plates based on the improved genetic algorithm
3.1. Necessity of the improved genetic algorithm
This paper conducted optimization analysis on lateral plates of the vibration screen by the improved genetic algorithm mainly because of the following reasons.
1) Some defects exist in the traditional genetic algorithm, such as easy precocity, poor partial optimization capacity, and low solution accuracy. The solved result can quickly reaches about 90 % of the optimal solution. However, in order to reach the optimal solution, a lot of time is always needed for the iterative computations, which will undoubtedly increase the computational cost and reduce efficiency. The paper puts forward an improved genetic algorithm based on sensitivity analysis. Sensitivity amendment steps are added during the iterative computations of genetic algorithm. In this way, the excellent individuals in a population can continue mutation and evolution along the assigned direction. Searching ability of the algorithm is effectively improved, and convergence rate as well as calculation efficiency is increased.
2) The optimization calculation in this paper is based on commercial software ISIGHT. In this software, modules such as genetic algorithm and sensitivity analysis are integrated. The two modules can be combined organically by writing a simple program. A lot of time and cost are saved. In this way, the efficient optimization for lateral plates of the vibration screen is realized.
3) During analysis on lateral plates of the vibration screen, the minimal total mass of lateral plates is taken as the objective function, frequencies at multiple points are taken as constraints, and multiple rib sizes are taken as variables. Finally, the optimized structure is obtained. Such structure maybe not the optimal one, but it is shown in the subsequent experiment and simulation analysis on the entire vibration screen structure that the optimization result is effective and satisfies engineering requirements.
The genetic algorithm includes three basic genetic operators [9, 10], which are selection, crossover and mutation, respectively. This paper carries out the analysis through the genetic algorithm based on improved mutation operators [11, 12]:
where, is an improved mutation operator. has inverse relation to genetic evolution algebra. The value of reduces with the increase of genetic evolution algebra. is related to the good or bad degree of average adaptive value of the group. The better the average adaptive value of the group is, the smaller the value of will be. is the initially assumed mutation rate. is the minimum value allowed by the mutation rate. is the current evolutionary generation number. is the total evolutionary generation number. is the average fitness value of the current group. is the optimal fitness value of the group by far. is the design variable corresponding to the optimal fitness value.
3.2. The mathematical model of optimization for lateral plates
Lateral plates are shown in Fig. 4. The two holes on the left and the right are the holes of the supporting beam of the vibration screen. The two holes in the middle are the mounting holes for the vibration exciter of the vibration screen. In the figure, the initial thickness of the stiffening rib is 100 mm, and its width is 90 mm, while its length is related to its location on the lateral plates.
Fig. 4Initial structure of the lateral plates of the vibration screen
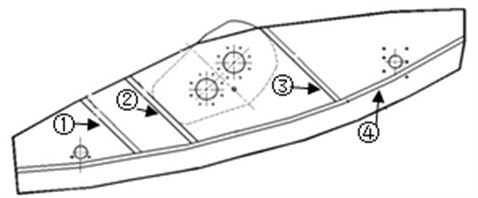
It is considered that low-order elastic modal frequency is close to the operation frequency 12.17 Hz, and it will generate huge influences on the mode. As a result, the modal frequencies , and are taken as constraint conditions.
During the optimization, the total mass is taken as the objective function. Thicknesses of four stiffening ribs in Fig. 4 are taken as the design variables. The mathematical description of such optimization is shown as follows:
where is the total mass of lateral plates. is a vector which includes four design variables. is density. , and respectively indicate sizes of the stiffening rib in width, length and height. is the constraint frequency of the th order. is the square of the expected frequency for th order. stands for thicknesses of four stiffening ribs in Fig. 4 and is taken as the design variable. is the lower limit value of design variable. is the upper limit value of design variable.
Change range of each design variable and constraint condition is shown in Table 1.
Table 1Change range of design variables and constraint conditions
Parameter | Initial value | Lower limit value | Upper limit value |
/ mm | 100.00 | 60 | 140 |
/ mm | 100.00 | 60 | 140 |
/ mm | 100.00 | 60 | 140 |
/ mm | 90.00 | 60 | 130 |
/ Hz | 4.24 | 3.12 | 7.17 |
/ Hz | 15.04 | 14.05 | 17.17 |
/ Hz | 17.16 | 15.61 | 19.30 |
During optimization, sensitivity is taken as the criterion for modifying mutation operator repeatedly. The objective function described in Eq. (2) is changing with the design variables. Therefore, the partial derivative of the objective function to the design variable is taken as the sensitivity value in the subsequent analysis. The computational formula of sensitivity is shown as follows:
where is the objective function. is the modal information corresponding to constraint frequency. is the design variable. is stiffness matrix. is mass matrix.
3.3. Optimization process and results
Based on the improved genetic algorithm, optimization analysis is conducted to lateral plates, and optimization flow is shown in Fig. 5.
Fig. 5Optimization flow diagram of the improved genetic algorithm
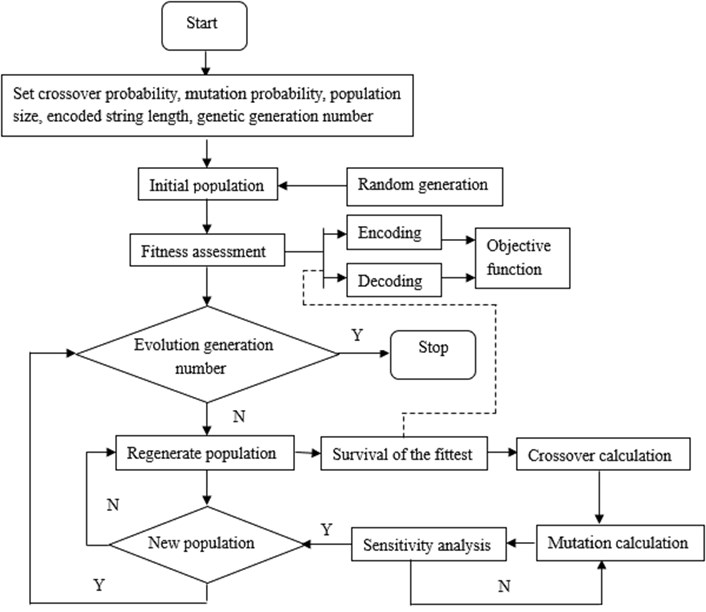
Optimization design is conducted to lateral plates based on the improved genetic algorithm, and the detailed process is shown as follows.
1) Encoding chromosomes: the total weight of lateral plates is encoded into a binary string with a constant length based on the improved genetic algorithm, namely a chromosome. The different search points in the search space are constituted by the different combinations of these strings.
2) Generating the initial population: size of the initial population is set to be 40.
3) Calculating fitness value: selection of fitness value will directly influence convergence rate of the improved genetic algorithm and the possibility to find the optimal solution. Fitness value is generally a positive number. As for the problem about maximization, fitness value is always the objective function. On the contrary, as for the problem about minimization, fitness value is the negative number of the objective function. In this paper, the negative number of the total weight is taken as the fitness value.
4) Selection: individuals of which fitness value is stable during evolution are selected.
5) Crossover: the partial chromosomes among the selected 40 individuals are exchanged at a certain probability. In this way, 40 new individuals of sub-generation are generated. The crossover probability is set to be 0.92.
6) Mutation: 40 selected individuals are mutated at a given probability to generate a new population. The mutation probability is 0.05 in this paper.
7) Sensitivity analysis: sensitivity analysis is carried out to the mutated individuals. If the sensitivity requirement is satisfied, the new individuals could be generated. Otherwise, step 6 would be re-started. Mutation operators which do not meet requirements could be rapidly eliminated by adding sensitivity analysis in the improved genetic algorithm. Therefore, the calculation frequency is increased.
8) Judgment: whether the new population could meet constraint conditions is judged, in this way, the optimal results can be found. If the new population doesn't meet constraint conditions, the step was stopped. Otherwise, step 3 will be started again.
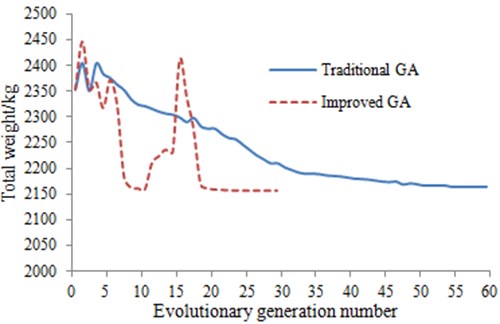
Optimization design is conducted to lateral plates by the improved genetic algorithm. The obtained results are compared with that of the traditional genetic algorithm, as shown Fig. 6. It is shown in the figure that convergence can be realized when the evolutionary generation number is 30 during calculation based on the improved genetic algorithm. For the traditional genetic algorithm, convergence can be realized when the evolutionary generation number is 60. If the calculation model is more complicated, the genetic algorithm proposed in this paper will show more advantages in time. In addition, the optimal solution obtained by the improved genetic algorithm is 2158 kg, while the optimal solution obtained by the traditional genetic algorithm is 2165 kg. Therefore, the improved genetic algorithm has certain advantages during optimization design of lateral plates.
Fig. 6Comparison of calculation results for two genetic algorithms
Comparison was carried out between optimal results and that before optimization, as shown in Table 2. According to this table, the mass of the lateral plates reduces by 194.50 kg after optimization for the structure, which reaches good effect. The 1st order modal frequency is rigid motion frequency, its value decreases, which meets the working requirement. The 2nd and the 3rd order modal frequencies increase by 1.73 % and 2.91 % respectively, and are far from the working frequency 12.17 Hz, so that they can effectively avoid resonance, thus preventing damage to the structure of the vibration screen.
Table 2Parameters related to optimization of the lateral plates
Relevant parameters | Before optimization | After optimizaiton | Change range % |
/ mm | 100.00 | 60.29 | –39.71 |
/ mm | 100.00 | 60.31 | –39.69 |
/ mm | 100.00 | 61.10 | –38.90 |
/ mm | 90.00 | 60.36 | –29.64 |
/ Hz | 4.24 | 4.17 | –1.65 |
/ Hz | 15.04 | 15.30 | +1.73 |
/ Hz | 17.16 | 17.66 | +2.91 |
/ kg | 2352.80 | 2158.30 | –8.27 |
In addition to that, the dynamic stress distribution of lateral plates is obtained as shown in Fig. 7. In comparison with results before optimization as shown in Fig. 3, it can be found that dynamic stress is obviously improved.
Fig. 7Dynamic stress distribution of lateral plates after optimization
3.4. Estimation and analysis on the entire effects of the optimization vibration screen
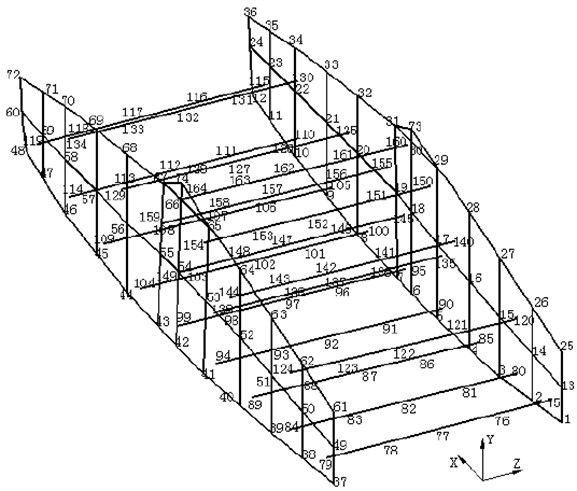
To verify the optimization effect of lateral plates for the vibration screen, we should make some comparisons in the natural characteristics of the vibration screen. However, the vibration screen is very complicated and the finite element model may have problems, so that experiment verification is necessary. Modal comparison is a common method to verify reliability of the finite element model. Therefore, it is necessary to test overall modes of vibration screen on the top 6 orders through experiments. 164 test points are arranged on the vibration screen, wherein each test point is used to measure 3 directions and there are 492 freedom degrees in total. Arrangement of testing points of vibration screen is shown in Fig. 8.
Fig. 8Arrangement of modal test points of vibration screen
Finite elements and experimental results are compared as shown in Table 3. It is shown that the relative error is controlled within 5 % of engineering requirements, indicating that the finite element model is reliable and can be used for subsequent analysis.
Table 3Comparison between vibration screen experiment and simulation model
Order | Simulation results (Hz) | Experimental results (Hz) | Error (%) |
1 | 16.09 | 16.90 | –4.70 |
2 | 18.07 | 18.75 | –0.35 |
3 | 19.83 | 19.22 | 3.17 |
4 | 23.19 | 24.16 | –4.01 |
5 | 33.31 | 32.23 | 3.34 |
6 | 38.65 | 37.96 | 1.84 |
The top 6 orders modal comparison between the origin vibration screen and the optimization one are calculated by simulation, as shown in Table 4.
Table 4Modal comparison between the origin vibration screen and the optimization one
Order | Origin | Optimization | Vibration mode |
1 | 16.09 | 18.37 | The two lateral plates reverse twisting around axle |
2 | 18.07 | 20.29 | The feed end and the discharge end bending and swinging along direction |
3 | 19.83 | 24.39 | The discharge end swinging along direction + the entire screen overturning around axle |
4 | 23.19 | 41.77 | The middle part and the feed end bending and swinging along direction |
5 | 33.31 | 45.81 | The feed end and the discharge end bending and swinging along direction |
6 | 38.65 | 45.92 | The discharge end bending and swinging along direction + the middle part overturning along direction |
According to Table 4, the bending deformation frequency of the vibration screen improved significantly after optimization for the structure size, which showed that the overall rigidness of screen body was increased. The 1st and the 2nd order modal frequencies which were close to the working frequency were deformation frequencies which had huge influence on the structure. They were also the constraint frequencies which were considered when optimizing. They became 18.37 Hz and 20.29 Hz from 16.09 Hz and 18.07 Hz before optimization.
Meanwhile, Table 5 provides comparison of relevant parameters before and after optimization of the vibration screen. After optimization, the 1st order elastic deformation frequency of the vibration screen increased by 14.17 %, the 2nd order elastic deformation frequency increased by 12.29 %, and the total mass of the vibration screen reduced by 2.35 %. In a manner of speaking, the vibration screen is improved in terms of material saving, stiffness, strength and stability by optimizing the sizes of the lateral plates.
Table 5Comparison of relevant parameters before and after optimization of the vibration screen
Relevant paramters | Before optimization | After optimizaiton | Change range % |
/ Hz | 16.09 | 18.37 | 14.17 |
/ Hz | 18.07 | 20.29 | 12.29 |
/ Hz | 19.83 | 24.39 | 23.01 |
/ kg | 16532.50 | 16143.50 | 2.35 |
Large noise will be generated by the vibration screen during operation. Lateral plate is a relatively weak structure in the vibration screen. Its radiation noise will directly influence the overall noise level of the vibration screen. Therefore, it is necessary to analyze sound field of the vibration screen before and after optimization of lateral plates. The paper attempted to research sound field by sound array technology.
The A-weighted sound power level of the vibration screen is measured in the reverberation chamber. The sound power levels are determined in one-third-octave bands with the screen placed directly on the reverberation chamber floor and with the screen supported on vibration-isolation pads to prevent vibration-radiated noise from the reverberation chamber floor. Bruel & Kjaer Type 4204 Reference Sound Source was used. Next, the sound pressure levels are measured for the vibration screen. A measurement of 30 seconds is used for all tests. From the measured sound pressure levels, the sound power levels are calculated by the following equation:
where is the spatially-averaged sound pressure level inside the reverberation chamber for the reference sound source, is the spatially-averaged sound pressure level inside the reverberation chamber for the vibration screen, is the calibrated sound power level of the reference sound source, and is the calculated sound power level of the vibration screen.
Measurements are performed at a distance of 5.54 meters from sides of the screen, so the entire screen will fit within the measurement area of the array. Measurements are shown in Fig. 9. Sound power levels of the vibration screen before and after optimization of the lateral plates are compared, as shown in Fig. 10.
Fig. 9Diagram of noise measurement for the vibration screen
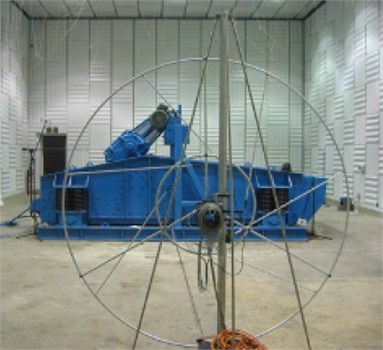
Fig. 10Sound power levels of the vibration screen before and after optimization
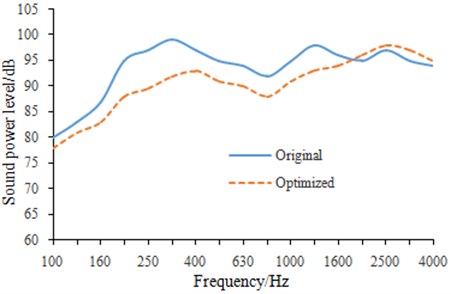
It is shown in Fig. 10 that sound power levels of the vibration screen are obviously different before and after optimization of lateral plates. After optimization, sound power levels decrease to a certain extent and the maximum value decreases by nearly 10 dB. This result is very important for improving noise problem of the vibration screen. In order to more clearly observe the change of sound field before and after optimization of lateral plates, contours of sound pressure at 300 Hz are extracted, as shown in Fig. 11.
It is shown in Fig. 11 that areas with large sound pressures are obviously improved after optimization. In addition, two figures have an area which has the large sound pressures, and it is caused by an operation motor of the vibration screen rather than lateral plates. Therefore, our researches are very meaningful to reduce noise of the vibration screen.
Fig. 11Contours of sound pressure around lateral plates before and after optimization
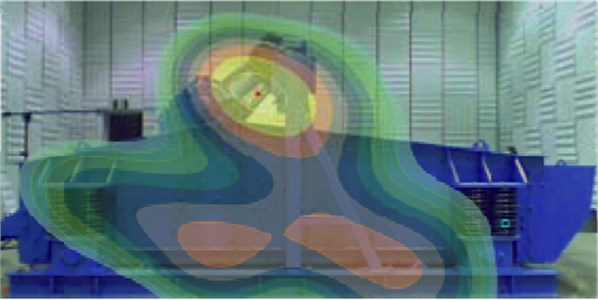
a) Contours of sound pressure around lateral plates before optimization
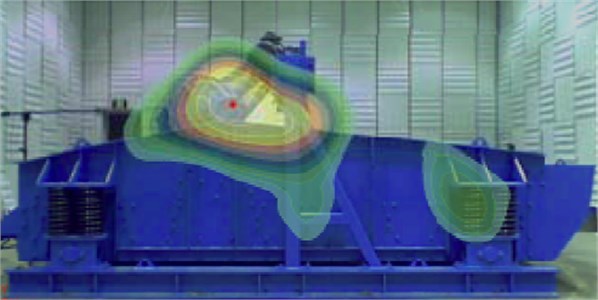
b) Contours of sound pressure around lateral plates after optimization
4. Conclusions
In this paper, with the total weight of the lateral plates for the banana-shaped vibration screen as the optimization objective, frequency constraints as the status variables, optimization for multi-frequency constraints is conducted based on the improved genetic algorithm. Next, a mathematical model of structure parameter optimization for the lateral plates of the vibration screen under frequency constraints is established to carry out optimization design in order to obtain a structure with smaller dynamic stress and lower weight. Sensitivity analysis is added into the improved genetic algorithm, and the optimization efficiency is increased simultaneously. The structure frequency is optimized by means of the improved genetic algorithm. Then, a modal experiment is carried out to the entire vibration screen so as to verify reliability of the finite element model, and the natural characteristics of the vibration screen before and after optimization are analyzed, and the top 6 orders natural frequencies and vibration modes of the entire vibration screen are calculated, so as to indicate that optimized vibration screen is improved in terms of material saving, stiffness and stability. In addition, noise is directly related to vibration. As a result, the change of the vibration screen should be also analyzed. Noise of the vibration screen is tested by sound array technology. Results showed that the radiated noise is reduced after optimization, and optimization in this paper is feasible.
References
-
Xiao J., Tong X. Particle stratification and penetration of a linear the vibration screen by the discrete element method. International Journal of Mining Science and Technology, Vol. 22, Issue 3, 2012, p. 357-362.
-
Xiao J., Tong X. Characteristics and efficiency of a new the vibration screen with a swing trace. Particuology, Vol. 11, Issue 5, 2013, p. 601-606.
-
Dong K. J., Yu A. B., Brake I. DEM simulation of particle flow on a multi-deck banana screen. Minerals Engineering, Vol. 22, Issue 11, 2009, p. 910-920.
-
Delaney G. W., Cleary P. W., Hilden M., et al. Validation of DEM predictions of granular flow and separation efficiency for a horizontal laboratory scale wire mesh screen. Seventh International Conference on CFD in the Minerals and Process Industries, 2009, p. 1-6.
-
Wang G., Tong X. Screening efficiency and screen length of a linear the vibration screen using DEM 3D simulation. Mining Science and Technology (China), Vol. 21, Issue 3, 2011, p. 451-455.
-
Delaney G. W., Cleary P. W., Hilden M., et al. Testing the validity of the spherical DEM model in simulating real granular screening processes. Chemical Engineering Science, Vol. 68, Issue 1, 2012, p. 215-226.
-
Liu C., Wang H., Zhao Y., et al. DEM simulation of particle flow on a single deck banana screen. International Journal of Mining Science and Technology, Vol. 23, Issue 2, 2013, p. 273-277.
-
Dong K. J., Wang B., Yu A. B. Modeling of particle flow and sieving behavior on the vibration screen: from discrete particle simulation to process performance prediction. Industrial and Engineering Chemistry Research, Vol. 52, Issue 33, 2013, p. 11333-11343.
-
Beasley J. E., Chu P. C. A genetic algorithm for the set covering problem. European Journal of Operational Research, Vol. 94, Issue 2, 1996, p. 392-404.
-
Hartmann S. A competitive genetic algorithm for resource‐constrained project scheduling. Naval Research Logistics (NRL), Vol. 45, Issue 7, 1998, p. 733-750.
-
Goldberg D. E., Korb B., Deb K. Messy genetic algorithms: motivation, analysis, and first results. Complex Systems, Vol. 3, Issue 5, 1989, p. 493-530.
-
Weile D. S., Michielssen E. Genetic algorithm optimization applied to electromagnetics: a review. IEEE Transactions on Antennas and Propagation, Vol. 45, Issue 3, 1997, p. 343-353.
About this article
The work presented in this paper is supported by projects of the National Natural Science Foundation of China (61473112).
