Abstract
The forefront of the tsunami bore has extremely strong turbulent intensity, vorticity, and impact force. It generates tremendous impact effect on the coastal structures, which is the direct reason of the damage and destruction of the structures. On the basis of the computational fluid dynamic theory, this paper applied fluid volume method to capture the free surface motion of the tsunami waves and developed a 3D wave numerical model of an experiment of dam-break tsunami bore impact on a structure. The effectiveness of the model was also validated. The model was then applied to numerically analyze the dynamic impact effect of a tsunami bore on the structure of a full-scale reinforced concrete frame. It resolved the dynamic impact force of the tsunami bore on the structure and their interaction process. This study also employed finite element analysis to compare the static and dynamic response of the frame structure under the impact effect of the tsunami bore. The structural vibration characteristic and dynamic magnification factor of the structure under tsunami bore impact are confirmed, which could provide a reference for the design of anti-tsunami buildings.
1. Introduction
Tsunami is a series of water waves with very strong destruction effect. It is usually triggered by strong seabed earthquake, undersea volcanic eruptions, or severe landslides of seabed or coastal seafloor [1-3]. When tsunami waves propagate to near shore shallow water, it can be elevated by shallower terrain. Meanwhile, the propagation speed of the tsunami waves attenuate with the decreasing water depth. As the result, when tsunami waves approach to shore, the wave speed decreases and the following waves can be continuously superposed on the previous ones, which can rapidly increase wave height, forming tsunami bores with wave height on the order of meters or tens of meters [4]. With very loud sound, huge tsunami bores rush on coastal land. Under very high water level and surge, the costal buildings, humans and livestock can be instantly destroyed, causing huge causalities and economic losses to the coastal region.
Field investigations on the disaster site and physical model test are two major approaches usually used in previous studies of tsunami bore effect on coastal building structures. Field investigations require tremendous manpower and material resources due to spatial and temporal uncertainty of the occurrence of tsunami. For physical model experiment, due to the limitation of current models, only small-scale structure model can be carried out in study of anti-tsunami impingement and it is rather difficult to conduct full-scale structural experiment in the current stage. For example, John W. van de Lindt et al. [5] carried out a tsunami bore impact study with a double wooden frame model with the ratio of 1/6. Their result showed that the difference of impact forces of the tsunami bore acting on the structural model was significant under different impinging directions. Al-Faesly T. et al. [6] conducted an experiment to study the impact of tsunami bore on downstream column with different impoundment depths, which indicated the impact force on the column was similar to the transient hydrodynamic pressure. Through experiment of perpendicular impact of tsunami bore on a wall, Jerald D. Ramsden et al. [7] obtained the maximum impact force was 5-7 times of hydrostatic pressure at the same conditions. Taro Arikawa [8] studied the impact of tsunami on wooden and concrete walls and indicated that the destructions by the tsunami bore varied significantly with different walls.
On the basis of computational fluid dynamics software, FLOW-3D, this paper used Volume of Fluid (VOF) to capture the motion of the free surface of tsunami [9-11]. The 3D wave numerical model was established and validated for tsunami bore to study its dynamic impact force on the structure. The finite element analysis software, ANSYS, was applied to compare the static and dynamics response of the structure under the impact of tsunami bore. The study indicated the magnification effect of tsunami bore onto the structure, which provided theoretical basis of design of anti-tsunami coastal buildings.
2. Validation of experimental model
Tsunami bore is a 3D phenomenon. The previous studies were primarily using theoretical and experimental approaches. In the experimental methods, dam-break bore experiments are usually used as the analogy study of tsunami bore due to their similarity. To simulate quasi-steady tsunami bores, the experiment was required to be a long dam-break. U.S. Scientist Harry Yeh et al. [12] carried out a very characteristic long dam-break experiment at the Charles W. Harris Hydraulics Laboratory. According to the dam-break experiment of Harries Yeh et al, this paper established an impact model of the structure under tsunami bore. The simulation result was compared to the experimental data for validation of the tsunami model.
2.1. Experimental setup
The experiments were carried out in a 16.6 m long, 0.6 m wide, and 0.45 m deep wave tank, as shown in Fig. 1. A single bore was generated by lifting a 6.4 mm thick stainless steel gate, which initially separated a thin layer of water from the impoundment behind the gate. The downstream water depth was maintained at 20 mm. A 120×120 mm square column were used in the present experiments, it has two sides parallel to the tank side walls and consequently the other two perpendicular. To analyze tsunami bore on the square column generated from different impoundment depth H, nine cases including 100, 125, 150, 175, 200, 225, 250, 275, 300 mm were considered in the experiment respectively.
Fig. 1The experiment setup (unit: mm)

a) Plane layout

b) Elevation layout
2.2. Development of 3D numerical model of tsunami bore and analysis of effectiveness
On the basis of experiment, a 3D wave numerical model of structure under impact of tsunami bore was established according to the experiment of impact of long dam-beak bore onto squared column in Herry Yeh et al. [12], shown in Fig. 2. The boundary conditions were set as follows: non-slip solid wall boundary condition was applied to upstream, two sidewalls, and the bottom of the tank. On this boundary, the flux of the fluid was zero and only tangential stress existed. The top of the tank was free surface boundary and the downstream was set as outflow boundary.
Fig. 23D model for tsunami bore

With the above 3D tsunami bore model, this study conducted numerical simulation of interaction of the tsunami bore and the column with 9 different impoundment depths H. Table 1 summarizes the comparison of the maximum horizontal impact force between the experiment and simulation. From Table 1 it can be seen that the maximum error of the simulation was 12.87 %, which occurred with H=100 mm. The second maximum error was 8.70 %, which occurred with H=300 mm. The remaining 7 simulations had errors smaller than 5 %. It indicated that the numerical simulation in this study was relatively accurate. Fig. 3 shows the comparison of time history curves of horizontal impact force onto the column due to the tsunami bore between experimental and simulation result, with different impoundment depths. In Fig. 3, the vertical coordinate is the maximum horizontal impact force acting on the column, the horizontal coordinate is the impact duration, and H Similarly, from the comparison of the time history curves shown in Fig. 3, the overall trend of experiment and simulation was consistent, which reflected the loading process of the column under the impact of the tsunami bore.
Table 1Comparison of the maximum horizontal impact force between experiment and simulation
Impoundment depths (H / mm) | 100 | 125 | 150 | 175 | 200 | 225 | 250 | 275 | 300 | |
Maximum horizontal impact force (N) | Experimental result | 2.268 | 3.645 | 5.254 | 7.184 | 9.752 | 12.092 | 14.840 | 17.989 | 21.086 |
Simulation result | 2.560 | 3.562 | 5.223 | 6.864 | 9.752 | 12.352 | 15.396 | 18.114 | 22.920 | |
Relative error (%) | 12.87 | –2.29 | –0.59 | –4.45 | 0 | 2.15 | 3.74 | 0.70 | 8.70 | |
Fig. 3Comparison of time history curves of horizontal impact force on the column between experiment and simulation with different impoundment depths
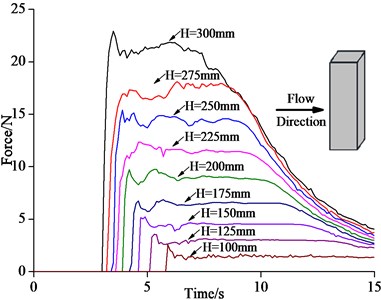
a) Simulation curves
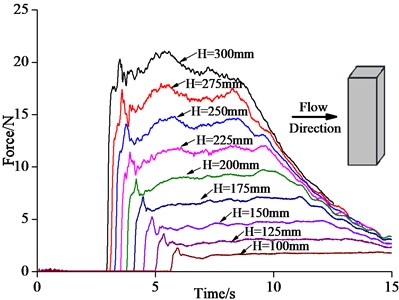
b) Experiment curves
3. Dynamic impact force on the structure due to tsunami bore
Due to the limitation of current physical model conditions in study of anti-tsunami structures, only small-scale structural model under effect of tsunami waves can be carried out. It is difficult to perform full-scale research work on study of anti-tsunami structures. By using the 3D tsunami bore model that was developed in this paper, the impact of tsunami bore on the coastal buildings during tsunami disaster can be well simulated. Numerical models can be created with different case conditions for simulating the impact of tsunami bore onto the coastal buildings and the corresponding structural response can also be analyzed.
3.1. The impact model of tsunami bore onto structure
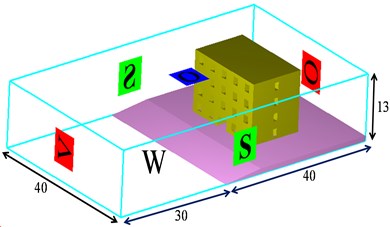
It was assumed that a coastal reinforced concrete frame structure was under the impact of a tsunami bore in this study. The layout of the structure is shown in Fig. 4. This frame structure had 4 floors with the height of 3 m at each floor and 3 spans of 5 m, 3 m, and 5 m, respectively. The cross section of each column was 400 mm×400 mm. The cross section of each beam was 250 mm×450 mm and thickness of the slab was 100 mm. Fig. 5 shows the detailed sketch of 3D tsunami bore model and boundary condition. Considering that the tsunami waves had considerable velocity before approaching the shore and the waves demonstrated a breaking feature, the inlet of the model was set as velocity boundary V. Symmetry boundary S was set at the left- and right-hand side of the computational region of the model. The bottom of the model was solid wall boundary condition W, where the normal velocity of the fluid at this boundary was 0, which did not allow the fluid to flow in or out. The top and the downstream of the model were applied with outflow boundary O, which allowed the fluid to flow freely.
Fig. 4Layout of the structure (unit: mm)
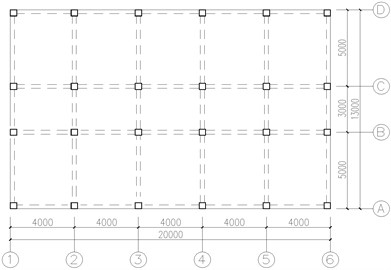
Fig. 53D tsunami bore model of the structure and boundary conditions (unit: m)
3.2. Simulation result and analysis
Table 2 lists the case conditions of simulation and maximum horizontal impact force on the structure. It can be seen in Table 2 that with the increase of wave height and inlet boundary velocity, the maximum horizontal impact force acting on the structure by the tsunami bore demonstrated a significant increasing trend. When the wave height reached 3 m, 4 m, and 5 m, the maximum horizontal impact forces were 3.1, 5.2, and 7.6 times than that at wave height of 2 m. Clearly, the key impact factors of impact force of tsunami bore on the structure were wave height and impact velocity.
Table 2Case conditions of simulation and maximum horizontal impact force on the structure
Wave height (H/m) | Velocity boundary (m/s) | Maximum horizontal impact force (kN) | Ratio relation |
2 | 4.43 | 982.7 | 1.0 |
3 | 5.42 | 3043.6 | 3.1 |
4 | 6.26 | 5108.7 | 5.2 |
5 | 7.00 | 7461.1 | 7.6 |
The time history curve of horizontal force acting on the structure by the tsunami bore was obtained through simulation with 4 different wave heights, shown in Fig. 6. With the increase of the wave height, during the period from the initial impact time of the tsunami waves on the structure to 10 seconds later, the horizontal impact force acting on the structure by the waves increased rapidly at the initial stage, followed by an oscillation process with unsteady force. The dynamic effect of the force was very clear. It was mainly attributed to the strong turbulent phenomenon that was generated during the impact process of the tsunami bore on the structure, which induced unsteady forcing on the structure. Meanwhile, the reflection of the waves could also affect the forced state of the structure. During 10 to 20 seconds after the initial impact, the horizontal force tended to be steady. At this time, the horizontal force acting on the structure was primarily dynamic water pressure force.
Fig. 6Time history curves of horizontal forces on the structure by tsunami
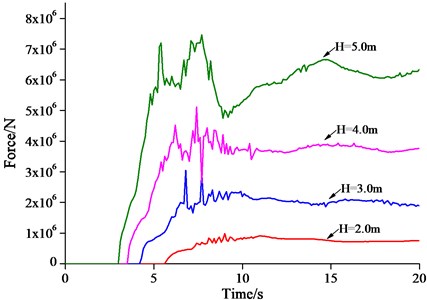
Fig. 7Impact on the structure by the tsunami bore with wave height H= 3 m

a)T= 4.4 s

b)T= 4.9 s

c)T= 6.8 s
Fig. 7 shows a series of structure under impact of the tsunami bore with wave height H=3 m. Fig. 7(a) shows the scenario at T= 4.4 s after the initial impact between fluid and the structure. In this figure, it can be seen that the fluid started to impact the bottom of the structure and had not climbed along the structure. Fig. 7(b) shows the relative location of the fluid and the structure at impact time T of 4.9 s. It is clearly demonstrated that the fluid started to climb along the structure at this moment. When the impact time lasted to T= 6.8 s, shown in Fig. 7(c), the fluid reached the maximum elevation on the structure, where the reflection phenomenon occurred. Consequently, the impact force on the structure by the fluid reached the maximum value.
4. Structure response analysis under the impact of tsunami bore
Due to the strong dynamic effect of impact on the structure by the tsunami bore, the time between the initial impact and the occurrence of the maximum impact force was very short. To date, the study of the dynamic response of structures under the impact of tsunami bore are very rare. Degree of the dynamic effect on the structure due to the tsunami bore is also unclear. In the design of the anti-tsunami structures, how to consider the dynamic effect of the impact load due to the tsunami bore is an urgent question. Therefore, analysis of the dynamic effect of the structure under the impact of the tsunami bore and determining the dynamic characteristics of the structure are of great importance.
4.1. Static response of the reinforced concrete frame under the impact of tsunami bore
The concrete grade of the frame is C30, the axial compressive strength is 20.1 MPa, the passion ratio is 0.2, elastic modulus is 3.0×10⁴ MPa and density is 2400 kg/m3. HRB400 is adopted for the longitudinal load-bearing bar and stirrups, the standard yield strength is 400 MPa, the passion ratio is 0.3, elastic modulus is 2.0×10⁵ MPa and the density is 7850 kg/m3.
Fig. 8Finite element model of the frame structure
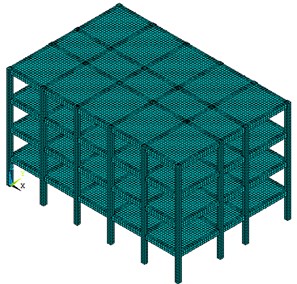
Fig. 9Local fiber reinforced steel REINF264
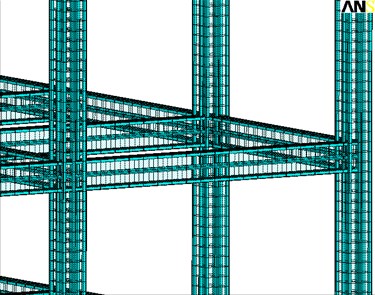
The 3D finite element model was created for the frame with the finite element software ANSYS, shown in Fig. 8. Beam-column element was selected as BEAM 188 [13] in the analysis of structure, which is suitable for analysis of slender, medium and long beams and columns. SHELL63 [13] element was selected for the slab element of the structure, which had bending and membrane characteristics. In this simulation, multilinear kinematic hardening model was used to simulate the elastoplasticity of the concrete. On this basis, the concrete constitutive relation proposed by Hongestad [14] is employed to realize the simulation. To precisely simulate the relative positioning between the steel and concrete, this paper employed separate model. This model used strengthened fiber reinforced element REINF264 [13] to simulate the steel bars in structural beams and columns. Bilinear kinematic hardening model was used to simulate the mechanical characteristics of elastoplasticity of the fiber reinforced steel. REINF264 element was formed on the basis of existing solid base element with built-in of beam column element. The same base element could specify multiple strengthened fiber reinforced element at the same or different directions, which could accurately reflect the relative position of the steel bar and concrete. Partial fiber reinforced element is shown in Fig. 9.
In the static analysis, the maximum value of the horizontal force in the time history curve of the impact force on the structure due to the tsunami bore can be treated as the static load of the structure that was acted on the frame. The maximum displacement along the direction of the tsunami impact was calculated under the maximum load in the simulation. Table 3 gives the maximum horizontal displacement along the direction of the waves at the structure top under different case conditions. In Table 3, it can be known that the maximum horizontal displacement at the structure top increased with the increase of maximum horizontal impact force.
Table 3Maximum static displacement of the reinforced concrete frame under the impact of tsunami bore
Wave height (H/m) | Maximum horizontal impact force (kN) | Maximum horizontal displacement at the structure top (mm) |
2 | 982.7 | 0.72 |
3 | 3043.6 | 2.93 |
4 | 5108.7 | 6.10 |
5 | 7461.1 | 12.39 |
4.2. Dynamic analysis of the reinforced concrete frame under the impact of tsunami bore
Structural transient dynamic analysis (sometimes called time-history analysis) was usually used to determine the dynamic response of the structure with the time dependent various load such as impact load and shock load. It can be used this type of analysis to determine the time-varying displacement, velocity, acceleration, and force in a structure as it responds to any combination of static, transient, and harmonic loads. Due to strong dynamic effect of impact of the tsunami bore on the structure, the time between the initial impact and the occurrence of maximum impact was very short. Therefore, transient dynamic analysis of the structure under impact of the tsunami was necessary.
Modal analysis is mainly used to determine the vibration characteristics of structure, such as the structure natural frequency and vibration mode. The structure natural frequency and vibration mode are the important parameters in the design of structure under dynamic loading and also the foundation of other kinds of dynamic analysis. On many occasions, the modal analysis plays a decisive role. The multi degree of freedom system does not have the same number of natural frequency as the DOF, but also has the corresponding style of vibration mode, expressed as the equation of motion in the form of a matrix:
where {¨u} is the acceleration vector, {u} is the displacement vector, [M] is the mass matrix, [C] is the damp matrix and [K] is the stiffness matrix.
From the Eq. (1), the characteristic equation could be derived:
Accordingly, It has characteristics of n: natural frequency ωi and vibration mode {ϕ}i (i=1, 2, 3,…, n), they form a complete set of modal, which is used to represent dynamic vibration characteristics of the structure.
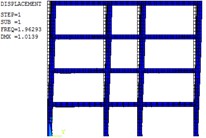
To determine the vibration characteristics of the structure, ANSYS was used to perform modal analysis for the frame. The finite element model of the modal analysis is shown in Fig. 8. The first two order mode of the frame are shown in Fig. 10, which the deformation of the structure are mainly in translation. The calculation results of the first eight vibration modes of natural frequency are summarized in Table 4.
Table 4The first eight vibration modes of natural frequency (unit: rad/s)
Vibration modes | 1 | 2 | 3 | 4 | 5 | 6 | 7 | 8 |
Natural frequency | 12.33 | 12.90 | 14.60 | 38.73 | 40.20 | 45.46 | 67.83 | 69.52 |
Fig. 10First two order mode of the frame
a) First order mode
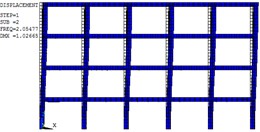
b) Second order mode
In the structural dynamic analysis, the basic equation of motion solved by a transient dynamic analysis is:
where [C] is the structural damp matrix, {˙u} is the nodal velocity vector and {F(t)} is the load vector.
It is necessary to determine the damping. In this paper, Rayleigh damping was used, following:
where α is mass damping coefficient, β is stiff damping coefficient. The two coefficients can be obtained from Eq. (5) and (6), respectively:
where ωi and ωj are ith and jth natural frequency of the structure. ξi and ξj are the damping ratio of ith and jth vibration mode. In this paper, the damping ratio of the reinforced concrete was set to be 0.05 and corresponding vibration modes were selected as the first and second mode of the structure.
Fig. 11Time history curve of displacement of structure top
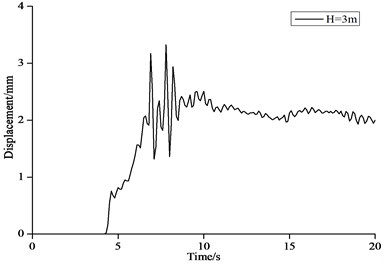
a)H=3 m
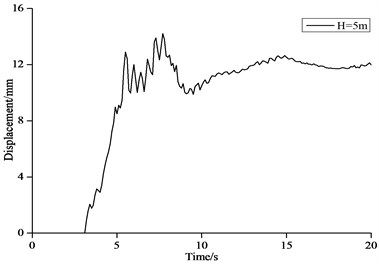
b)H= 5 m
Structural transient dynamic analysis includes full method, reduced method, and mode superposition method. This paper applied full method to perform the dynamic response analysis, i.e., using complete system matrices to calculate the transient dynamic response of the structure. It could include all kinds of structural non-linear deformations. In the transient dynamic calculation, initial condition of the structure should be determined firstly. Both initial displacement and velocity were zero before the impact of tsunami waves on the structure. Hence only the corresponding gravitational load was acted on the structure.
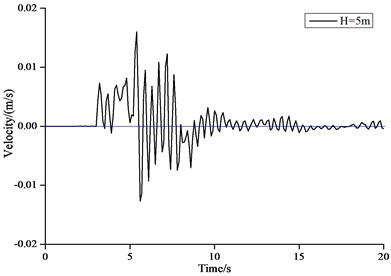
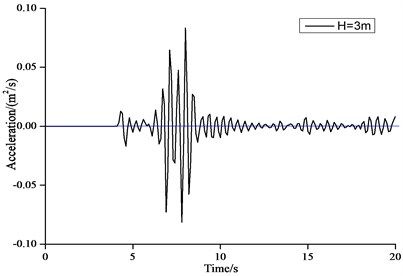
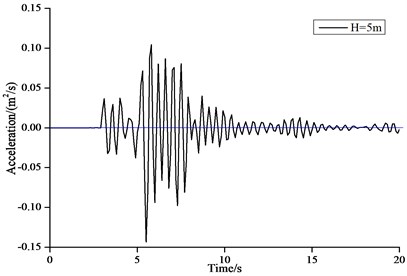
Fig. 11 shows the time history curves of horizontal displacement of the structure top with wave height of 3 m and 5 m. Fig. 12 shows the time history curves of horizontal velocity of the structure top with wave height of 3 m and 5 m. Fig. 13 shows the time history curves of horizontal acceleration of the structure top with wave height of 3 m and 5 m.
In Fig. 11-13 it can be seen that the dynamic impact effects of the tsunami bore on the structure were very different at different impact time. From 0 to 5 s, the structure start to vibrate from the stationary state, while the displacement, velocity and acceleration were small. From 5 to 10 s, the displacement, velocity and acceleration at the structure top reached the maximum values. From 10 to 20 s, the vibration of the structure decayed rapidly until close to the initial stage. This time of period belonged to the last stage of the forced vibration of the structure. The displacement of the structure tended to be stable, while the velocity and acceleration were close to 0.
Fig. 12Time history curve of velocity of structure top
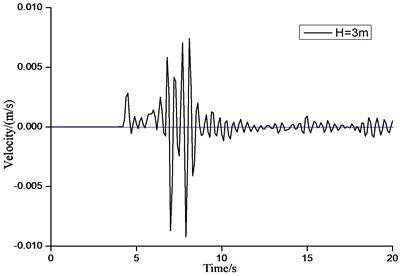
a)H= 3 m
b)H= 5 m
Fig. 13Time history curve of acceleration of structure top
a)H= 3 m
b)H= 5 m
Table 5 gives the maximum dynamic displacement of the reinforced concrete frame and the dynamic magnification factor of the structure under the impact of the tsunami bore. Structural dynamic magnification factor indicated the ratio between the maximum dynamics displacement value of the structure under the varying load with respect to time and the static displacement value under the static force that was equal to the maximum value of the varying load. Table 5 indicated that the dynamic displacement of the structure was larger than the corresponding static displacement. Because the lasting time of the maximum impact force on the structure due to the tsunami bore was short, the impact force reached the maximum value and decreased rapidly. Therefore, the dynamic magnification factor of the structure was relatively small, where the maximum value of 1.147 occurred when the tsunami wave height was 5 m. It indicated that the impact effect of the tsunami bore on the structure had certain magnification effect. In the tsunami disaster regions, design of the anti-tsunami structures could take conservative dynamic magnification factor of 1.2.
Generally speaking, in order to reduce the tsunami wave impact forces acting on the structure, taking into consideration the structural feature of buildings, houses with structural forms which could resist tsunami impact should be constructed. When constructing houses in areas exposed to tsunami hazard, the engineering prevention and control measures should be taken, for example, upstream walls should not be arranged excessively at the bottom of the house, and the bottom layer should be designed into the open and transparent type, which can help to shunt tsunami waves, to reduce the impact of tsunami wave on the structure. Due to the tsunami wave propagation velocity is very high, so decrease the speed of tsunami waves can effectively reduce the tsunami impact force acting on the structure, therefore, it is can be set up seawall in the tsunami potential coastal area to decrease the speed of tsunami waves. Moreover, the tsunami impact force is local structural force which just only affect the bottom components of the structure, so that in anti-tsunami design, the strength of bottom components should be strengthened to improve the load-bearing ability of the structure.
Table 5Maximum dynamic displacement of the reinforced concrete frame under impact of tsunami bore
Wave height (H/m) | Maximum horizontal impact force (kN) | Maximum displacement of structure top (mm) | Dynamic magnification factor |
2 | 982.7 | 0.77 | 1.070 |
3 | 3043.6 | 3.32 | 1.133 |
4 | 5108.7 | 6.95 | 1.139 |
5 | 7461.1 | 14.21 | 1.147 |
5. Conclusions
On the basis of the computational fluid dynamic theory, the three dimensional wave numerical model was established and validated for tsunami bore to study its impact force on the structure. The static and dynamics response of the structure under the impact of tsunami bore were compared by using ANSYS. This study indicated the magnification effect of tsunami bore onto the structure, which provided theoretical basis of design of anti-tsunami structures. Through model calculation and analysis above, the conclusions were drawn:
1) Through comparison between experimental result and the numerical result of this study, it can be shown that the 3D numerical model for the impact of tsunami bore on the structure had excellent effectiveness. The relative error between the simulation and experimental value was very small.
2) Using the interaction model between the tsunami bore and the structure in this paper, the model was created to study impact of tsunami bore with different wave heights on a four-floor reinforced concrete frame. The time history curves of horizontal impact force on the structure due to the tsunami bore were obtained.
3) The impact of the tsunami bore on the structure had a certain dynamic magnification effect. The impact force should not be treated as static load. Through the structural static analysis and transient dynamics analysis under the impact of tsunami onto the structure, the dynamic magnification factor was determined. For safety reason, the structural dynamic magnification factor of 1.2 was suggested.
4) Due to the different dynamic characteristics of the different structures, as well the variation of the period of tsunami waves that acted to structures, the impact effect of tsunami waves on structures had strong nonlinear feature and randomness. Therefore, the dynamic magnification effect of different structures under different tsunami bores is subjected to further studies.
References
-
FEMA P646. Guidelines for Design of Structures for Vertical Evacuation from Tsunamis. Federal Emergency Management Agency, Washington, D.C., 2012.
-
National Oceanic and Atmospheric Administration. Designing for Tsunamis Background Papers, 2001.
-
FEMA 55. Coastal Construction Manual (3rd Edition). FEMA, Washington, D.C., 2003.
-
Harry Yeh Design tsunami forces for onshore structures. Journal of Disaster Research, Vol. 2, Issue 6, 2007, p. 531-536.
-
John W. van de Lindt, Rakesh Gupta, Rachel A. Garcia, Jebediah Wilson Tsunami bore forces on a compliant residential building model. Engineering Structures, Vol. 31, 2009, p. 2534-2539.
-
Al-Faesly T., Palermo D., Nistor I., et al. Experimental modeling of extreme hydrodynamic forces on structural models. International Journal of Protective Structures, Vol. 3, Issue 4, 2012, p. 477-506.
-
Ramsden J. D., Raichlen F. Forces on vertical wall caused by incident bores. Journal of Waterway, Port, Coastal, and Ocean Engineering, ASCE, Vol. 116, Issue 5, 1990, p. 592-613.
-
Taro Arikawa Structural behavior under impulsive tsunami loading. Journal of Disaster Research, Vol. 4, Issue 6, 2009, p. 377-381.
-
Flow-3D. Flow-3D User Manual: Excellence in Flow Modeling Software V10.0 Flow Science, Inc., Santa Fe, N.M, 2011.
-
Hirt C. W., Nicholas B. D. Volume of fluid (VOF) method for the dynamics of free boundaries. Journal of Computational Physics, Vol. 39, 1981, p. 201-225.
-
Hirt C. W., Sicilian J. M. A porosity technique for the definition of obstacles in rectangular cell meshes. Proceedings of the 4th International Conference on Ship Hydrodynamics, National Academic of Science, Washington, D.C., 1985, p. 1-19.
-
Halldor Arnason, Catherine Petroff, Harry Yeh Tsunami bore impingement onto a vertical column. Journal of Disaster Research, Vol. 4, Issue 6, 2009, p. 391-403.
-
ANSYS. Inc. ANSYS Mechanical APDL-Element Reference Release 13.0, 2010.
-
Hognested E. Concrete Stress Distribution in Ultimate Strength Design. Portland Cement Association, Research and Development Laboratories, ACI, 1955, p. 455-479.
About this article
The authors would like to express sincere gratitude to the Prof. Herry Yeh for providing the original experimental data.
