Abstract
The flow noise in household refrigerators is quantified in this study. First, the sound pressure measurements in a quiet room using typical household refrigerators are conducted and the noise characteristics of the refrigerators are presented. Then, the flow noise in household refrigerators is quantified using the results of the overall analysis and Fourier transform of the measured sound pressure data. After that, the flow noise in household refrigerators is quantified using the sound pressure measurements conducted using a specially designed test rig. The frequency characteristics of the flow noise in household refrigerators are also explored and the contribution of the flow noise is identified.
1. Introduction
Refrigerators operate all day and propagate noise [1-4]. Most of the inhabitants are annoyed by refrigerator noise [3-4]. It should be noted that there are different sound sources including the compressor, fan and flow noises in household refrigerators [4-7]. However, identification and quantification of the flow noise in household refrigerators is difficult as it is not easy to distinguish the flow noise from other sound sources in refrigerators. Furthermore, the flow noise in refrigerators may be relatively high and such noises may affect the sound quality of the product [8-9]. Especially, during sleeping hours, the noise propagated by a refrigerator could be very annoying because of the decrease of the background noise at night. Therefore, there is a need for the quantification of the flow noise in household refrigerators.
There have been some studies on the root causes of the flow noise in the literature [10-13]. The shapes and layouts of the capillary tube, evaporator inlet pipe, capillary outlet pipe and the outlet section of the heat exchanger as well as the speed and type of the refrigerant affect the flow noise [10-13]. In this case study, the flow noise of a modern household refrigerator is quantified via an effective experimental approach. First, the sound pressure measurements in a quiet room (representing a kitchen of a typical house) using the sample household refrigerator are conducted and the noise characteristics of this typical household refrigerator are presented. Then, the flow noise in the refrigerator is quantified using the results of the overall analysis and Fourier transform of the measured sound pressure data. After that, the flow noise in the household refrigerator is quantified using the results of the sound pressure measurements conducted using a specially designed test rig. The frequency characteristics of the flow noise in the refrigerator are also explored and the contribution of the flow noise is identified.
2. Methodology
The schematic of the experimental test setup used to present the noise characteristics of household refrigerators and quantify the flow noise is shown in Fig. 1(a) where p1 and p2 are the sound pressures measured inside and outside the refrigerator, respectively. The distances of the microphone p2 from the refrigerator and the ground are 30 and 70 cm, respectively. A quiet acoustic space is created by placing some panels whose inner surfaces are covered by sound absorbing materials around the test refrigerator. The properties of the refrigerator under investigation are listed in Table 1. The sound pressure measurements are performed after the test refrigerator reaches to the steady state conditions (i.e., after the refrigerator operates for t=24 hours). A special test rig providing remote control of the subcomponent including the compressor and fan is also designed to quantify the flow noise in household refrigerators. The unnecessary components creating difficulty to identify the flow noise are excluded from the test rig. Overall, the test rig includes mainly half of the refrigerator airframe, compressor, fan, heater, evaporator and cooling pipes. The schematic of the test rig is shown in Fig. 1(b) where p1 and p2 are the sound pressures measured inside and outside the cabinet, respectively. The temperature T on the surface of the inner panel is also measured.
Fig. 1The schematics of a) the household test refrigerator and b) the designed test rig
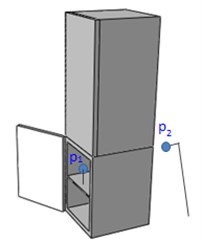
a)
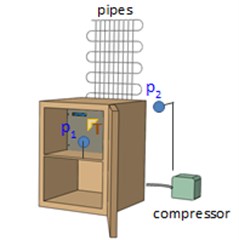
b)
Table 1Properties of the household refrigerator under investigation.
Dimensions | Main Functions | Volume | Performance |
Height (mm): 1900 | Cooling system: No-frost | Total (lt): 475 | Energy efficiency class: A+ |
Width (mm): 700 | Super cooling function: + | Cooler (lt): 360 | Season class: T |
Depth (mm): 750 | Super freezing function: + | Freezer (lt): 115 | Freezing capacity (kg/24 h): 6 |
The sound pressure signals are first recorded with a high sampling rate (fs=32.8 kHz) and then the overall and Fourier analyses of the signals are performed [14-16]. The overall value of a time-domain sound pressure signal based on exponential averaging (with time weighting τ) at any time t is determined as follows:
where pτ(t) is the instantaneous time varying sound pressure and ζ is a dummy variable of integration. The overall sound pressure level for a given τ value as a function of time t is finally determined as follows:
where p0=20 μPa is the value of the reference sound pressure. The Fourier Transform (FT) of the time domain p(t) signal is conducted as follows [16]:
where f represents the frequency and j=√-1. The overall analyses are conducted with τ=1/4 s and the FT signal processing parameters are ∆ 4 Hz and averaging time 0.5 s (the overlap is 66.7 % and the number of averages is 6) in this study. The frequency range is selected to be quite wide (i.e., 1 Hz-12.8 kHz).
Overall, the main objectives of this study are as follows: 1) Present the characteristics of typical household refrigerators; 2) quantify the flow noise in household refrigerators; 3) quantify the flow noise using the designed test rig; 4) explore the frequency characteristics of the flow noise; and 5) identify the contribution of the flow noise in household refrigerators.
3. Noise characteristics of household refrigerators
Here, the temperatures of the freezer and cooler of the test refrigerator are set as –22°C and +4°C, respectively. The overall sound pressure levels for a duration of 12000 s (or 3 hours 20 minutes) are plotted in Fig. 2. One of the cycles of the refrigerator operation in Fig. 2 (i.e, the data from 2880 to 3600 s) is re-produced in Fig. 3. The FT of the data in Fig. 3 is also plotted in Fig. 4.
Fig. 2Overall sound pressure levels measured inside (p1) and outside (p2) the refrigerator
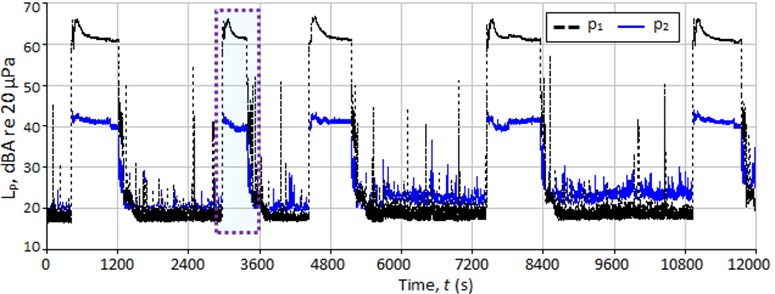
Fig. 3Overall sound pressure levels measured inside (p1) and outside (p2) the refrigerator for one cycle of the refrigerator operation
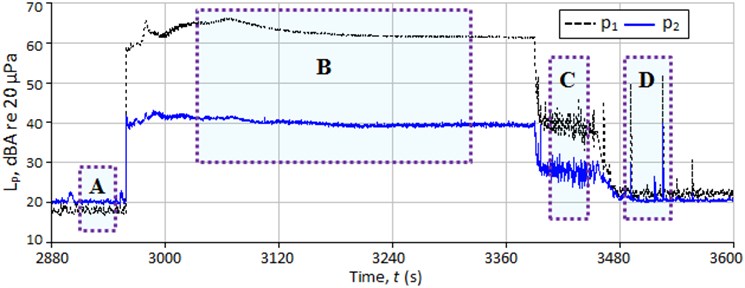
It is seen that there are mainly four regions labelled as A, B, C and D in Fig. 3. The region A corresponds to the background noise where 18 dBA. The compressor and fan are on in the region B and the measured sound pressure levels are quite high in this region (i.e., 60 dBA and 40 dBA). The fan is off and the compressor operates with a small power to provide the flow circulation of the refrigerant in the region C. Therefore, the flow noise is dominant in the region C. Specifically; there are some crack noises in the region D, which is outside the scope of this paper. The results in Figs. 3-4 show that the sound pressure levels in the region C are lower than those in the region B and higher than those in the region A.
Fig. 4The FT results of the data measured inside – p1 a) and outside – p2 b) the refrigerator for one cycle of the refrigerator operation
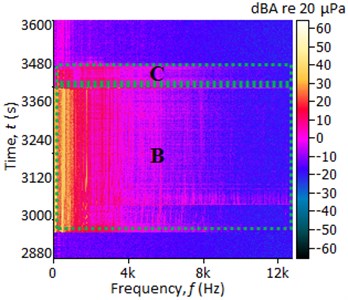
a)
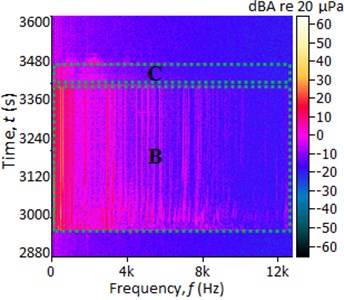
b)
4. Quantification of the flow noise in household refrigerators
Fig. 5Overall sound pressure levels measured inside (p1) and outside (p2) the refrigerator
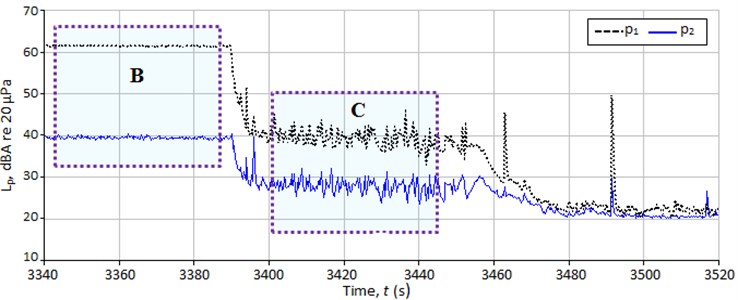
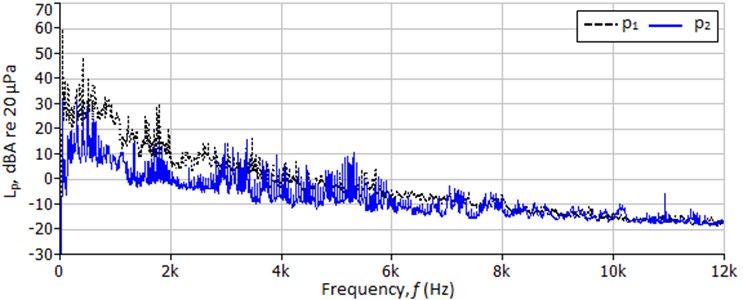
Fig. 6The FT results of the data measured inside (p1) and outside (p2) the refrigerator for the region B where the compressor and fan are on
The region where the flow noise is dominant in Figs. 3-4 (i.e, the data for 3340-3520 s) is re-produced in Fig. 5. It is seen that the sound pressure levels are about 62 dBA and 40 dBA for the region B and 40 dBA and 28 dBA for the region C. It should be noted that the background noise is about 20 dBA. It is seen that the sound pressure levels when the compressor and fan are on (the region B) are at least 10 dB greater than those where the flow noise is dominant (the region C).
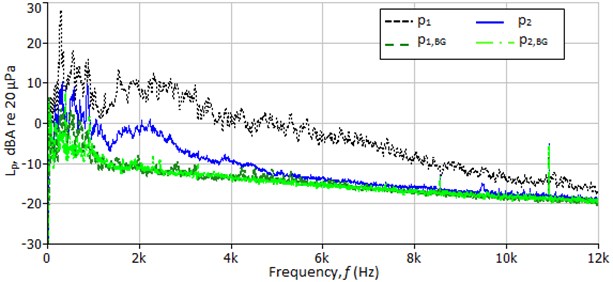
The FT of the data in the region B in Fig. 5 is plotted in Fig. 6. As seen, the sound pressure levels are higher at some specific frequencies (corresponding to the compressor and fan rotating speeds) as expected. The FT of the data in the region C in Fig. 5 together with background noise are also plotted in Fig. 7. It is seen in Fig. 7 that the flow noise is dominant for a wide frequency range; specifically the sound pressure levels being high between 100-500 Hz and 2-4 kHz.
Fig. 7The FT results of the data measured inside (p1) and outside (p2) the refrigerator for the region C where the flow noise is dominant and the background noises measured inside (p1,BG) and outside (p2,BG) the refrigerator
5. Quantification of the flow noise using the special test rig
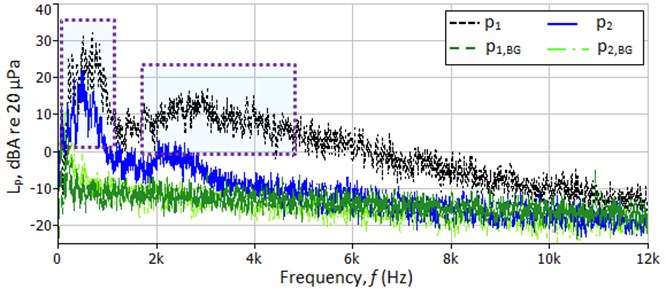
The compressor and fan in the designed test rig in Fig. 1(b) are first operated for a while and they are then off; this repeats three times. The scenario of the test is presented in Table 2. The temperature and sound pressure levels for this scenario are plotted in Fig. 8. It is seen that the temperature varies between –35°C and –15°C. As seen, the test rig including the measurements system and acoustic room is quite repeatable. One of the cycles in Fig. 8 (i.e., the data for 2640-3600 s) is re-produced in Fig. 9. The FT of the region where the flow noise is dominant (i.e., the region C) is also plotted in Fig. 10. It is seen that the overall sound pressure levels and the frequency spectrums of the sound pressure data obtained here are quite similar for those obtained using the household refrigerator presented in Section 4.
Table 2Scenario of the experiment conducted using the designed test rig
(s) | Compressor | Fan |
0-240 | On | On |
240-1560 | Off | Off |
1560-2160 | On | On |
2160-2760 | Off | Off |
2760-3360 | On | On |
3360-3600 | Off | Off |
The results in Fig. 9 show that the sound pressure levels are about 60 dBA and 50 dBA for the region B. The sound pressure levels vary from 40 to 50 dBA and 25 to 40 dBA in the region C. It is seen that the flow noise is at least 10 dB lower than those for the region B. It is also seen in Fig. 10 that the flow noise is dominant for a wide frequency range; specifically the noise magnitudes being high between 100-500 Hz and 2-4 kHz as similar to the results presented in Section 4.
Fig. 8The temperature (T) measured on the surface of the inner panel and overall sound pressure levels measured inside (p1) and outside (p2) the test rig.
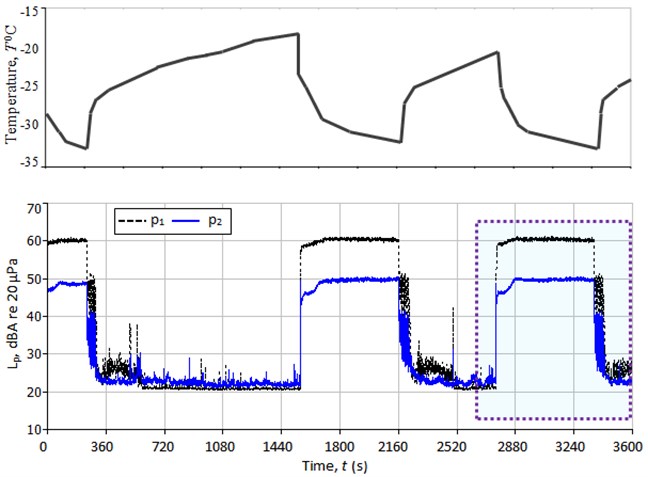
Fig. 9Overall sound pressure levels measured inside (p1) and outside (p2) the test rig
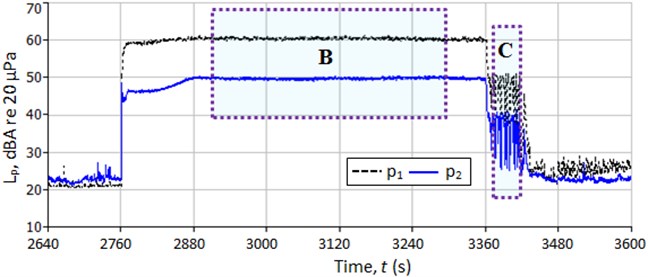
Fig. 10The FT results of the data measured inside (p1) and outside (p2) the refrigerator for the region C and the background noises measured inside (p1,BG) and outside (p2,BG) the test rig
6. Conclusions
The flow noise in a typical household refrigerator is quantified in this case study. Specific contributions of this paper include the following. The noise characteristics of the refrigerator are presented and the flow noise in the household refrigerator is quantified using the results of the overall and Fourier transform of the measured sound pressure data. The flow noise in the sample household refrigerator is also quantified using the sound pressure measurements conducted by using a specially designed test rig. The frequency characteristics of the flow noise are explored and the contribution of the flow noise is identified.
The results show that the flow noise is dominant for a wide frequency range; the noise magnitudes are specifically high between 100-500 Hz and 2-4 kHz. However, the contribution of the flow noise compared to the compressor and fan noises is negligible. Similar noise characteristics are obtained using both the designed test rig and the household refrigerator. It should be noted that the results presented in this study are obtained for a sample case. It can be considered that piping system of the sample refrigerator is designed properly.
References
-
Zwicker E., Fastl H. Psycho-acoustics: Facts and Models. Springer, Berlin, 1999.
-
Jeon J. Y., Ryu J. K. Allowable noise levels of residential noises. Proceedings of Inter-Noise, Honolulu, Hawaii, USA, 2006.
-
Kang J., Kim J. D., Han J. S., Kim H. S., Lee M. R. Noise qualification index for refrigerator aligned with consumers. Proceedings of Inter-Noise, Lisbon, Portugal, 2010.
-
Koruk H., Belek H. T., Alparslan M., Bilgin N., Acar M. A., Akaydin O., Akgul A. Investigation of refrigerator noise on the prototype designs. Proceedings of Inter-Noise, New York City, USA, 2012.
-
Takushima A., Shinobu Y., Tanaka S., Eguchi M., Matsuki K. Fan noise reduction of household refrigerator. IEEE Transactions on Industry Applications, Vol. 28, Issue 2, 1992, p. 287-292.
-
Lee C., Cho Y., Baek B., Lee S., Hwang D., Jo K. Analyses of refrigerator noises. Proceedings of ISIE, Dubrovnik, Croatia, 2005.
-
Han H. S., Jeong W. B., Kim M. S., Kim T. H. Analysis of the root causes of refrigerant-induced noise in refrigerators. Journal of Mechanical Science and Technology, Vol. 23, 2009, p. 3245-3256.
-
Jeon J. Y., You J., Chang H. Y. Sound radiation and sound quality characteristics of refrigerator noise in real living environments. Applied Acoustics, Vol. 68, Issue 10, 2007, p. 1118-1134.
-
Sato S., You J., Jeon J. Y. Sound quality characteristics of refrigerator noise in real living environments with relation to psychoacoustical and autocorrelation function parameters. Journal of the Acoustical Society of America, Vol. 122, Issue 1, 2007, p. 314-325.
-
Kim M. S., Jeong W. B., Han H. S. Analysis of the cause and reduction of refrigerant induced noise in refrigerator. Proceedings of Inter-Noise, Lisbon, Portugal, 2010.
-
Han H. S., Jeong W. B., Kim M. S., Lee S. Y., Seo M. Y. Reduction of the refrigerant-induced noise from the evaporator-inlet pipe in a refrigerator. International Journal of Refrigeration, Vol. 33, Issue 7, 2010, p. 1478-1488.
-
Celik S., Nsofor E. C. Studies on the flow-induced noise at the evaporator of a refrigerating system. Applied Thermal Engineering, Vol. 31, Issues 14-15, 2011, p. 2485-2493.
-
Han H. S., Jeong W. B., Kim M. S. Frequency characteristics of the noise of R600a refrigerant flowing in a pipe with intermittent flow pattern. International Journal of Refrigeration, Vol. 34, Issue 6, 2011, p. 1497-1506.
-
Randall R. B. Frequency Analysis. Brüel & Kjaer, Nærum, 1987.
-
Crocker M. J. Handbook of Acoustics. John Wiley, 1998.
-
Bendat J. S., Piersol A. G. Random Data Analysis and Measurement Procedures. John Wiley, 2010.
About this article
The authors would like to thank to Indesit Company for supporting this study. The authors also specifically thank to Mechanical Engineer Onur Akaydin from Pro-Plan Ltd., Mechanical Engineer Murat Alparslan and Prof. H. Temel Belek from EDA Ltd. for their assistance.
