Abstract
Local Mean Decomposition (LMD) is a new self-adaptive time frequency analysis method. In present paper, the effectiveness of LMD method to extract fault features of gears, which are multi-component amplitude modulation (AM) and frequency modulation (FM), is demonstrated. A series of tests on tooth wearing, breaking and spalling gears are conducted and analyzed by LMD. And the fault features extracted by LMD are compared with those obtained from conventional Hilbert transform (HT). Moreover, the gear faults are identified by kurtosis based on LMD decomposed signals. The results demonstrate that the scheme combining LMD method with kurtosis analysis is effective to extract the characteristics of fault gears and improve the accuracy of fault diagnosis of gears.
1. Introduction
Gear transmission is the most important way to transfer speed and power from one rotational shaft to another. Malfunction of gear transmission during operation process may lead to reduction of machining precision and integral performance of products, and more seriously, the failure of entire mechanical system. Thus a number of researchers have been focusing on gear fault diagnosis to aim at detecting the malfunction of gearboxes before severe accident occurs in recent years [1].
The means to diagnose gear faults can be categorized into model-based method [2], data-driven method [3] and signal-based method [4, 5]. In the model-base method, gear faults are diagnosed by detecting the consistency between the observed behavior and the predicted behavior through gear mathematical model [6]. Practical applications of model-based fault diagnosis methods are limited since it is hard to obtain an accurate model which is able to represent the behavior of real devices [7]. Data-driven diagnosis methods like artificial intelligence methods diagnose gear faults by evaluating the estimation residuals between new measurement values and historical data [3, 8]. However, such methods highly rely on relationships between correlated measurement ways within the system and the training data obtained from various operation conditions. Signal-based methods compare features extracted from a signal with desired normal baseline values and they are usually effective and economical. Hence signal-based gear fault diagnosis methods have been extensively used in various gear fault diagnosis fields by far [9].
When the gears are in fault, the most vibration signals are multi-component modulation signals. Hence some vibration envelope decomposition methods to analyze gear faults have been investigated and led to a number of industrial applications [10, 11]. Among these methods, Hilbert is typical to analyze the decomposition signals and used to diagnose type, localization and damage of gear faults. Compared with other decomposition methods, Hilbert has high resolution and may decompose frequency modulation components at high signal-to-noise ratio. But it is applicable to single component decomposition signal analysis only while the signals of gear faults are usually multi-component AM-FM signals. Moreover, window effect usually appears in Hilbert analysis. It means Hilbert is not applicable to gear fault diagnosis. With rapid development of signal processing techniques, some researchers attempted to introduce unsteady signal processing methods, such as wavelet [12] and Hilber-Huang transforms (HHT) [13], into fault diagnosis of gearboxes to extract the characteristics of the fault gears by analyzing AM-FM signals. These analysis methods are able to simultaneously generate time and frequency information of a signal through mapping a one-dimensional signal to the two-dimensional time-frequency field capable to detect gearbox fault. However, either wavelet transform or HHT has its disadvantage. The physical significance of instantaneous amplitude and frequency obtained from wavelet transform is not clear since it is non-adaptive. And the selection of mother wavelet function, decomposition level of signals and time-frequency resolution of signals are also impediments in wavelet transform analysis. In HHT, the spline fitting method is utilized to conduct spectrum analysis, but the result is not satisfying yet and the difficulties like mode mixing and end effects are to be overcome. Moreover, it is hard to achieve the full time-frequency distribution by HHT. Since neither wavelet transform nor HHT is based on signal decomposition, it is not probable to use them to diagnose faults of gearboxes in working conditions. To improve the wavelet and HHT method, some efforts have been carried out in recent years. For example, Rafiee et al. [14] employed genetic algorithm to select mother wavelet function and decomposition level in gear fault diagnosis. Parey et al. [15] proposed an improved model to simulate the torsional vibration for a spur gear pair. Both the simulated and the experimental signals are decomposed by means of experience mode decomposition (EMD), in which the statistical parameters are evaluated on instinct mode functions (IMFs). Ricci and Pennacchi [16] conducted gear fault diagnosis based on EMD and automatic selection of intrinsic mode functions and a merit index was introduced that allows the automatic selection of the intrinsic mode functions to be used in their work.
Based on HHT, a new local mean decomposition (LMD) method was proposed by Jonathan S. Smith [17]. It is a new self-adaptive time–frequency analysis method which is suitable to analyze multi-component nonlinear unsteady signals originated in gear faults. Though LMD is a probable method to diagnose gear faults, rare research has been conducted so far. Cheng et al. [18] carried out some tests on rotors and analyzed the potentials of LMD method for fault diagnosis of roller bearings and gearboxes. However, their work was focused on the fault of gears induced by wearing only.
Present study attempts to estimate the effectiveness of LMD method on diagnosis of gears induced by one tooth wearing, breaking and spalling. The advantages of LMD based signal processing for multi-component AM-AF signals are analyzed. By comparing the test results with those obtained from conventional methods such as HT, the advantages of the LMD method in fault diagnosis of gears are demonstrated. In addition, the types of gear faults are identified by kurtosis analysis, under the condition that the gear has a fault by LMD method.
2. LMD performance analysis based on simulation
LMD is a signal demodulation process, in which the vibration signals are decomposed to a series of product function (PF) components and each PF component is derived from an envelope signal multiplied by a pure frequency modulation signal. The instantaneous amplitude (IA) of the PF component, denoted by an amplitude modulation signal, contains the adjustable information of amplitude of the PF component. And the instantaneous frequency (IF) of the PF component, denoted by pure frequency modulation signal, covers the adjustable information of frequency of the PF component [17].
A key point in LMD based analysis in fault diagnosis field is how to decompose the vibration signals. The details of LMD algorithm may refer to some literatures like [19, 20]. Various numbers of PFs may be decomposed during LMD calculation, associated with different ending criterion of iteration. Since the PFs interested in fault diagnosis are those which contain fault information, the decomposition process based on LMD is improved by reducing numbers of PFs to increase the calculation speed. The PFs induced by slight fault are generally covered by noise, therefore small energy PFs decomposed from LMD are almost unable to denote the fault information of a structure. When the energy of decomposed PFs is 90 percent of the original signal energy, the other components are not decomposed anymore in present study.
When gears in fault are meshed, both the amplitude and phase of vibration signals can be modulated. Leaving out the effect of transport function on vibration signals of gears, their fault vibration signals are picked up by sensors seated on the gearbox and they can be expressed by [21]:
where i is the number of tooth-meshing harmonics, fs the rotating frequency, and z the tooth number of the gear. The variables xi, φi, di(t) and bi(t) represent the amplitude and phase of the i-th meshing harmonic wave and their amplitude and phase modulation functions respectively. Since the tooth with local fault meshes only once with another gear in one rotation cycle, di(t) and bi(t) are the periodic functions whose frequencies are the rotating frequency of the gear and its’ multiple. Thus the fault information is included in the vibration signals of the gears. To address the advantages of the LMD method for signal processing of gears, two components of signals are selected and analyzed. Assume the simulation signal is:
where:
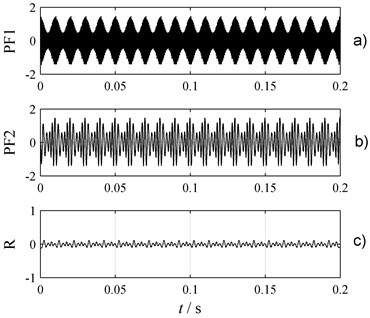
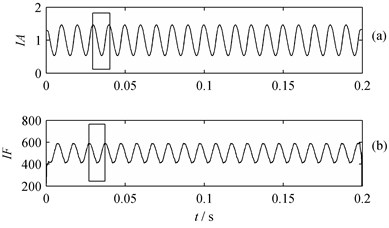
This signal includes an amplitude modulation signal and a frequency modulation signal. The waveform of the signals in time domain, under sampling frequency 10,000 Hz, is shown in Fig. 1. Two PF components and one remainder term deriving from LMD calculation are shown in Fig. 2. The instantaneous amplitude and frequency of two PFs are respectively shown in Figs. 3 and 4.
Fig. 1Waveform of the original signal
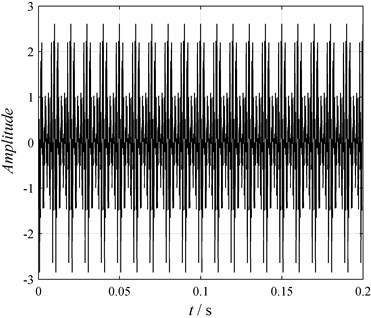
Fig. 2Components: a) PF1, b) PF, c) Remainder
It is shown in Fig. 3 that IA a1 ranges from 0.5 to 1.5 and IF f1 fluctuates at 2000 Hz around. The width of the rectangle shown in Fig. 4 is 0.01 s, which means the wave frequency of IA and IF is 100 Hz. These parameters represent the real features of single component x2. Similarly, the real features of single component x1 are indicated by the waveform of Fig. 4.
Since a simulated multi-component signal is able to be decomposed to a few single component signals with known IA and IF by LMD method, it is feasible to analyze the vibration signals of fault gears by using LMD method.
Fig. 3IA and IF of PF1: a) IA, b) IF
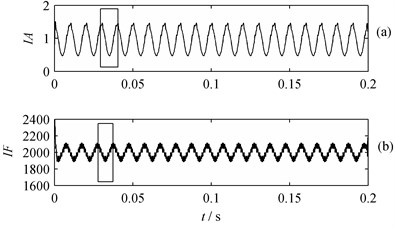
Fig. 4IA and IF of PF2: a) IA, b) IF
3. Experimental work
Three types of gear faults, including tooth wearing, breaking and spalling, are diagnosed by LMD method. Some experimental data are either obtained by tests or collected in researchers’ laboratory work.
The rotational mechanical vibration analysis and fault diagnosis system used in tooth wearing and breaking tests of gears is provided by Jiangsu Chipe Diagnose Engineering Co. LTD and the experimental apparatus is shown in Fig. 5. The tooth numbers of the big and small gears are 75 and 55 respectively in tests.
In tooth wearing tests, one tooth of the big gear is artificially worn to represent the wearing fault, as shown in Fig. 6. Several acceleration transducers are placed along the axial and radial directions of bearing mounting of the big gear to gain vibration signals in these directions. The rotation rate of the small gear is 342 r/min and its sampling frequency is 10000 Hz. Thus, it is calculated that the meshing frequency of the gear is 313.5 Hz and the rotation frequencies of the small and big gears, f1 and f2, are 5.7 Hz and 4.18 Hz respectively.
Fig. 5Experimental apparatus in tooth wearing and breading tests
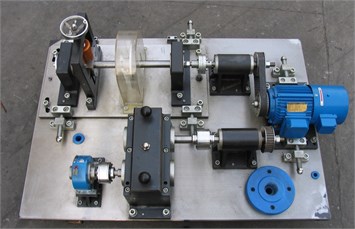
Fig. 6Wearing gear
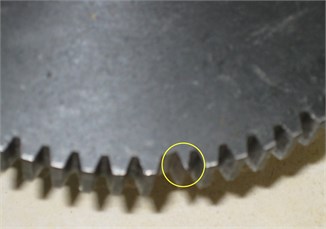
Fig. 7Gear specimen with one broken tooth
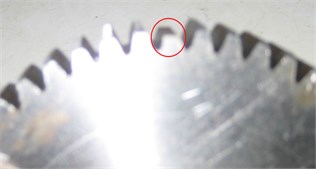
Fig. 8Spalling gear
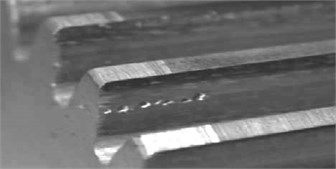
Fig. 7 presents the artificially broken tooth of the small gear in tooth breading tests. The specimens and alignment of transducer in tooth breaking tests are similar to those in tooth wearing tests. The rotation rate of the small gear is 826 r/min and its sampling frequency is 10,000 Hz. Thus, it may be calculated that the meshing frequency of the gear is 757.17 Hz and the rotation frequencies of the small and big gear, f1 and f2, are 13.77 Hz and 10.1 Hz respectively.
The experimental data in spalling tests are collected from Laborelec research center of Université Libre de Bruxelles [22]. The specimen used in the tests is a cluster gear consisting of two gears and the tooth numbers of the big and small gear are 41 and 37 respectively and Fig. 8 shows the spalling gear. In tests, the rotation rate of the big gear is 606 r/min and its sampling frequency is 10,351 Hz. It can be derived that the meshing frequency of the gear is 414.1 Hz, the rotation frequency of the small and big gears, f1 and f2, are 11.19 Hz and 10.1 Hz respectively.
4. Analysis and discussion
The signals of gear faults are multi-component amplitude and frequency modulated signals. They can be decomposed to a series of single PF components with IAs. Using Fast Fourier Transform (FFT), fault characteristic frequencies can be obtained from IAs.
4.1. Waveform of the original signal in time domain
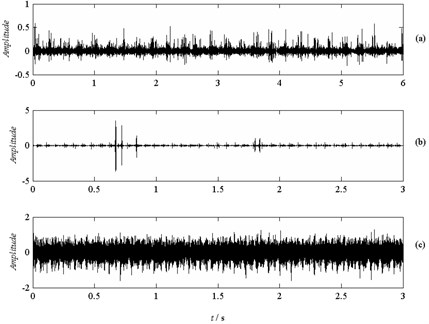
The measured vibration signals in radial direction of three types of gear faults are schematically shown in Fig. 9. It can be observed that the waveforms of these three types of signals have different features in time domain. The waveforms resulting from tooth wearing and breaking tests present obvious impact effect while the waveforms of spalling is not.
Fig. 9Waveform of the original signal in time domain: a) Tooth wearing, b) Tooth breaking, c) Spalling
4.2. Fault diagnosis by FFT and HT
Fig. 10Frequency spectrum: a) Tooth wearing, b) Tooth breaking, c) Spalling
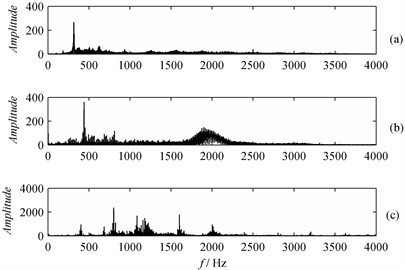
Fig. 11Hilbert spectrum: a) Tooth wearing, b) Tooth breaking, c) Spalling
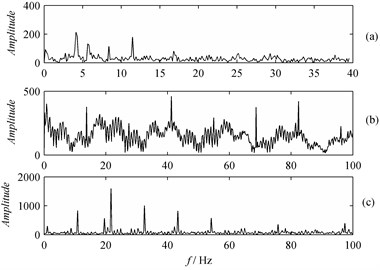
Fig. 10 shows the frequency and its demodulated spectrum of the signals obtained via FFT. It can be found they are rather complex, thus it is almost impossible to judge whether the gear has a fault by frequency spectrum analysis.
Fig. 11 shows the demodulated spectrum of the signals obtained via HT. The spectral lines at fundamental rotation frequency and 2X frequency of the big and small gears are clearly seen in Fig. 11(a). It is shown in Fig. 11(b) and (c) that the spectral line, which represents the fault characteristic frequencies of the gear, is not clearly seen due to the disturbance of noise. Since the characteristic frequencies of both gears are rather obvious, it is not possible to judge which gear has a fault. When the signals are transformed by Fast Fourier and Hilbert, the characteristic frequencies of the small gear are clear while those of the big gear are not. Thus it is usually accompanied with a false conclusion that the small gear is in fault.
4.3. Fault diagnosis by LMD-and FFT
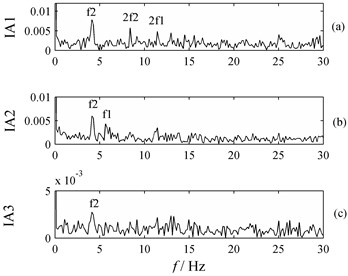
Three PF components are derived from the signal of wearing gear by LMD decomposition. Fig. 12 shows PF components of the signals demodulated by LMD. The amplitude spectrum of IAs, a1, a2 and a3, are obtained from IAs of these PF components via FFT, as shown in Fig. 13. Clear spectral lines at fundamental rotation frequency and 2X frequency of the big gear are present in Fig. 13(a) and (c). However, the spectral line at fundamental rotation frequency of the small gear is not clear and its spectral line at 2X frequency is smaller than that of the big gear. Thus it can be judged that the big gear is in fault. It is worth addressing that the impact effect is obvious under such conditions since only one tooth of gear is worn. If plenty of teeth are worn, instead of impact, the vibration behavior of the gear is enhanced.
Fig. 12PF components: a) PF1, b) PF2, c) PF3
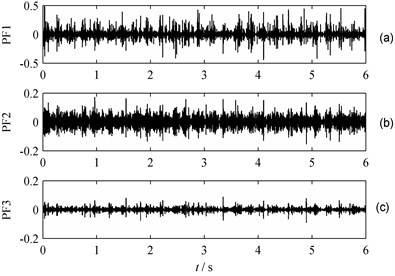
Fig. 13Frequency spectrum of IA obtained from: a) PF1, b) PF2, c) PF3
Five PF components are derived from the signals of tooth wearing gear demodulated by LMD. Fig. 14 presents the first three PF components of the signals. The amplitude spectrum of a1, a2 and a3 are obtained from IAs of these PF components via FFT, as shown in Fig. 15. In Fig. 15(b), spectral lines at rotation fundamental frequency, 2X frequency, 3X frequency, 4X frequency and 5X frequency of the small gear are clearly observed. Thus it can be judged that the small gear is in fault. Based on the analysis results, it is found that LMD method is a better way to obtain frequency demodulated spectrums than HT because the former one may effectively reduce the disturbance of the noise and derive accurate characteristic frequencies of the gear in fault.
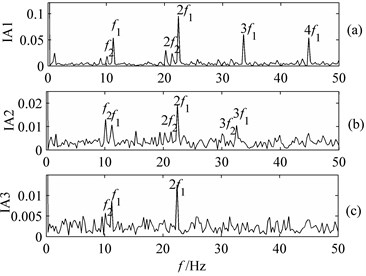
Using LMD, eight PF components are obtained from the signals of the tooth spalling gear. Fig. 16 presents the first three components of the signals. The amplitude spectrum of a1, a2 and a3 are obtained from IAs of these PF components via FFT, as shown in Fig. 17. When the signals are transformed by Fast Fourier and Hilbert, the characteristic frequencies of the small gear are clear while those of the big gear are not. Thus it is usually accompanied with a false conclusion that the small gear is in fault. Compared the results obtained from FFT and Hilbert, the characteristic frequencies of both big and small gears are clear when LMD method is used. Although it is not possible to judge which gear has a fault, it may not lead to misjudgment of fault gears. Obvious characteristic features of fault-free gears are generally caused by placement of transducers and rotation rate of the gears. In such cases, the characteristic frequency spectrum of fault-free gear is clearer than that of the gear in fault. This phenomenon has been observed and explained by Ding et al. in their paper [23].
Fig. 14PF components: a) PF1, b) PF2, c) PF3
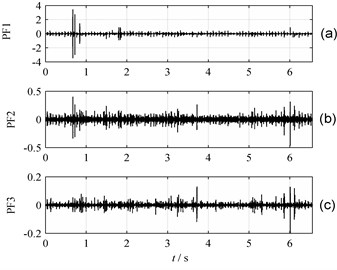
Fig. 15Frequency spectrum of IA obtained from: a) PF1, b) PF2, c) PF3
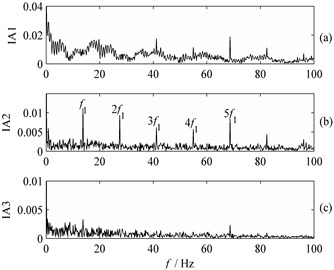
Fig. 16PF components: a) PF1, b) PF2, c) PF3
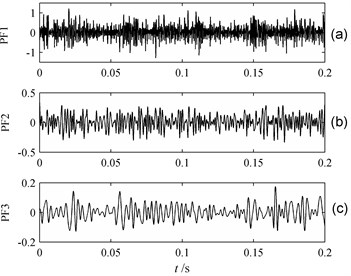
Fig. 17Frequency spectrum of IA obtained from: a) PF1, b) PF2, c) PF3
4.4. Identification of types of gear faults
LMD-FFT method can be utilized to judge whether a gear has a fault or not. However, it is not available to identify the type of the gear fault. Hence kurtosis is introduced into LMD method to achieve this target. Kurtosis is a useful index to denote the fault of the gear box when it is subjected to impulsive loads. It is a fourth statistic and defined by [24]:
where Yi are univariate data and ˉY the mean value of Yi. Based on experimental data and Eq. (5), the kurtosis of PF components decomposed by LMD can be calculated. Table 1 shows the kurtosis values of original signal and its three PF components of the tooth wearing, breaking and spalling gears.
In general, the signal of the measured device presents obvious impact feature if the kurtosis is larger than 3.5. It is found in results listed in Table 1, the kurtosis values of signals of different types of gear faults vary obviously. The kurtosis of original signal of one tooth wearing gear is 15.7, which means the gear is damaged. Moreover, kurtosis values of its three PF components are 77.6, 22.8 and 38.8 respectively, which are much larger than kurtosis of original signal. The kurtosis of original signal of tooth breaking gear is 660.0 and kurtosis values of its three PF components are 671.5, 16.3 and 30.4 respectively. Regarding the spalling gear, the kurtosis values of original signal and its three PF components are 3.2, 3.7, 3.5 and 3.9 respectively.
Table 1Kurtosis of gears in fault
Signals | Fault types | ||
Tooth wearing | Tooth breaking | Spalling | |
Original | 15.7 | 660.0 | 3.2 |
PF1 | 77.6 | 671.5 | 3.7 |
PF2 | 22.8 | 16.3 | 3.5 |
PF3 | 38.8 | 30.4 | 3.9 |
It can be found that the kurtosis value of the tooth wearing gear is 15.7 but that of the tooth breaking gear is 660, which is hundreds of times of the value of normal gear. The kurtosis of original signal of spalling gear 3.2 is a little larger than the value of undamaged one. The PF components of tooth wearing and spalling gears have similar kurtosis values to their original signals while PF1 of tooth breaking gear has the same order value to its original signal only.
Obviously, the kurtosis values vary with different types of gear faults. When a gear is determined to have a fault by LMD, the type of the gear fault can be identified by analyzing its kurtosis.
5. Conclusions
The vibrations signals of gears are complicated and usually disturbed by other signals like noise. In fault diagnosis of gears, it is rather difficult to extract the fault features of such signals through demodulation process by using HT. LMD is an effective approach to diagnose the fault of gears. Using LMD method, the multi-component vibration signals can be adaptively decomposed to a series of PF components. The information related to fault of the gear is extracted by instantaneous amplitude of PF components via FFT. And a series of tests on tooth wearing, breaking and spalling gears are conducted and analyzed by LMD. Based on LMD results, the types of gear faults are identified by kurtosis analysis. The results show that LMD method, together with kurtosis analysis, is effective to determine if the gear is in fault and identify the type of the faulty gear.
References
-
Hussain S., Gabbar H. A. A novel method for real time gear fault detection based on pulse shape analysis. Mechanical Systems and Signal Processing, Vol. 25, Issue 4, 2011, p. 1287-1298.
-
Zhan Y., Mechefske C. K. Robust detection of gearbox deterioration using compromised autoregressive modeling and Kolmogorov-Smirnov test statistic – Part I: Compromised autoregressive modeling with the aid of hypothesis tests and simulation analysis. Mechanical Systems and Signal Processing, Vol. 21, Issue 5, 2007, p. 1953-1982.
-
Saravanan N., Siddabattuni V. N. S., Ramachandran K. I. Fault diagnosis of spur bevel gear box using artificial neural network (ANN) and proximal support vector machine (PSVM). Applied Soft Computing, Vol. 10, Issue 1, 2010, p. 344-360.
-
Yang Y., He Y., Cheng J., Yu D. A gear fault diagnosis using Hilbert spectrum based on MODWPT and a comparison with EMD approach. Measurement, Vol. 42, Issue 4, p. 542-551.
-
Feng Z., Chu F. Application of atomic decomposition to gear damage detection. Journal of Sound and Vibration, Vol. 302, Issue 1, 2007, p. 138-151.
-
Ettefagh M. M., Sadeghi M. H., Rezaee M., Chitsaz S. Latent component-based gear tooth fault detection filter using advanced parametric modeling. Mechanical Systems and Signal Processing, Vol. 23, Issue 7, 2009, p. 2260-2286.
-
Lei Y., Zuo M. J., He Z., Zi Y. A multi-dimensional hybrid intelligent method for gear fault diagnosis. Expert Systems with Applications, Vol. 37, Issue 2, 2010, p. 1419-1430.
-
Samanta B. Gear fault detection using artificial neural networks and support vector machines with genetic algorithms. Mechanical Systems and Signal Processing, Vol. 18, Issue 3, 2004, p. 625-644.
-
Rafiee J., Rafiee M. A., Tse P. W. Application of mother wavelet functions for automatic gear and bearing fault diagnosis. Expert Systems with Applications, Vol. 37, Issue 6, 2010, p. 4568-4579.
-
Mohanty A. R., Kar C. Fault detection in a multistage gearbox by demodulation of motor current waveform. Industrial Electronics, Vol. 53, Issue 4, 2006, p. 1285-1297.
-
Combet F., Gelman L. Novel adaptation of the demodulation technology for gear damage detection to variable amplitudes of mesh harmonics. Mechanical Systems and Signal Processing, Vol. 25, Issue 3, 2011, p. 839-845.
-
Meltzer G., Dien N. P. Fault diagnosis in gears operating under non-stationary rotational speed using polar wavelet amplitude maps. Mechanical Systems and Signal Processing, Vol. 18, Issue 5, 2004, p. 985-992.
-
Yu D., Yang Y., Cheng J. Application of time-frequency entropy method based on Hilbert-Huang transform to gear fault diagnosis. Measurement, Vol. 40, Issue 9, 2007, p. 823-830.
-
Rafiee J., Tse P. W., Harifi A., Sadeghi M. H. A novel technique for selecting mother wavelet function using an intelligent fault diagnosis system. Expert Systems with Applications, Vol. 36, Issue 3, 2009, p. 4862-4875.
-
Parey A., El Badaoui M., Guillet F., Tandon N. Dynamic modelling of spur gear pair and application of empirical mode decomposition-based statistical analysis for early detection of localized tooth defect. Journal of Sound and Vibration, Vol. 294, Issue 3, 2006, p. 547-561.
-
Ricci R., Pennacchi P. Diagnostics of gear faults based on EMD and automatic selection of intrinsic mode functions. Mechanical Systems and Signal Processing, Vol. 25, Issue 3, 2011, p. 821-838.
-
Smith J. S. The local mean decomposition and its application to EEG perception data. Journal of the Royal Society Interface, Vol. 2, Issue 5, 2005, p. 443-454.
-
Cheng J., Yang Y., Yang Y. A rotating machinery fault diagnosis method based on local mean decomposition. Digital Signal Processing, Vol. 22, Issue 2, 2012, p. 356-366.
-
Park C., Looney D., Hulle M. M. V., Mandic D. P. The complex local mean decomposition. Neurocomputing, Vol. 74, Issue 6, 2011, p. 867-875.
-
Liu H., Han M. A fault diagnosis method based on local mean decomposition and multi-scale entropy for roller bearings. Mechanism and Machine Theory, Vol. 75, 2014, p. 67-78.
-
Cheng J., Yu D., Tang J., Yang Y. Application of frequency family separation method based upon EMD and local Hilbert energy spectrum method to gear fault diagnosis. Mechanism and Machine Theory, Vol. 43, 2008, p. 712-723.
-
The engineering school of ULB, 2001, http://web1.ulb.ac.be//polytech/laborulb.
-
Ding K., Li W., Zhu X. Practical Technology of Fault Diagnosis of Gears and Gear Boxes. Machine Press, Beijing, China, 2006, (in Chinese).
-
Lokajíček T., Klíma K. A first arrival identification system of acoustic emission (AE) signals by means of a high-order statistics approach. Measurement Science and Technology, Vol. 17, 2006, p. 2461-2466.
About this article
This work was finically supported by the National Science Foundation of China (Grant No. 51105018) and Beijing Higher Education Young Elite Teacher Project (Grant No. YETP1116).
