Abstract
HHT (Hilbert-Huang Transform) which consist of EMD (Empirical Mode Decomposition) and HT (Hilbert Transform) now is the most widely used time-frequency analysis technique for rolling element bearing fault diagnosis, however, its fault characteristic information extraction accuracy is usually limited due to the problem of mode mixing in EMD. ESMD (Extreme-point symmetric mode decomposition) is a novel development of HHT which is promising to alleviate this limitation and it has been applied to some fields successfully, but its application for rolling bearing fault diagnosis has rarely been seen in the literature. In this paper, ESMD is applied to extract the bearing fault characteristics for rolling bearing fault detection, and the results proved that ESMD can have a better fault diagnose effect than EMD and HT. What’s more, for further improving bearing fault characteristic extraction accuracy of rolling bearing vibration signals, the sifting scheme is proposed for selecting the sensitive fault-related IMFs (intrinsic mode functions) generated by ESMD, in which a weighted kurtosis index is introduced for automatic selection and reconstruction of the fault-related IMFs, and then the original and reconstructed bearing fault vibration signal after performing Hilbert transform as the results to diagnose the incipient rolling bearing fault. ESMD combined with the proposed sifting scheme are applied to diagnose the simulated and experimental signals, and the results confirmed that the sifting scheme based ESMD is superior to the other conventional method in rolling bearings fault diagnosis.
1. Introduction
Rolling element bearing is one of the most fundamental and vital rotating components in mechanical industry, and their failure is one of the main reasons of machinery malfunction [1, 2]. Vibration signals are the carriers of bearing health states and bearing fault characteristics can be extracted from the experimental vibration signals by using the state-of-the-art signal processing methods [3, 4]. However, traditional signal processing technique is difficult to extract bearing fault characteristic accurately because bearing fault vibration signals are non-linear and non-stationary in nature and moreover they are usually corrupted by the heavy noise.
For adaptive nonlinear and non-stationary signal analysis methods, Hilbert-Huang transform (HHT) [5] is one of the most widely used time-frequency analysis technique in rotating machine fault diagnosis field [6, 7]. However, there are still some limitations for EMD, e.g., lack of a rigorous mathematical theory [6, 8], undershoot or overshoot envelope caused by cubic spline [9] and inaccurate fault characteristic reveals caused by mode mixing [10]. In order to improve these problems, many researchers have been proposed some related methods. Zheng et al. [10, 19] indicated that define a reasonable baseline is crucial to obtain a better signal decomposition performance. They defined different baselines for subtracting from bearing fault vibration signal separately, and then based on the defined baselines proposed GEMD (generalized empirical mode decomposition). Besides, Wu and Huang [11] proposed EEMD (ensemble empirical mode decomposition) for improving the problem of mode mixing. However, Wang and their co-workers [12-14] indicated that the noise-assisted processing method (EEMD) may destroy the vibration signal, which means losing some intrinsic physical meaning of the raw bearing vibration signals, and finally lead to an inaccurate result. Recently, they proposed ESMD (Extreme-point symmetric mode decomposition), which is a novel improvement method of HHT for the nonlinear and non-stationary signal processing [12, 13].
ESMD is mainly comprised of the signal decomposition based on extreme-point symmetric scheme and the DI (direct interpolating) which is for calculation of IF (instantaneous frequency) and IA (instantaneous amplitude). Moreover, Due to the advantages in abnormity diagnosis, de-trending and time-frequency analysis, ESMD has been effectively applied in many various fields, e.g., air-sea flux investigation [14], control chart pattern recognition [15], small-scale temperature variation of air-water interface [16], frequency specificity for medical temporal lobe epilepsy [17] and ECG (Electrocardiograph) signal denoising [18]. EMD adopts envelop-symmetry to decompose the vibration signal of rolling bearing, while ESMD employs extreme-point symmetry instead. In addition, ESMD decomposes the vibration signal into a series of IMFs (intrinsic mode functions) together with a final residue-AGM (optimal adaptive global mean) curve. AGM as a decomposition baseline has two advantages could get the better decomposition performance: (1) AGM can reflect the evolutionary trend of the whole vibration signal; (2) the optimal number of decompositions can optimize by AGM [12]. In short, ESMD has such a suitable adaptive decomposition baseline and the components decomposed by the baseline of ESMD can preserve its intrinsic physical meaning of the raw vibration signal to a certain extent [12, 13]. For this reason, fault characteristic components and other disturbance components of rolling bearing vibration signals can be separately decomposed. The presence of interference components is due to unstable working status, i.e., uneven lubrication, machine resonance and varying load. Thus, if disturbance components can be accurately identified, fault characteristic extraction accuracy of bearing vibration signal can be improved correspondingly. Based on above advantages of ESMD in rotating mechanical fault diagnosis field, Zhu et al. [20] proposed an adaptive extraction method by utilizing the AGM of ESMD to get the trend term of machinery fault vibration signal and drew a conclusion that the extraction results are better than the corresponding trend terms of EMD. In addition, comparing with HHT, ESMD not only has the remedied decomposition algorithm, but also the direct interpolating (DI) method can gain more precise both instantaneous frequency and instantaneous amplitude than Hilbert Transform (HT) [12-14]. As far as we concerned, ESMD seem to be a good signal processing method for improving rolling bearing fault characteristic extraction accuracy.
Based on above analysis, ESMD may have better performance than EMD and EEMD in fault characteristic extraction of machinery vibration signal. Moreover, ESMD have rarely been found to be applied in bearing fault diagnosis field to our knowledge, so in this paper ESMD is firstly applied to diagnose incipient rolling bearing fault. In the end, the sifting scheme which employs the weighted kurtosis as an index based on distinguishing fault-related IMFs is also proposed for further improving fault characteristic extraction accuracy by removing irrelevant IMFs that exhibited in the decomposition results of ESMD.
The remainder of the paper is organized as follows. Basic theories of ESMD and the sifting scheme are respectively detailed in Section 2. In Section 3, the comparative study of ESMD, EMD and EEMD are carried out using the simulation signature and the sifting scheme are also used to evaluate their decomposition performances. Then, ESMD combining with the proposed sifting scheme are applied to perform the simulated and experimental fault vibration signal of rolling bearing in Section 3 and Section 4. Finally, the conclusions are given in Section 5.
2. Algorithm of ESMD and shifting scheme-based ESMD
The decomposition algorithm of ESMD is introduced first, and then the sifting scheme is presented for selecting the sensitive fault-related IMFs generated by ESMD.
2.1. Decomposition algorithm of ESMD
Based on the physical meaning of rolling bearing vibration signal, ESMD decompose a vibration signal into a series of IMFs together with an AGM curve. Utilizing the advantages of AGM by optimizing the residual mode and determining the optimal number of decomposition can get a better decomposition result.
Raw vibration signal of rolling bearing y can be composed using ESMD [12, 13] as:
where is the number of IMFs, is the residue curve with several extreme points.
Considering that raw bearing vibration signal and its final residue signal are discrete-time signals, where is the number of time points. The variances of the two signals are correspondingly given as follows:
Thus, decomposition algorithm of ESMD for rolling bearing fault diagnosis is descried in detailed in Table 1 [12, 13].
Table 1The decomposition algorithm of ESMD
1) Find all the local extreme points of , connect all the adjacent with line segments, and then mark their midpoints by , add the left and right boundary midpoints and |
2) Construct the point p interpolating curves with all these midpoints and calculate their mean value as |
3) Repeat the above two steps on until the sifting times attain a preset maximum number or . Then the first mode IMF1 is obtained |
4) Repeat the above three steps on the residual. Change the maximum number on a finite integer interval and then all the other IMFs are obtained until the final residual with no more than the predefined number of extreme points |
5) Change the maximum number K on a finite integer interval [, ] and repeat the above four steps. Then calculate and plot the ratio of variance and |
6) Find the number of the optimal sifting times which accords with the minimum value of on [, ]. Then use this to repeat the previous five steps and output the IMFs and the final residual r. Here, the final residual can be seen as an optimal AGM curve (decomposition baseline) |
2.2. Shifting scheme-based ESMD for rolling bearing fault diagnosis
Some IMFs generated by ESMD, EMD and EEMD are closely related to bearing fault characteristic information, while the other IMFs may only contain some useless or irrelevant information. Moreover, there is a significant different accuracy of fault characteristic extraction can be obtained due to the different selected fault-related IMFs. Thus, it is necessary to propose a screening criterion for selecting the sensitive fault-related IMFs and then the sifting scheme is presented as follow.
Vibration signals collected by normal and fault rolling bearings are denoted as and , respectively. And after performing ESMD on a series of IMFs can be obtained. Thus, the sifting scheme can be described below.
(1) Calculate and determine the kurtosis of each (1, 2, …, ) of generated by ESMD.
(2) Calculate the correlation coefficients between each and .
(3) Calculate the correlation coefficients between each and .
(4) Calculate and determine the fault-related coefficient by computing the absolute value of the above two kinds of correlation coefficients and : .
(5) Calculate and determine the weighted kurtosis according to the calculation formula .
(6) In terms of their from large to small, rank all the IMFs of to get the sequences of IMFs: {} ( 1, 2, …, ) and . Thus, select and determine sensitive IMFs according to the ranked weighted kurtosis index .
The impact signal waveform is generated due to bearing surfaces contact with another surface and the severity of the impact waveform represents degradation of surface quality. Initially, determine the fault-related degree of each IMF using kurtosis which is a preferable index to characterize severity of impact waveform in step (1). Calculating the correlation coefficients between each IMF of fault bearing vibration signal and original vibration signal (involved fault bearing vibration signal and normal vibration signal) are necessary to determinate whether the frequency components of each IMF are meaningful for bearing fault detection. So, the calculated correlation coefficient between each IMF of fault vibration signal and its fault vibration signal will be large when the IMFs have fault-related information, and vice versa; the large correlation coefficient between each IMF of fault vibration signal and normal vibration signal represent that the IMFs have little fault-related information, and vice versa. Furthermore, the same fault-unrelated IMFs of fault vibration signal and normal vibration signal can be obtained according to coefficient calculation and above comparison work by step (2), step (3) and step (4). Thus, fault-related IMFs can be obtained by removing irrelevant IMFs. Based on the above analysis, the proposed weighted kurtosis index includes two aspects (fault-related and fault-unrelated) information for selecting the sensitive fault-related IMFs.
Hilbert transform based on ESMD and the sifting scheme for sensitive IMF selection includes the following steps. Bearing fault vibration signal is acquired in the first step, and it is decomposed into a set of IMFs using ESMD. In the second step, the ranked weighted kurtosis based on the principle above is obtained. In the third step, the sensitive fault-related IMFs are selected according to the ranked weighted kurtosis index, and the signal is reconstructed based on the selected sensitive fault-related IMFs. In the end, Hilbert transform of the constructed fault bearing vibration signal is performed, and the incipient bearing faults can be diagnosed based on the result of Hilbert transform.
3. Simulated verification
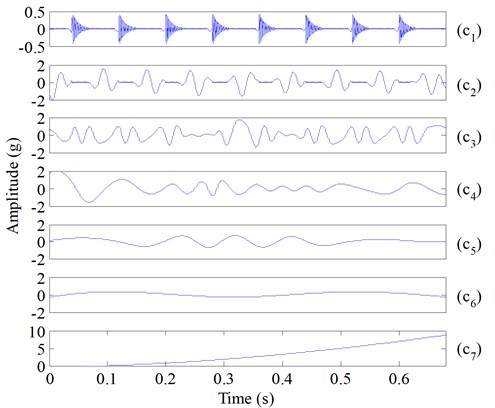
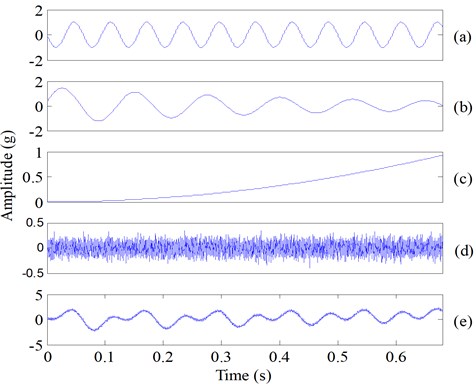
A decomposition experiment was carried out at first to evaluate the performance of ESMD and EMD with a simulated rolling bearing fault vibration signal in this section. The simulated signal is comprised of four components, an impact component, a sinusoidal wave (which indicates a certain rotation frequency component of rotating machinery), a weighted-periodic function component (the function with a fixed frequency and varying amplitude) [13, 14] and a trend item (Fig. 1(a)-(d)), also their simulated composite signal is shown in Fig. 1(e). Then, the simulation signal (Fig. 1(e)) is decomposed by ESMD, and the decomposition result is given in Fig. 2. It can be seen from Fig. 2 that the components , , and correspond to the impact component, the certain rotation frequency component, the weighted-periodic function component and the trend item, respectively. The decomposed components (Fig. 2) and the real simulated components (Fig. 1) indicated that the four components can be extracted accurately by ESMD, yet fault-irrelevant component still exist (Fig. 2). EMD was also applied to decompose the simulation signal (Fig. 1), and the decomposition result is given in Fig. 3. It is obvious that mode mixing exhibit between different IMFs and there are serious distortions for each IMF, which indicated that EMD fails to provide reasonable decomposition for the simulated fault signal. However, ESMD can produce more accurate decomposition result due to the baseline of AGM.
Fig. 1The simulated bearing fault vibration signal: a) the impact component, b) the certain rotation frequency component, c) the weighted-periodic function component, d) the trend item, e) the simulation signal
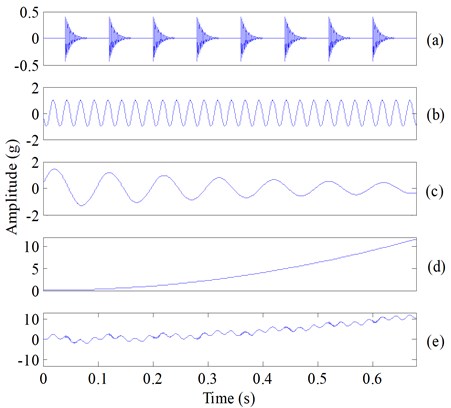
Fig. 2The decomposed five components of the simulated composite signal (Fig. 1(e)) using ESMD
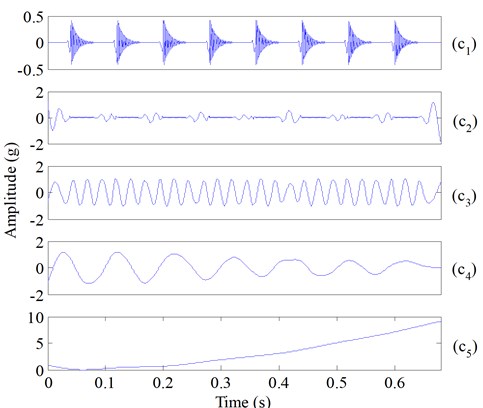
Fig. 3The decomposed seven components of the simulated composite signal (Fig. 1(e)) using EMD
To evaluate the performance of the direct interpolating (DI) method, considering the simulation signal [19] as follow:
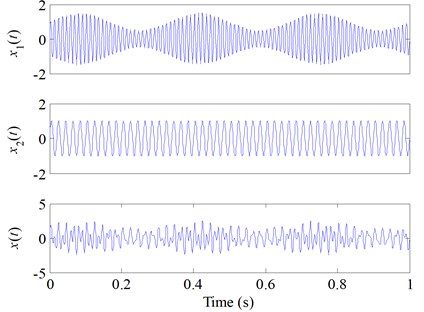
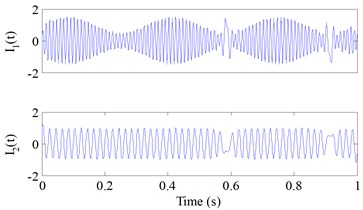
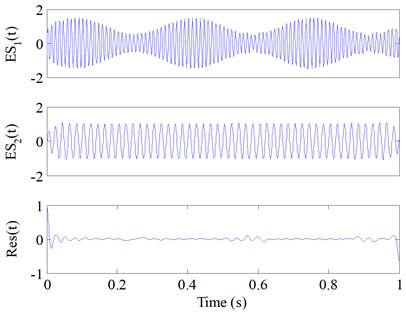
The simulation signal and its two components , are given by Eq. (5) and shown in Fig. 4. Then, the simulation signal (Fig. 4) is decomposed by using ESMD and EMD respectively, and Fig. 5(a) and Fig. 5(b) are the decomposition results. The total sifting times of the two methods were set to the same. From Fig. 5(a) and Fig. 5(b), the components of EMD (Fig. 5(a)) exhibit mixed modes slightly and locally, while the components decomposed by ESMD (Fig. 5(b)) coincide well with the true simulated components.
Fig. 4The simulation signal xt and its two components x1t, x2t of Eq. (5)
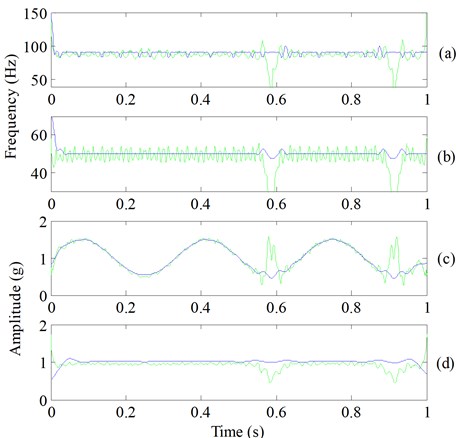
The th components of EMD and ESMD (Fig. 5(a) and Fig. 5(b)) were noted as and , respectively. HT was used to compute the IFs and IAs of , and for comparison purpose, DI was used to compute the IFs and IAs of . The computed results are displayed in Fig. 6 and the absolute errors are correspondingly displayed in Fig. 7. The IFs and IAs of computed by HT (Fig. 6) were greatly influenced by mode mixing and boundary effect, they all fluctuated heavily, and their absolute errors were very large. While the IFs and IAs of computed by DI had higher accuracy comparing with the IFs and IAs of calculated by HT. Additionally, after observing the errors of and Ii(t) (Fig. 7) which were all obtained by computing the absolute differences between the calculated values and the corresponding real values (Fig. 4), it is obvious that the absolute errors of are far smaller than those of . Considering the same given simulated signal, DI is superior to HT in obtaining the accurate IFs and IAs.
Fig. 5Decomposition results generated by EMD and ESMD of the simulated signal xt of Eq. (5): a) the decomposition results of EMD, b) the decomposition results of ESMD
a)
b)
Fig. 6The IFs and IAs of Iit and ESit: a) the IFs of I1t and ES1t, b) the IFs of I2t and ES2t, c) the IAs of I1t and ES1t, d) the IAs of I2t and ES2t. The green line represents the results of Iit by HT, the blue line represents the results of ESit by DI
Although the decomposition results generated by ESMD are accurate (Fig. 2 and Fig. 5(b)), fault-irrelevant IMFs also could be produced. And to alleviate this issue, the sifting scheme was adopted to select sensitive fault-related IMFs. Thus, another simulation of ESMD with the sifting scheme was carried out. A normal bearing vibration signal is simulated first (Fig. 8(e)), the simulation signal consists of a sinusoidal component, a weighted-periodic function component, a trend item and noise component, the four components are shown in Fig. 8(a)-(d), respectively. Then the simulated impact component of an outer-ring fault (Fig. 9(a)) is incorporated into the simulated normal bearing vibration signal [21] to simulate an outer-ring fault bearing vibration signal, where the fault characteristic frequency is 53 Hz and the sampling frequency is 12.8 kHz. Finally, the simulated bearing vibration signal with an outer-ring fault is shown in Fig. 9(e).
Fig. 7Absolute errors of Fig. 7: a) the IF errors of I1t and ES1t, b) the IF errors of I2t and ES2t, c) the IA errors of I1t and ES1t, d) the IA errors of I2t and ES2t. (The green line represents the results of Iit by HT, the blue line represents the results of ESit by DI)
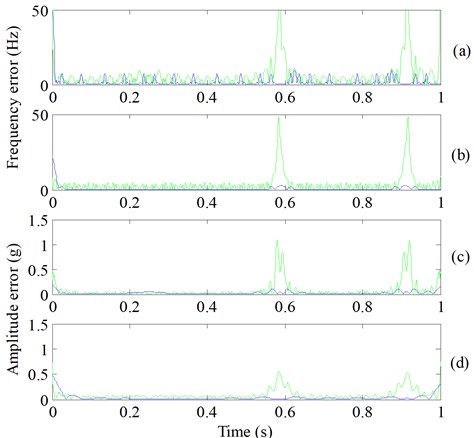
Fig. 8Simulated normal vibration signal of rolling bearing: a) the sinusoidal component, b) the weighted-periodic function component, c) the trend item, d) the noise component, e) the simulated normal bearing vibration signal
ESMD was adopted to decompose the simulated normal and fault vibration signals of rolling bearing first, the obtained IMFs and residues are presented in Fig. 10 and Fig. 11, respectively. Using the proposed sifting scheme-based method, the fault-related weighted kurtosis indexes of each IMF of bearing vibration signal are calculated, and the weighted kurtosis indexes are ranked from large to small in Table 2. It can be seen in Table 1 that IMF1 has the largest weighted kurtosis index, and the weighted kurtosis indexes are ranked as IMF1, IMF2, IMF7, IMF8, IMF3, IMF4, IMF5, IMF6. The two IMFs with largest indexes, i.e. IMF1 and IMF2 are the sensitive IMFs and are selected to reconstruct the fault signal, and the Hilbert transform envelope based on the raw simulated bearing fault signal and the reconstructed bearing fault signal are shown in Fig. 12 and Fig. 13, respectively. In addition, the fault characteristic of rolling bearing vibration signal is masked by the heavy noise and consequently not evident enough (Fig. 12), while it is obvious that fault characteristic frequency 53 Hz and its harmonics of rolling bearing are very evident (Fig. 13), so incipient bearing fault can be easily detected.
Fig. 9Simulated out-ring fault vibration signal of rolling bearing: a) the impact component, b) the sinusoidal component, c) the weighted-periodic function component, d) the trend item, e) the noise component, f) the simulated bearing fault vibration signal
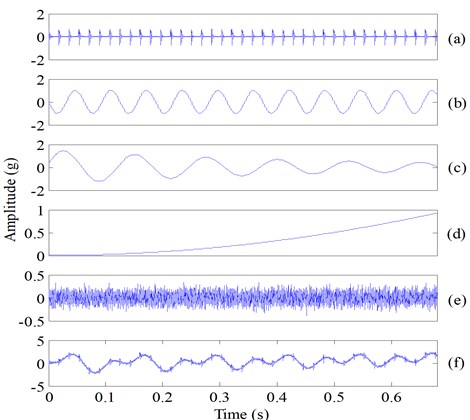
Fig. 10IMFs of the simulated normal bearing vibration signal (Fig. 8(e)) using ESMD
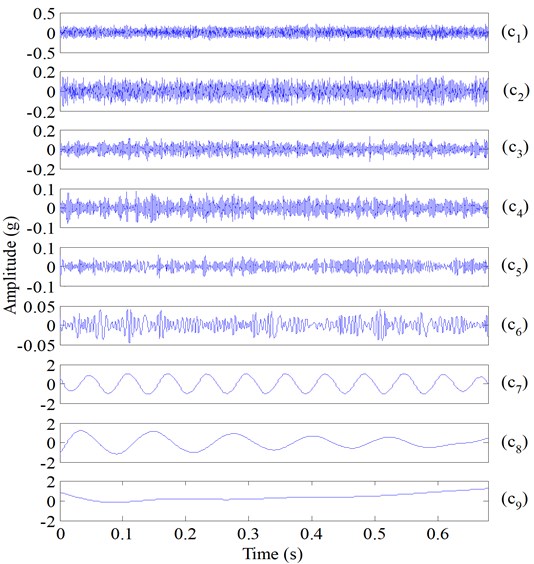
Fig. 11IMFs of the simulated bearing fault vibration signal (Fig. 9(f)) using ESMD
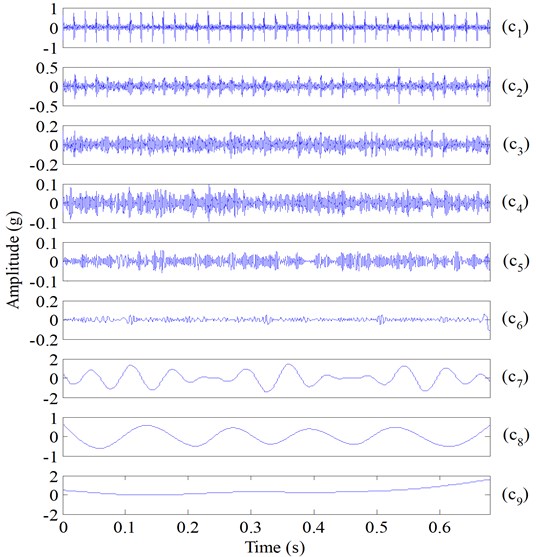
Fig. 12Hilbert envelope spectrum of the raw simulated bearing fault vibration signal
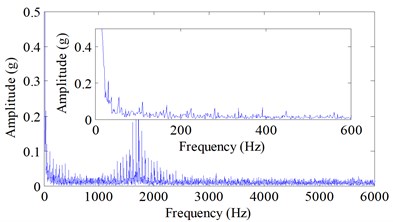
Fig. 13Hilbert envelope spectrum of the reconstructed simulated bearing fault vibration signal after performing shifting scheme-based ESMD
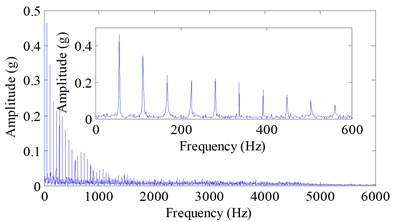
Table 2The ranked IMFs of ESMD and their corresponding weighted kurtosis
Ranked IMFi | IMF1 | IMF2 | IMF7 | IMF8 | IMF3 | IMF4 | IMF5 | IMF6 |
0.8238 | 0.1666 | 0.0098 | 0.0039 | 0.0010 | 0.0004 | 0.0003 | 0.0002 |
4. Experimental demonstration
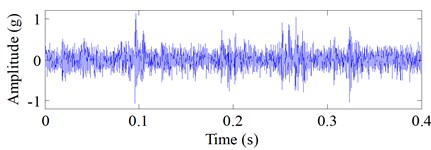
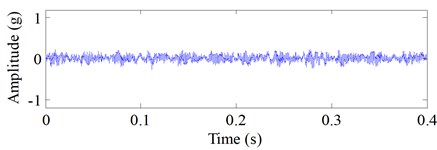
Vibration signal of drive end rolling bearing with the local rolling element fault and normal bearing vibration signal are used for further evaluation of the proposed method. Time domain waveform of the experimental fault and normal vibration signals are shown in Fig. 14(a) and Fig. 14(b), respectively. Experimental signals of the tested rolling bearing are obtained from the Case Western University Bearing Data Center Website [22] and the geometry information of the tested rolling bearing are shown in Table 3. The selected fault vibration signal and its defect size, rotating speed and calculated fault characteristic frequency [23, 24] are presented in Table 4. The sampling frequency is 12 kHz and the sampling time is 0.4 s. The raw vibration signal with rolling element fault and its Hilbert envelope spectrum are shown in Fig. 15.
ESMD combined with the sifting scheme was used to process the vibration signal with slight rolling element fault (Fig. 14(a)) and normal vibration signal of rolling bearing (Fig. 14(b)), respectively. Although the impact fault waveform exists in the time-domain waveform, the fault characteristic frequency can still hardly be found from the Hilbert envelope spectrum (Fig. 15(b)) due to the background noise. Hence the proposed sifting scheme is also adopted to select the most sensitive IMFs for improving fault diagnosis effect.
Fig. 14The raw vibration signals of rolling bearing: a) the vibration signal with the rolling element defects, b) the normal vibration signal of rolling bearing
a)
b)
Fig. 15The raw vibration signal with the rolling element fault and its Hilbert envelope spectrum: a) the raw noise-corrupted fault signal, b) Hilbert envelope spectrum of the raw bearing fault signal
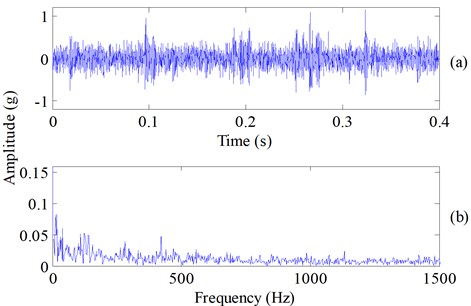
Table 3The detailed geometry information of the tested rolling bearing
Outer diameter (in.) | Inner diameter (in.) | Thickness (in.) | Roller diameter (in.) | Pitch diameter (in.) | Number of rollers |
2.0472 | 0.9843 | 0.5906 | 0.3126 | 1.537 | 9 |
Table 4The detailed fault signal information of the tested rolling bearing
Defect location | (×) (in.) | (RPM) | (Hz) | (Hz) | (Hz) | (Hz) |
Roller | 0.011×0.014 | 1797 | 11.4 | 141 | 107 | 162 |
Note: , , and are the defect size, the defect depth, the defect diameter and the shaft speed, respectively. is the fundamental cage frequency, , and are the characteristic frequency of the rolling element fault, the inner-ring fault and the outer-ring fault, respectively. | ||||||
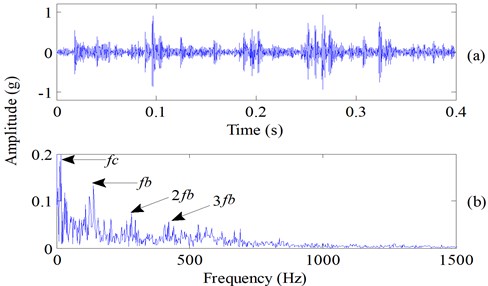
The proposed method was applied to analyze the signals (Fig. 14). Each signal was decomposed by applying ESMD, and then the decomposed IMFs and the residues of the defective and healthy bearing signal were obtained in Fig. 16 and Fig. 17, respectively. It can be seen from Fig. 16 that the repetitive impulses exhibited in the first four IMFs of the defective bearing signal. According to the proposed sifting scheme-based ESMD method, the fault-related weighted kurtosis indexes of each IMF of the fault signal were calculated and the weighted kurtosis indexes were ranked from large to small in Table 5. It can be seen in Table 5 that IMF1 has the largest weighted kurtosis index, and the weighted kurtosis indexes were ranked as IMF1, IMF3, IMF4, IMF2. This calculation result was consistent with the appearance of repetitive impulses exhibited in the first four IMFs of the defective bearing signal (Fig. 16). Hence, IMF1, IMF3, IMF4 and IMF2 were selected to reconstruct the fault bearing signal (Fig. 18(a)), and the other seven common IMFs contained in the healthy bearing signal and the fault bearing signal were removed. In the improved ESMD method, the new indicator considers not only the similarity between each IMF and original bearing signal but also the kurtosis of each IMF reflecting the fault-related information imbedded in each IMF. Therefore, the designed indicator can effectively select the useful IMFs to reconstruct the original signal for extracting fault characteristics. From the reconstructed signal (Fig. 18(a)), it is can be seen that the weak fault impulses were displayed clearly. In the end, time-domain waveform and Hilbert envelope spectrum of the reconstructed fault signal based on sifting scheme-based ESMD is presented in Fig. 18, in which the fundamental cage frequency , the rolling elements fault frequency and its harmonics is presented clearly. Besides, there is an amplitude growth of the fault character frequency and its harmonics (Fig. 18) comparing to the amplitude growth of the fault character frequency and its harmonics (Fig. 15) of the raw fault vibration signal with rolling element fault using Hilbert transform. Thus, the proposed improved ESMD method for rolling bearing fault diagnosis can be verified to be effective.
Table 5The ranked IMFs of ESMD and their corresponding weighted kurtosis
Ranked IMFi | IMF1 | IMF4 | IMF3 | IMF2 | IMF5 | IMF6 | IMF7 | IMF9 | IMF8 | IMF10 |
0.792 | 0.0766 | 0.0554 | 0.0388 | 0.0194 | 0.0083 | 0.0046 | 0.0037 | 0.0028 | 0.0002 |
Fig. 16Decomposing results of Fig. 14(a) using ESMD
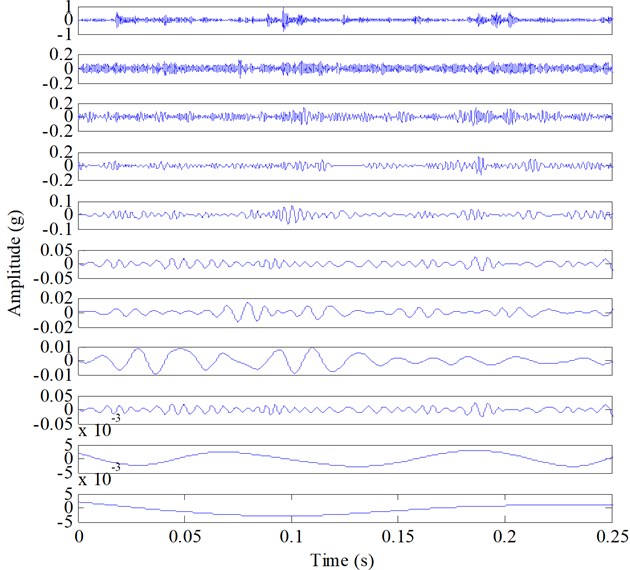
Fig. 17Decomposing results of Fig. 14(b) using ESMD
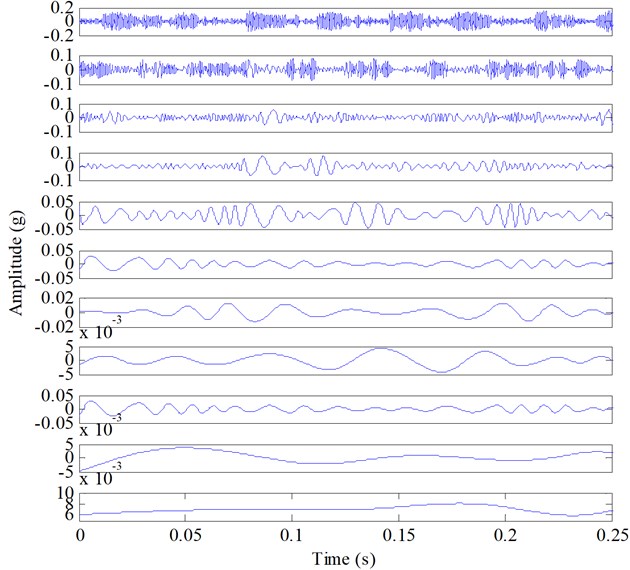
Fig. 18Result obtained by sifting scheme-based ESMD: a) the extracted transient impulses, b) Hilbert envelope spectrum of the extracted signal
5. Conclusions
Mode mixing is an important reason why the conventional HHT cannot have very good performance in rolling bearing fault diagnosis. Comparisons between the novel development method of HHT-ESMD and the conventional HHT are conducted with the simulated fault vibration signals of rolling bearing, and the results indicated that ESMD can help achieving better performance than the conventional HHT for rolling bearing fault diagnosis. Another major issue in bearing fault diagnosis is that the significant influences of unrelated IMFs. Shifting scheme-based method can choose the sensitive fault-related IMFs based on the ranked weighted kurtosis indexes, and thereby alleviated the interference of the background noise so better fault diagnosis effect can be achieved. Finally, the simulated and experimental validations proved that the proposed shifting scheme-based ESMD method is very promising to improve fault characteristic attraction accuracy of rolling bearing. In the future studies of rolling bearing fault diagnosis, we will use acoustic emission signal of bearing fault to test these methods and improve their robustness.
References
-
Li Y., Billington S., Kurfess C., Danyluk T., Liang S. Adaptive prognostics for rolling element bearing condition. Mechanical Systems and Signal Processing, Vol. 13, 1999, p. 103-113.
-
Lei Y. G., Qiao Z. J., Xu X. F., Niu S. T. An underdamped stochastic resonance method with stable-state matching for incipient fault diagnosis of rolling element bearings. Mechanical Systems and Signal Processing, Vol. 94, 2017, p. 148-164.
-
Qiao Z. J., Lei Y. G., Lin J., Niu S. T. Stochastic resonance subject to multiplicative and additive noise: The influence of potential asymmetries. Physical Review E, Vol. 94, 2016, p. 052214.
-
Qiao Z. J., Lei Y. G., Lin J., Jia F. An adaptive unsaturated bistable stochastic resonance method and its application in mechanical fault diagnosis. Mechanical Systems and Signal Processing, Vol. 84, 2017, p. 731-746.
-
Lei Y. G., Lin J., He Z. J., Zuo M. J. A review on empirical mode decomposition in fault diagnosis of rotating machinery. Mechanical Systems and Signal Processing, Vol. 35, 2013, p. 108-126.
-
Tsakalozos N., Drakakis K., Rickard S. A formal study of the nonlinearity and consistency of the empirical mode decomposition. Signal Processing, Vol. 92, 2012, p. 1961-1969.
-
Ma Z., Wen G., Jiang C. EEMD independent extraction for mixing features of rotating machinery reconstructed in phase space. Sensors, Vol. 15, 2015, p. 8550-8569.
-
Huang N. E., Shen Z., Long S. R. The empirical mode decomposition and the Hilbert spectrum for nonlinear and non-stationary time series analysis. Proceeding of the Royal Society of London A: Mathematical, Physical and Engineering Sciences, Vol. 454, 1998, p. 903-995.
-
Hu X., Peng S., Wang W. H. EMD revisited: a new understanding of the envelope and resolving the mode-mixing problem in AM-FM signals. IEEE Transactions on Signal Processing, Vol. 60, 2012, p. 1075-1086.
-
Zheng J. D., Cheng J. S., Yang Y. Partly ensemble empirical mode decomposition: An improved noise-assisted method for eliminating mode mixing. Signal Processing, Vol. 96, 2014, p. 362-374.
-
Wu Z. H., Huang N. E. Ensemble empirical mode decomposition: a noise assisted data analysis method. Advances in Adaptive Data Analysis, Vol. 1, 2009, p. 1-41.
-
Wang J. L., Li Z. J. What about the asymptotic behavior of the intrinsic mode functions as the sifting times tend to infinity. Advances in Adaptive Data Analysis, Vol. 4, 2012, p. 1250008.
-
Wang J. L., Li Z. J. Extreme-point symmetric mode decomposition method for data analysis. Advances in Adaptive Data Analysis, Vol. 5, 2013, p. 135-170.
-
Li H. F., Wang J. L., Li Z. J. Application of ESMD method to Air-Sea flux investigation. International Journal of Geosciences, Vol. 4, 2013, p. 8-11.
-
Yang W. A., Zhou W., Liao W. H., Guo Y. Identification and quantification of concurrent control chart patterns using extreme-point symmetric mode decomposition and extreme learning machines. Neurocomputing, Vol. 147, 2015, p. 260-270.
-
Wang J. L., Fang X. S. ESMD method for frequency distribution of tank surface temperature under wind effect. International Journal of Geosciences, Vol. 6, Issue 5, 2015, p. 481-486.
-
Song S. Y., Ding M. Y., Li H., Song X. P., Fan W. L., Zhang X. M., Xu H. B. Frequency specificity of fMRI in mesial temporal lobe epilepsy. PLOS ONE, Vol. 11, 2016, p. 0157342.
-
Tian X., Li Y., Zhou H., Zhang X. M. Electrocardiogram Signal denoising using extreme-point symmetric mode decomposition and nonlocal means. Sensors, Vol. 16, Issue 10, 2016, p. 1584.
-
Zheng J. D., Cheng J. S., Yang Y. Generalized empirical mode decomposition and its applications to rolling element bearing fault diagnosis. Mechanical Systems and Signal Processing, Vol. 40, 2013, p. 136-153.
-
Zhu Y., Jiang W., Kong X. Adaptive extraction method for trend term of machinery signal based on extreme-point symmetric mode decomposition. Journal of Mechanical Science and Technology, Vol. 31, Issue 2, 2017, p. 493-500.
-
Wang Y. F., Kootsookos P. J. Modeling of low shaft speed bearing faults for condition monitoring. Mechanical Systems and Signal Processing, Vol. 12, 1998, p. 415-426.
-
Bearing Data Center. Case Western Reserve University, https://csegroups.case.edu/bearingdatacenter /pages/download-data-file.
-
Qiao Z. J., Pan Z. R. SVD principle analysis and fault diagnosis for bearings based on the correlation coefficient. Measurement Science and Technology, Vol. 26, Issue 8, 2015, p. 85014.
-
Randall R. B., Antoni J. Rolling element bearing diagnostics-a tutorial. Mechanical Systems and Signal Processing, Vol. 25, 2011, p. 485-520.
