Abstract
This work focus on an unsupervised, data driven statistical approach to detect and monitor fatigue crack growth in lug joint samples using surface mounted piezoelectric sensors. Early and faithful detection of fatigue cracks in a lug joint can guide in taking preventive measures, thus avoiding any possible fatal structural failure. The lug joint samples used in this paper are prepared from an aluminum alloy plate with 6 mm thickness and are instrumented with a surface mounted piezoelectric sensor network. Experiments are conducted on three lug joints under constant fatigue loading. The fatigue loading was stopped every 1000 cycles after any small crack was spotted, and the piezoelectric signals corresponding to narrow-band actuations were acquired at every fatigue-loading-stopped cycle. The on-line damage state at any given fatigue cycle is estimated using a damage index approach as the dynamical properties of a structure change with the initiation of a new crack or the growth of an existing crack. Using the measurements performed on an intact lug joint as baseline, damage indices are evaluated from the frequency response of the lug joint with an unknown damage state. As the damage indices are evaluated, a Bayesian analysis is committed and a statistical metric is evaluated to identify damage state (say crack length).
1. Introduction
A significant quantity of military and civil aircraft currently in service have exceeded their original design life of about 20 years through life extensions. The current average age of more than 1.500 Boeing 727 and 800 DC-9 aircraft in service are now over 30 years and 25 years respectively and a significant quantity of military airplanes are approaching or have exceeded the original certified design life of the structures [1]. Due to economic conditions, operators are trying to increase the service life of the aircraft fleet. Aircraft maintenance is a system of work which must take all kinds of costs such as labor, logistic, equipment etc. which constraints with the competing requirements of fleet readiness, reliability and safety into consideration [2, 3]. Structural health monitoring (SHM) approaches, where the monitoring system is integrated within the structures which are being inspected, can be applied to commit frequent examination of critical components without disassembling, resulting in a reduction potential in maintenance costs. The developed integrated SHM requirements have been placed on new aircrafts which can also be extended to the health management of existing aircraft and other aerospace, mechanical or civil structure systems [4, 5]. Lug joints are connector elements used as structural supports for pin connections. These joints are used in varieties of aerospace applications and are susceptible to the failure under fatigue loads throughout the operational life of the aircraft. Early and faithful detection of fatigue cracks in a lug joint can guide in taking preventive measures, thus avoiding any possible fatal structural failure. Committing a health monitoring process to this kind of components, therefore, becomes essential [6]. Recently, surface mounted piezoelectric sensors are used for on board structure health monitoring. In plate-like structures with a complex geometry, the separation of symmetric and antisymmetric modes of Lamb waves becomes difficult. This increases the complexity in studying the influence of damage on the overlapping modes. Statistical methods are proposed to analyze measured sensor signals and extract useful information to characterize damage. The measured signals are analyzed using a damage index approach to determine the degree of damage of the structures [7]. The proposed approach is designed to overcome the complexity and variability of the signals in the presence of damage or the complexity of the structure. It is assumed that the fact that the dynamical properties of a structure change with the emergence of a new crack or the growth of an existing crack. Using measurements performed on an undamaged structure as a baseline, the damage index is evaluated by comparing the changes in the frequency spectrum of the monitored structure as a new crack emerges or an existing crack grows. Thus unless the environment undergoes significant changes between mentioned two sets of measurements occurred within a very short time frame, noise, in general, will have no effect on the results. The damage index vanishes if there is no change in the structure and its value increases with the severity and proximity of damage to the sensor locations. Thus any detectable crack within the sensor array is determined by the proposed method. To imitate the real life scenario, the sensor signals used for fatigue crack detection and monitoring are not filtered for known and unknown frequencies which can occur due to different environmental and operational conditions.
In this paper, first compare statistical damage index value related metric to get the damage detecting zone, then use principal component analysis to reduce the dimension of collected data, then commit a wavelet analysis and take the time-energy array as the further damage index array, at last a Bayesian classifier is used to give the detected damage state (given as crack length).
2. Principle component analysis
Principle component analysis (PCA) is a mainstay of modern data analysis, it is an orthogonal basis transformation that can be used for sensor signal denoising and data dimension reduction [8]. PCA is a process that identifies the direction of the principle components as the variance of change in dynamics is maximum. Given that M different observations is obtained from each sensor at a fatigue-loading-stopped cycle (say at the kth cycle) and each observation contains N samples, the input signal space corresponding to each sensor at the very fatigue cycle, is a M×N matrix. Assume that each sensor observation is an 1×N vector named xi, the centered M×M covariance matrix of the data set {xi,xj∈RM|i,j=1,2,...,M} can be found as:
where μi, μj are the means of vector xi, xj respectively. The covariance matrix is diagonalized to obtain the principle components which can be performed by solving the following eigenvalue problem:
The size of eigenvalue λ corresponding to eigenvector v of covariance matrix CM equals the amount of variance in the direction of v. It is assumed that all the M sensor observations got at a typical fatigue instance can be interpreted into m equivalent observations, which contain the necessary dynamics of signals at that fatigue cycle:
thus the original observation space YM×N is reduced to an equivalent observation space Ym×N which consists of m, 1×N sensor signals, ΦM×N is the eigenvectors found from eigenvalue analysis described in Eq. (2).
3. Damage index
Damage index should be easy to compute and change to the variance of the severity of damage [9]. Using measurements on an undamaged structure as a baseline, a useful damage index is evaluated by comparing changes in frequency domain:
where fs is the sample rate, VU is referenced wave propagation signal measured in undamaged state, and VD is the wave propagation signal measured at any interested fatigue loading cycle. FFT is the frequency spectra of the measured signals after Fourier transform performed on measured signals. Generally, the damage index defined in Eq. (4) returns non-zero values only if any damage changes certain properties of the propagated waves, and it returns zeros if no new damages occurred.
Thus, the reliability of damage detection is highly dependent on the reliability of the measured signals in both undamaged and damaged states. However, the measurements can be easily affected by environmental noise which leads to false or inaccurate values of damage index. Under this situation, although the damage index value is not zero, it is still difficult to distinguish whether the change of propagated wave signals is introduced by damage or environment. To overcome this drawback, the measurements are repeated several times under the same conditions. Assume that the measurements are repeated (M-1) times in the undamaged state and (N-1) times under any typical fatigue cycle. As M measurements are measured in the undamaged state and N measures are measured at a typical fatigue cycle. The damage index is modified as well.
Damage index defined for undamaged state:
Damage index defined for any measured state:
A statistical damage index is defined:
where:
In Eq. (8) σ1 and σ2 are the standard deviations relating to the undamaged and damaged situations, respectively.
4. Naive Bayesian classification
A naive Bayes classifier is a simple probabilistic classifier based on applying Bayes’ theorem with naive independence assumptions. Its competitive performance in classification is surprising, because the conditional independence assumption on which it is based, is rarely true in real world applications [10]. An advantage of the naive Bayes classifier is that it only requires a small amount of training data to estimate the parameters necessary for classification. Because independent variables are assumed, only the variances of the variables for each class need to be determined but not the entire covariance matrix [11].
Abstractly, the probability model for a classifier is a conditional model:
over a dependent class variable C with a small number of classes, conditional on several feature variables F1 through Fn. In the practice we are only interested in the numerator of Eq. (9), since the denominator does not depend on C and the values of the features Fi are given, so that the denominator is effectively constant. So the numerator is equivalent to the probability model:
This means that under the independence assumptions, the conditional distribution over the class variable C can be expressed like this:
where Z is a scaling factor dependent only on F1,…, Fn, a constant if the values of the feature variables are known.
The naive Bayes classifier combines the probability model with a decision rule. One common rule is to pick the hypothesis that is most probable; this is known as the maximum posteriori decision rule. The corresponding classifier is the function cla defined as follows:
The Naive Bayes classifier classifies data in two steps:
Training step: Using the training samples, the method estimates the parameters of a probability distribution, assuming features are conditionally independent given the class.
Prediction step: For any unseen test sample, the method computes the posterior probability of that sample belonging to each class. The method then classifies the test sample according the largest posterior probability.
5. Experiment procedures
5.1. Sample preparation
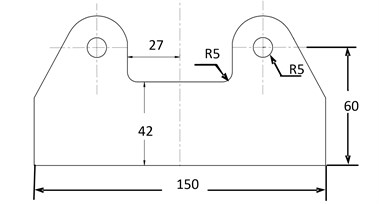
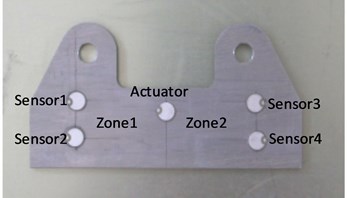
Lug joint samples were prepared form 6 mm thick aluminum alloy plate whose dimensions are shown in Fig. 1(a). Picth-catch sensor networks are intrumented on the surface of the samples as shown in Fig. 1(b). The sensor network is divided into 2 zones, each zone consists one actuator and two sensors which make a pitch-catch subnetwork, also shown in Fig. 1(b).
Fig. 1a) Geometrical dimension of the lug joint sample in millimeters b) PZT sensor configuration on the lug joint sample
a)
b)
5.2. Fatigue test
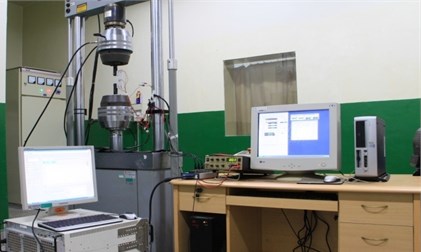
The lug joint samples with surface mounted PZT sensors were performed a fatigue test in a MTS machine. The samples were held to the test frame by a pair of clevises and tested under a constant amplitude fatigue load of –0.46 kN to 4.58 kN. The top clevis was fixed to the test frame while the bottom clevis was connected to the hydraulic actuator which introduced a 5 Hz sinusoidal load of the mentioned range which had the load ratio 1.1. Fig. 2 shows the experiment configuration.
Fig. 2Experiment configuration for lug joint fatigue test
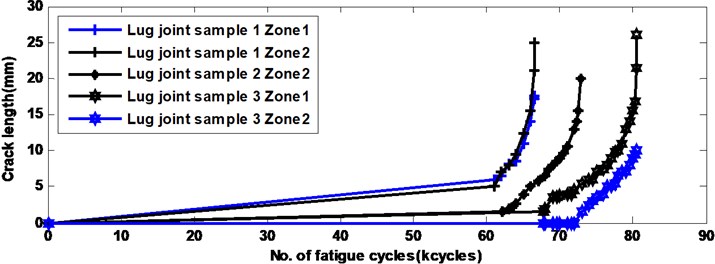
The propagated wave signals are measured when the fatigue load was stopped, having the lug joint sample fixed on the sample, and applying fixed amount of static load. Meanwhile crack length was kept track of for reference (shown in Fig. 3).
Fig. 3Measured crack lengths for lug joint samples
5.3. Wave propagation test
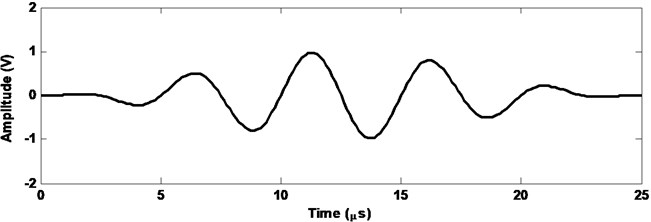
After the fatigue load was stopped at a typical fatigue cycle, a modulated sinusoidal signal of 5 cycles and with 200 kHz center frequency as shown in Fig. 4 is used as the excitation signal which was sampled at 8 MHz. And the wave propagation test was repeated for 9 times.
Fig. 4One of the excitation signals of 5 cycles and of 200 kHz central frequency
6. Results and discussion
6.1. Crack zone selection
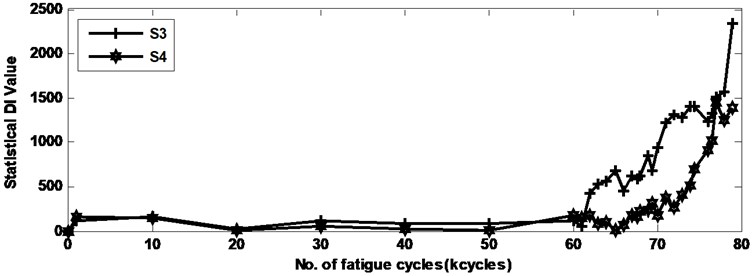
Using the measured signals, the damage pertaining features are extracted using Eq. (6) and the features with respect to the undamaged state are extracted using Eq. (5). And the trend of final statistical damage features which are extracted using Eq. (7) is shown in Fig. 5.
Fig. 5Statistical damage index of log joint sample 3 for sensor 3 and sensor 4
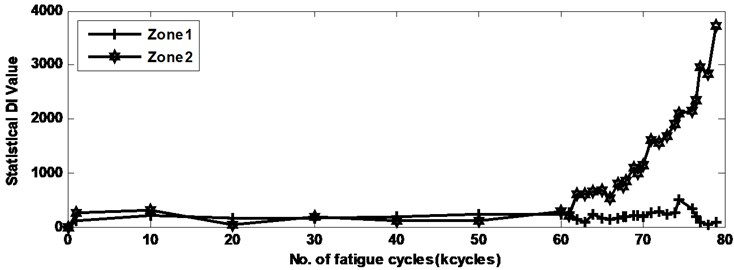
There might be more than one crack in the real life structure, but not every crack could lead to a final failure. As in the case of the symmetric lug joint samples, there are two cracks: the top shoulder crack and the bottom shoulder crack, while only the top shoulder crack led to the final failure. As in the case of sample 3, the top shoulder crack lies in Zone2 which comprises sensor 3 and sensor 4, and the bottom shoulder crack lies in zone 1 which comprises sensor 1 and sensor 2. To identify the critical crack zone, a metric which is the mean value of the statistical damage index in each zone is evaluated at every interested fatigue cycle shown in Fig. 6.
From the comparison of the metric between Zone1 and Zone2 for lug joint sample 3, it is clear that the damage zone selecting metric has lower value for Zone1 compared with Zone2 which is in accordance with the measured crack growth track as shown in Fig. 3. The consistently higher metric value of Zone2 implies that the crack in Zone2 grew and most likely led to the final failure which is also evident in Fig. 3. Thus by comparing the metric of different zones, the zone with a much higher metric value is paid more attention to. So for lug joint sample 3, Zone2 signals are calculated further.
Fig. 6Comparison of the zone selecting metric for lug joint sample 3
6.2. Fatigue crack detection
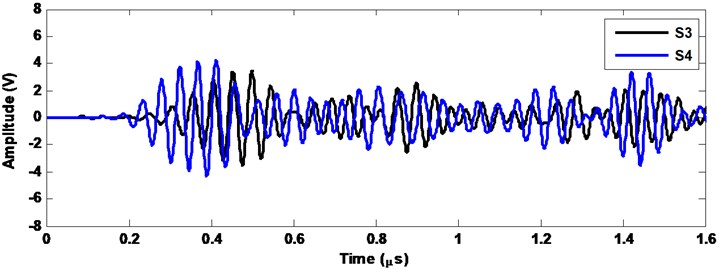
As there is environmental noise present in the sensed signals, PCA is used to remove the noise and meanwhile reduce data dimension. At a typical fatigue cycle, the measured 10 observations can be transformed to an equivalent observation as shown in Fig. 7.
Fig. 7The equivalent signals of sensor 3 and sensor 4 after PCA committed of central frequency 200 kHz
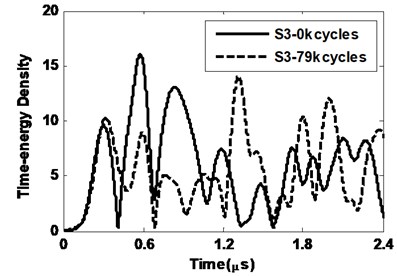
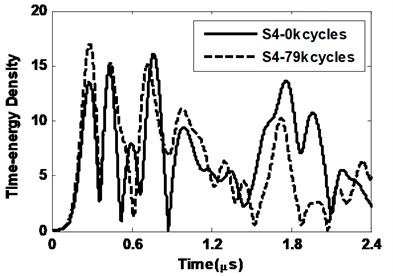
The equivalent signals then were processed through continuous wavelet transformwith the scale fixed to the central frequency of the excitation signal. The vector known as time-energy density is extracted and used as the training or predicting input of the naive Bayesian classifier as shown in Fig. 8.As the lug joint test 2 was found not responding to the excitation signal due to the disconnection of sensor 4, the NB classifier was trained with data corresponding to test 3, and was applied to the data corresponding to test 1 to give the crack detection result.
Fig. 8Time-energy density for sensor 3 and sensor 4 and 0 kcycles and 79 kcycles
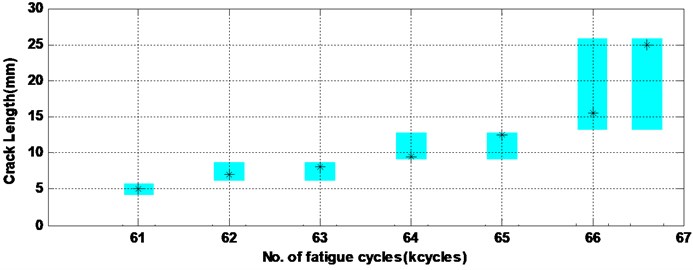
As shown in Fig. 9, the (*) markers represent the measured crack length and the bars represent the result of the naive Bayesian classifier of test 1. The top edges and bottom edges of the light blue squares represent the upper limits and lower limits of the classes for the classification. From the figure, it is clear that the markers all lie in the light blue bars which means a good classification.
Fig. 9Damage detect result for test 1
6.3. Discussion and conclusions
In this paper a technique that is a combination of known concepts of continuous wavelet transform and Bayesian statistical analysis for fatigue crack detection of structural hotspot is described. And a statistical metric is evaluated to overcome the complexity of data organizing and decide the more dangerous zone of the structure. Principle component analysis is also used to reduce the dimension of the measured data and the time, complexity of the data processing.
References
-
National Materials Advisory Board. Aging of U.S. Air Force Aircraft, Final Report, 1997.
-
Hess A., Calvello G., Frith P., Engel S., Hoitsma D. Challenges, issues, and lessons learned chasing the “Big P”. Real Predictive Prognostics Part 2, 2006, p. 1-19.
-
Chang P. C., Flatau A., Liu S. C. Review paper: health monitoring of civil infrastructure. Structural Health Monitoring, Vol. 2, 2003, p. 257-267.
-
Su Z., Ye L., Lu Y. Guided Lamb waves for identification of damage in composite structures: a review. Journal of Sound and Vibration Digest, Vol. 295, 2006, p. 753-780.
-
Giurgiutiu V., Zagrai A. N. Characterization of piezoelectric wafer active sensors. J. Intell. Mater. Syst. Struct., Vol. 11, Issue 9, 2000, p. 59-76.
-
Beard S. J., Qing P. X., Chang F. K. Hot spot monitoring for aircraft structures. Proceeding of International Workshop on Smart Materials and Structures Technology, 2004.
-
Przemyslaw Kolakowski Two approaches to structural damage identification: model updating versus soft computing. Journal of Intelligent Material Systems and Structures, Vol. 17, Issue 1, 2006, p. 63-79.
-
Smith L. A tutorial on principal component analysis. http://www.itu.dk/courses/SIGB/F2011/ untitled%20folder/Reading/pca-smithTutorial.pdf.
-
Banerjee S., Ricci F., et al. A wave propagation and vibration-based approach for damage identification in structural components. Journal of Sound and Vibration, Vol. 322, Issue 1-2, 2009, p. 167-183.
-
Jayaata K. G., Mohan D., Tapas S. An introduction to bayesian analysis. Springer Science, Business Media, New York, 2006, p. 29-63.
-
Peter C. Bayesian models for categorical data. Wiley Series in Probility and Statistics, John Wiley & Sons, 2005, p. 1-23.
