Abstract
Previous studies have not comprehensively revealed the wind effects on the double-layer cylindrical latticed shell (DCLS). In the paper, the code considering cross spectra of wind and cross terms of modes is programmed and verified. All the nodes and elements are selected to study the characteristics of wind pressure and response spectra. Studies show that wind pressure energy at the top of the shell is higher than that at the windward or leeward side. The most unfavorable wind direction and the dangerous area is 90° and the middle top, not 120° and the end area as stated in the previous documents. Different orders of mode are excited in various responses, and the resonant component should not be ignored. Higher turbulence at the flow separation area leads to stronger structural amplification on wind effects and different ESWL distributions for various targets. The type of target of should be properly chosen according to the concerned structural performance. Under high wind velocity, structural material and geometric nonlinearities make the dynamic equilibrium positions of the shell jump with time.
1. Introduction
The double-layer cylindrical latticed shell (DCLS) is an important kind of roof structures, widely used as the dry coal shed in power plants or other large-span warehouses. Such low-rise buildings are located in the bottom part of the atmospheric boundary layer with strong turbulence, so their wind effects are very complicated [1-3]. With the increasing span, wind load is often one of the dominating loads in their design [4, 5].
Most studies on the wind effect of latticed shells have concentrated on spherical shells or single-layer shells, while the DCLS is less involved [6, 7]. Mi et al [8] calculated the wind-induced vibration of a DCLS by time domain analysis. He discussed gust response factors, response spectrum characteristics and the most unfavorable load case by choosing partial nodes and elements in the shell. The selected nodes and elements, however, may not be able to cover the maximum response of the shell. In addition, only the area near the windward edge is analyzed in the paper. Therefore, inaccurate conclusions on the wind-induced response characteristics of DCLS may be drawn. Zhou et al [9, 10] calculated the wind-induced responses of DCLS by means of frequency domain method, in which the interference from neighboring shells and coal piles under the shell roof were discussed. However, his research was also limited to the windward area on the shell. Huang et al [11] studied the distribution of mean and fluctuating wind pressure coefficients on the DCLS. But it’s regrettable that the wind pressure power spectra and pressure correlations, which are of vital importance for wind-induced vibration analysis, were not discussed.
Due to the complexity of wind-induced random responses, the equivalent static wind load (ESWL) was proposed for structural design. When the ESWL is imposed on the structure, the generated target response is identical to the peak response obtained by the random vibration analysis. Davenport [12] firstly presented the gust loading factor (GLF) to denote the structural amplification on wind load, but the GLF method can’t provide meaningful value in cases with zero mean load or response. Afterwards, Kasperski and Niemann [13, 14] suggested the load-response-correlation (LRC) method to compute the ESWL on low-rise buildings based on the quasi-static assumption. However, only the background ESWL can be determined by the LRC method. A linear combination of the background and resonant components is then put forwarded to express the ESWL by Zhou and Holmes [15, 16]. A more effective way for accurately estimating the ESWL on large-span roofs, considering the contributions of higher modes and modal response correlation to structural responses, is further presented by the author’s group [17]. Yet, the distribution of ESWL on the DCLS has seldom been studied.
In this research, the code for computing wind-induced responses and ESWL on the DCLS are firstly programmed and verified based on the wind pressure data measured simultaneously in the wind tunnel with the rigid model. All of the nodes and elements of the shell are then selected to study the characteristics of wind pressures and wind-induced responses. The distributions of ESWL for various targets are finally compared, and the nonlinear characteristics of the shell under high wind velocity are also discussed.
2. Wind tunnel tests of the DCLS
A ground-bearing DCLS, adopted as the dry coal shed in a power plant, is studied in this paper. The shell is composed of crossing bars arranged as quadrangular pyramid, with the longitudinal length 140 m, the span 103 m, and the rise span ratio 0.39 (Fig. 1). There exist 10080 rods which can be seen as two-force elements, and 2592 joints in the shell. The density of rods is 7850 kg/m3. In addition, roofing plates are arranged over the whole roof, and their weight is 52 kg/m2 when they are less than 8.7 m away from the top of the shell, and 38 kg/m2 otherwise.
Fig. 1The double-layer cylindrical latticed shell
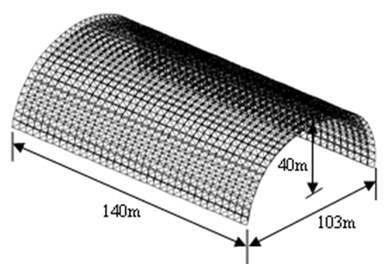
Fig. 2Rigid model of the shell in wind tunnel
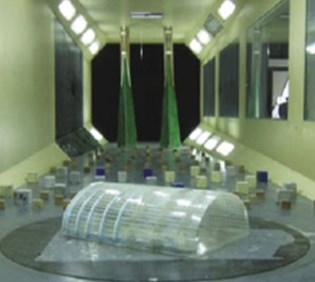
Fig. 3Wind direction and pressure tap arrangement
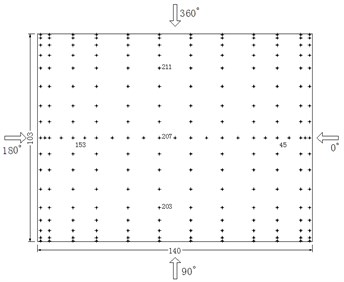
In order to acquire the unsteady wind pressures used for computing wind-induced responses, the rigid model wind tunnel tests of the shell were conducted in a TJ-2 atmospheric boundary wind tunnel of the National Key Laboratory for Civil Engineering Disaster Prevention in Tongji University, China (Fig. 2). The wind field where the shell is located is type B, and the basic wind pressure of 50-year recurrence is 0.8 kPa, according to Chinese load code [18]. The wind direction definition and wind pressure tap arrangement are shown in Fig. 3. The typical taps at the top, windward and leeward side of the roof are numbered in Fig. 3 for the convenience in later analysis. Owing to structural symmetry, simultaneous pressure measuring tests of 7 wind directions, ranging from 90° to 180° with the interval of 15°, were carried out.
The dry coal shed roof is generally pressed by wind on both the outer and inner surfaces at the same time, so the pressure of measurement tap is the difference of pressures on the outer and inner surfaces [19]. The sampling frequency of pressure signal is 312.5 Hz, and the sample length of each measurement tap is 6000 data. Finally, the wind pressures obtained in the tests are converted to full scale according to the geometry scale ratio of 1:150.
3. Computational theories and methods
3.1. Wind-induced random vibration
As the stochastic wind load on the shell can be described as the ergodic stationary process, the wind-induced buffeting responses can be computed through the random vibration theory.
The equation of motion for the system with n degree of freedoms (DOF) is [20]:
where M, C and K are the mass, damping and stiffness matrixes of the structure, respectively, v, ˙v and ¨v are the vectors of random displacement, velocity and acceleration, respectively, f(t) is the vector of random wind force.
The DCLS is a semi-rigid roof and commonly seen as mechanically linear or weakly nonlinear. Therefore, its buffeting responses can be computed by the mode superposition method. The random displacement in the jth order modal coordinate can be obtained by:
where uj is the jth order modal coordinate, ξj is the jth order modal damping ratio, desirable for 0.01, ωj is the jth order circular frequency of the shell, qj is the jth order modal force, qj=ϕTjf, in which ϕTj is transposition of the jth order modal vector.
Then, the response autocorrelation function is further obtained through the Duhamel integral:
where hj(τ1) and hk(τ2) is the unit pulse response in the jth and kth order modal coordinate, respectively, ˉmj and ˉmk is the jth and kth order modal mass, respectively, Rqjqk(t+τ1-τ2) is the cross covariance of modal forces qj and qk, m is the truncated order of modal shapes, and m can be taken as 100 according to the response spectrum analysis in the later section.
Conducting Fourier transform on the response autocorrelation function and expressing the modal force spectrum by wind force spectrum through the matrix of modal shape generates the complete quadratic combination (CQC) formula for computing the power spectral density matrix of any response r:
where A is the matrix composed of the response vector of r corresponding to uj=1, ˉω is the independent variable of the power spectrum function, H(iˉω) is the conjugate matrix of the frequency response function matrix H(iˉω), ΦT is transposition of the modal matrix Φ, R is the indicating matrix for calculating the nodal wind force spectra from wind pressure spectra of measurement taps in the wind tunnel lab [21] (because the total number of measurement taps is generally far less than the number of DOFs, such treatment will obviously reduce the time-consuming in calculating excitation spectra), SP(ˉω) is the wind pressure spectrum matrix of measurement taps.
As shown in Eq. (4), the cross spectra of wind load in all DOFs and the cross terms of structural modes are taken into the consideration in the CQC method. Therefore, the formula shown in Eq. (4) is an accurate formula for computing wind-induced responses in frequency domain.
The wind pressure data are segmented and window handled to guarantee the high fidelity of wind pressure signal [21]. 6000 data are divided into 10 segments, and each segment contains 1024 data. The overlapping rate among segments is 50 %. The signal leakage error induced by Fourier transforms is reduced by the Hanning window function.
When the excitation spectrum is a two-sided spectrum, the root mean square (RMS) and peak value of the response are calculated by:
where ˆr is the vector of average response; g is the peak factor (g=2.5).
3.2. ESWL considering higher modes and modal response correlation
A new method has been proposed by the author’s group to calculate the ESWL based on the CQC method, without distinguishing the background response from the resonant response [17]. The ESWL targeting any response can be expressed as:
where Fe is the matrix of ESWL, and each column represents the ESWL on all DOFs corresponding to a specific target, ˉF is the matrix of average wind load.
The element at the ith row and the jth column in the matrix ρrFσF is ρriFjσFjsign(ˉri), where ρriFj denotes the correlative coefficient between the targeted response ri and the load Fj. Fj is defined by F=Kv, where v is the displacement vector, σFj is the RMS of Fj, and sign(ˉri) means that the sign (positive or negative) of the element in the matrix is the same as that of ˉri.
Based on the definition of the correlative coefficient, ρriFj=CriFj/σriσFj, Eq. (7) can be further written as:
where the element in CrF/σr is CriFj/σri, CriFj is the covariance between the response ri and the load Fj, σri is the RMS of ri.
The load-response covariance can be calculated by:
where Ir is the matrix of influence coefficients, the element at the ith row and the jth column means the response on the ith DOF when the jth DOF is loaded by the unit force, Cuu is the matrix of modal response covariance, which can be calculated by:
According to the definition of the modal response covariance, we have:
where Cuiuj is the element at the ith row and the jth column in Cuu, σui and σuj are the RMS of the ith and jth order modal responses, respectively, ρuiuj is the correlative coefficient between the ith and jth order modal responses.
Thus, the RMS of the ith order modal response can be gained by:
where Cuiui is the auto-covariance of the ith order modal response.
Based on the numerical platform of MATLAB, the code for calculating the wind-induced vibration and ESWL are programmed. The random response and distribution of ESWL under any target of the shell are gotten according to structural parameters and wind load information.
4. Code verification
In order to verify the code, responses of a three-storey frame structure under the random load as shown in Fig. 4 are calculated and then compared with the analytical result. It’s assumed that mass of the column be ignored and the floor stiffness be infinite. The concentrated masses on the floors are 1.0, 1.5 and 2.0, respectively. The interlayer stiffness is 600 N/m, 1200 N/m and 1800 N/m, respectively.
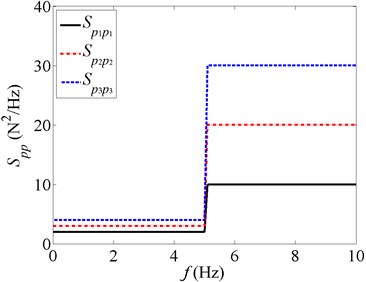
The auto-power spectral densities of random forces p1, p2, p3 acting at the floors are shown in Fig. 5. Their cross power spectral densities are:
Fig. 4The three-storey frame structure
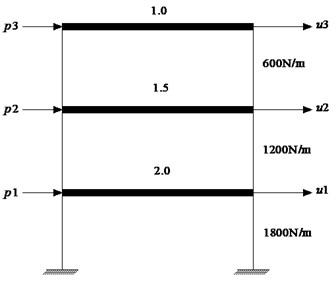
Fig. 5Spectra of three stochastic forces
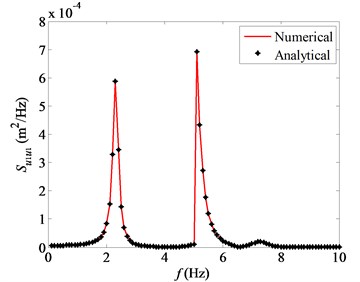
The random response spectra Su(ˉω) of the horizontal displacement u1, u2, u3 at each floor are calculated by the code, where ˉω∈(0,10), Δω=0.1. Fig. 6 compares the numerically obtained auto-power spectra of u1 with the result of analytical derivation according to the theories of structural dynamics [22]. It’s shown that the numerical result agrees well with the analytical correspondent. Comparisons of u2 and u3 achieve similar conclusions. Therefore, the validity of the code has been initially proved.
Fig. 6Comparison of numerical and analytical response spectra
5. Results and discussion
5.1. Characteristics of wind pressures
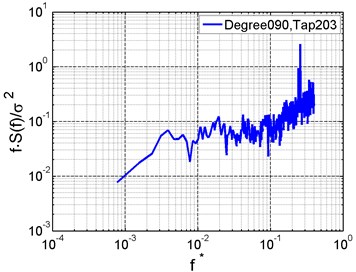
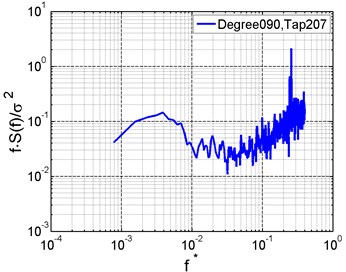
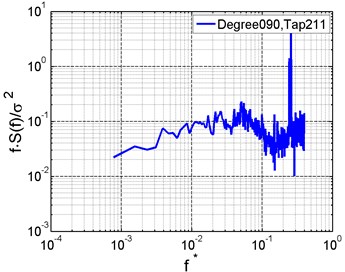
Fig. 7Wind pressure spectra of typical taps
a)
b)
c)
The characteristics of wind pressure spectra can be basically grasped by observing the spectra on the top, windward and leeward area of the shell under the wind direction of 90°. Fig. 7 gives the wind pressure auto-power spectra at typical measurement taps (as shown in Fig. 3). The abscissa represents the reduced frequency f*=(ˉωHr)/Ur, where Hr and Ur are the reference height and wind speed in full scale. It’s indicated that pressure energy mainly concentrates within the scope of f*<0.1, and the pressure energy at the top is greater than that at the leeward or windward side [23]. Vortex shedding is generated by flow separation on the cylindrical surface, resulting in larger spectral value near f*=0.25 Hz.
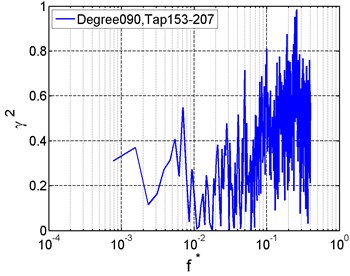
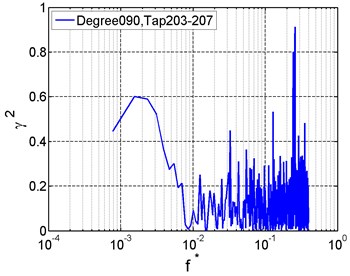
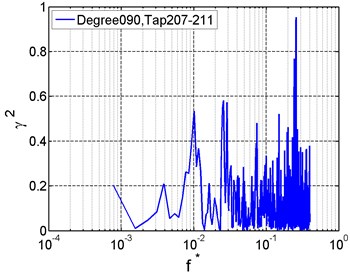
According to the coherence functions of wind pressure at typical taps (Fig. 8), wind pressure at the top has strong correlation with that at the windward side but weak correlation with that at the leeward side within the low frequency scope. At high frequencies, the correlation between wind pressures at the middle area and on the end is strong.
Fig. 8Correlation of wind pressures between typical taps
a)
b)
c)
5.2. Feature responses
The peak response of each node or element can be obtained by Eq. (6), and the maximum peak of the entire shell is called the feature response, so there will be one feature displacement or feature stress in a wind direction. The node or element producing the feature response is called the feature position [24].
Table 1 and Fig. 9 present the feature responses and positions in various wind directions. In the table, the number in the parenthesis denotes the feature position. In the figure, the triangle and square denote the feature positions of transverse and vertical displacements, respectively; the stick denotes the feature position of stress.
The longitudinal stiffness of the shell is relatively higher, so the longitudinal displacements in all wind directions are the smallest. Most feature positions of the transverse displacement are located at the windward end, while the majority of feature positions of the vertical displacement are located at the top. Meanwhile, the feature positions of stress are located at the windward areas. The vertical displacement is larger than the transverse displacement, especially in 90° and 105°, located at the top of the roof.
Table 1Feature responses and positions in various wind directions
Wind direction (°) | 90 | 105 | 120 | 135 | 150 | 165 | 180 |
Longitudinal displacement (m) | –0.011 (995) | 0.013 (1065) | –0.012 (1634) | –0.013 (1705) | –0.012 (1776) | –0.012 (1909) | –0.009 (1846) |
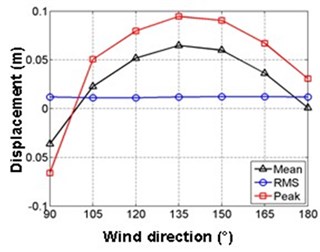
Transverse displacement (m) | –0.066 (1740) | 0.051 (852) | 0.080 (1840) | 0.095 (1834) | 0.091 (1842) | 0.067 (1846) | 0.031 (1846) |
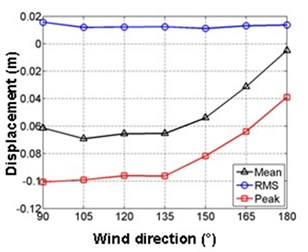
Vertical displacement (m) | –0.101 (1101) | –0.099 (1243) | –0.096 (1381) | –0.096 (1614) | –0.082 (1699) | –0.064 (1704) | –0.039 (1065) |
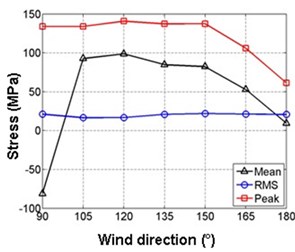
Stress (MPa) | 133.8 (6387) | 133.5 (8018) | 139.8 (8040) | 137.4 (8219) | 137.1 (82919) | 106.4 (1704) | 61.2 (8316) |
Fig. 9Distribution of feature positions on the shell
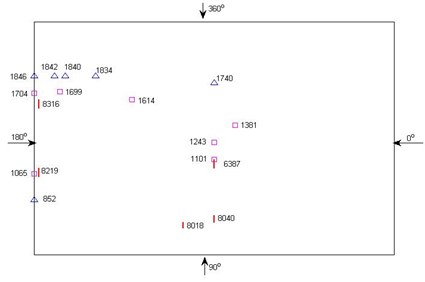
Fig. 10Correlation of wind pressures between typical taps
a) Transverse displacement
b) Vertical displacement
c) Stress
Fig. 10 shows the variation in average, RMS and peak responses at the feature positions with wind directions. It’s apparently that the peak response at the feature position is right the feature response. As can be seen, the average and peak responses are sensitive to wind directions while the RMS response is not. The average response contributes significantly to the peak response except 180°, in which the mean pressure is small since the flow is parallel to the shell surface.
Therefore, the most unfavorable wind direction of displacement is 90° and the dangerous area is the middle top, not documented 120° and the end area [8-10]. In 90°, the flow separates near the top, and higher negative pressures lead to violent vibration.
5.3. Response spectra
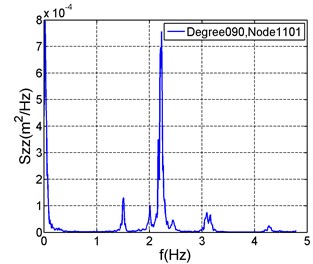
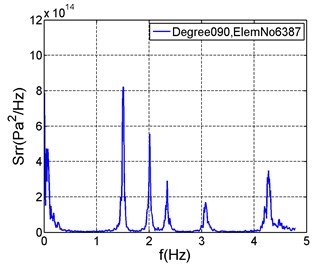
When the feature displacement is located at the top, its vibration is obviously vertical and contributed by the low order mode of vertical motion. For example of 90°, the spectral peak corresponding to the 5th order natural frequency (Fig. 11) is obviously higher than other spectral peaks (Fig. 12(a)), and the 5th order modal shape is symmetric vertical motion.
Fig. 11First 6 order natural frequencies and modal shapes of the shell
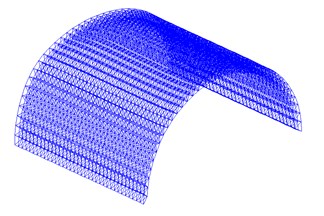
a)f1=1.38 Hz (longitudinal motion)
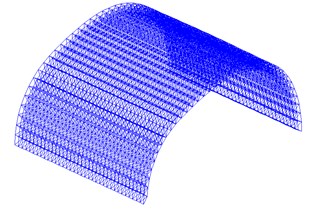
b)f2=1.51 Hz (transverse motion)
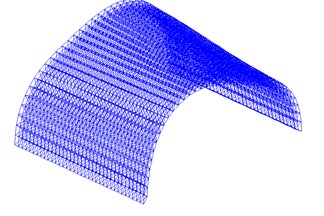
c)f3=1.63 Hz
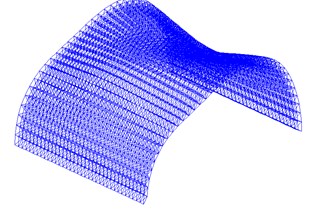
d)f4=2.01 Hz
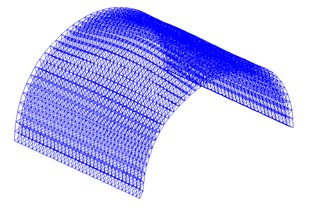
e)f5=2.23 Hz (symmetric vertical motion)
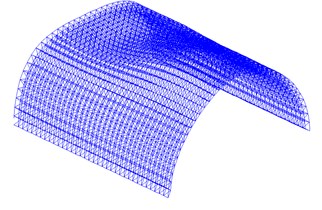
f)f6=2.34 Hz (antisymmetric vertical motion)
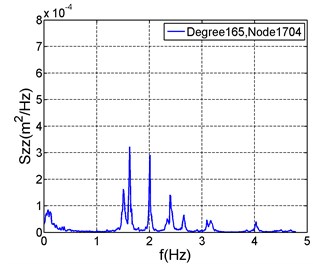
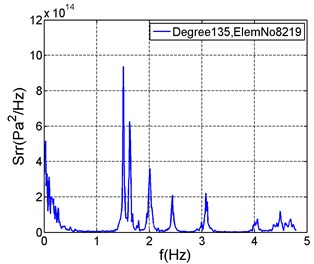
While the feature displacement is located at the windward end, the vertical and transverse displacements are close at this area, so many modes of transverse and vertical motion are excited, such as in 165° (Fig. 12(b)). In addition, some higher order modes, such as the 11th order mode, are excited in the stress spectra (Fig. 13).
Fig. 12Vertical displacement spectra at feature positions
a)
b)
Fig. 13Stress spectra at feature positions
a)
b)
Fig. 14Proportion of the background and resonant components in RMS feature responses
a) Transverse displacement
b) Vertical displacement
c) Stress
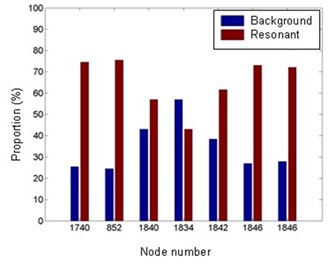
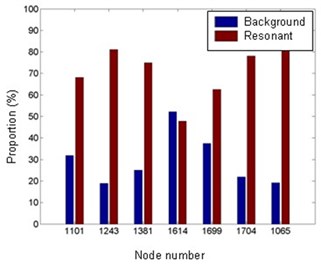
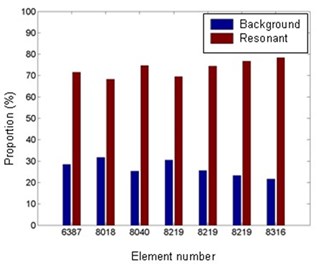
It’s seen from the spectra in Figs. 12 and 13 that the background and resonant responses are clearly separated, so the proportion of the resonant or background component in RMS response can be obtained by integrating the spectra. Fig. 14 shows that the proportion of the resonant component is generally larger than that of the background component with the only exception of slightly larger background proportion in 135°. However, 135° is not the most unfavorable direction of the shell, so the resonant component can not be ignored in the evaluation of extreme wind-induced response of DCLS. Regarding to the stress response, its resonant component is also greater than the background component in all wind directions.
5.4. Distribution of ESWL
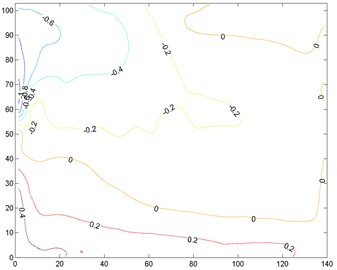
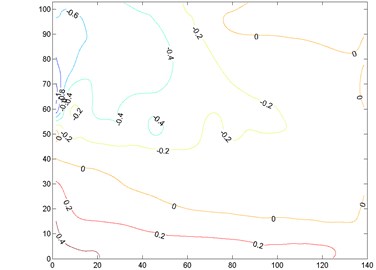
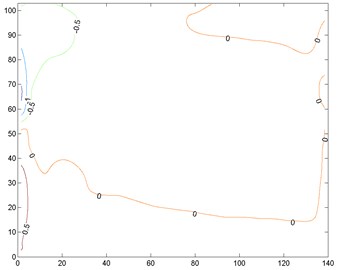
In order to conveniently compare the EWSL Fe for different targets, Fe is reversely transformed to pressure coefficient according to the method of calculating the nodal wind force from the wind pressure on the taps. Fig. 15 gives the distributions of ESWL in 90° targeting the feature transverse, vertical displacements and stress, respectively. It’s clearly seen that main difference among these distributions lies on the top of the roof, where the flow separates and vortexes shed. The ESWLs on the top is relatively greater than those on the windward or leeward side. Since the vertical displacement dominates the vibration at the top, the ESWL and its gradient targeted the vertical displacement are larger.
Fig. 15Comparison of ESWL for different targets in 90°
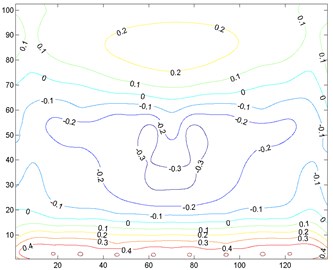
a) Transverse displacement
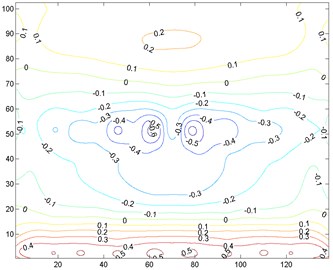
b) Vertical displacement
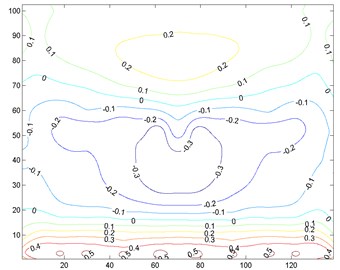
c) Stress
In 135°, main difference among the distributions appears at the windward end, which is also the flow separation area (Fig. 16). At this area, the vertical displacement is close to the transverse displacement, so their ESWLs are similar.
Therefore, the ESWLs for different targets have similar distributions except at the flow separation area. At this area, higher turbulence intensity results in stronger amplification of the structure on wind effects, and the type of target dominating the response will produce larger ESWL. Since the response of the flow separation area is commonly the controlling response of the structure, the type of target should be appropriately selected according to the concerned structural performance during structural design.
Fig. 16Comparison of ESWL for different targets in 135°
a) Transverse displacement
b) Vertical displacement
c) Stress
Table 2 compares the feature responses obtained from the CQC method and the static analysis under ESWL targeting at the corresponding feature response. Relative errors of both methods are also presented in the table. It’s shown that both methods produce the same transverse displacements, and the maximum errors of the vertical displacement and the stress are 3 % and 1.1 %, respectively. Thus, it’s proved that the extreme responses calculated by the adopted ESWL method are sufficiently accurate.
Table 2Feature responses computed by ESWL and relative errors with the CQC method
Wind direction (°) | 90 | 105 | 120 | 135 | 150 | 165 | 180 |
Transverse displacement (m) | –0.066 | 0.051 | 0.080 | 0.095 | 0.091 | 0.067 | 0.031 |
Relative error (%) | 0 | 0 | 0 | 0 | 0 | 0 | 0 |
Vertical displacement (m) | –0.101 | –0.099 | –0.096 | –0.096 | –0.082 | –0.064 | –0.039 |
Relative error (%) | 3 | 3 | 2 | 1 | 0 | 0 | 0 |
Stress (MPa) | 133.8 | 133.5 | 139.8 | 137.4 | 137.1 | 106.4 | 61.2 |
Relative error (%) | –0.7 | 1.1 | 0.1 | 0.3 | 0.1 | 0.1 | 0.2 |
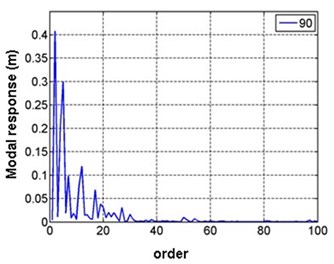
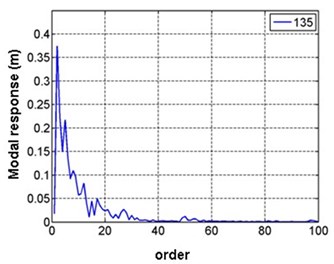
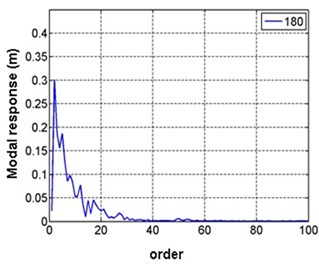
Fig. 17 gives the RMS of first 100 order modal responses in different wind directions. It’s observed that only about first 20 order modes (with the frequency ranging from 1.38 Hz to 4.60 Hz) play a major role in the response, and higher modes after the 60th order are almost ineffective. Therefore, satisfactory results are gotten in the paper when first 100 order modes are adopted for calculating wind-induced responses of the shell.
Fig. 17RMS of first 100 order modal responses in different wind directions
a) 90°
b) 135°
c) 180°
5.5. Response characteristics considering nonlinearity
To investigate the wind-induced nonlinear properties of the shell, wind load incremental factor f is defined to increase the unsteady wind forces on the shell based on a proportional loading strategy:
where Fij represents the actual wind forces acting on the shell; F0ij denotes the wind forces that corresponds to the basic wind pressure of the shell.
Then, the maximum displacement response of the shell under the action of wind forces Fij corresponding to specified f is defined as:
where wmax is the maximum displacement response of the structure; T denotes the length of wind duration, that is, record length Ttotal at full scale; t represents the acting moment of unsteady wind forces; and w is the displacement response of every node of the structure at t under specified f. Therefore, wmax denotes the maximum value of the displacement responses of all the nodes of the structure during entire duration T of wind actions that correspond to load incremental factor f.
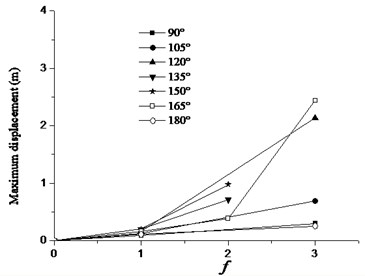
The nonlinear dynamic response computation is conducted continuously under increasing load incremental factor f by the commercial finite element program, ANSYS. In the computation, a bilinear kinematic hardening model is assumed to simulate the actual material performance of the bars under high wind velocity, in which the yield stress and tangent modulus after yielding are 235 and 118 MPa, respectively. Meanwhile, structural gravity and the initial geometric imperfection under mean wind load F0ij are included. According to the results of the dynamic response computation, the maximum displacement response wmax of the shell generally increases in all wind directions (Fig. 18) with increasing wind velocity.
Fig. 18Variation in maximum displacement response with f
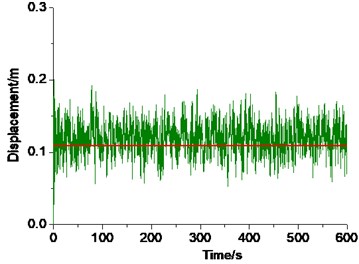
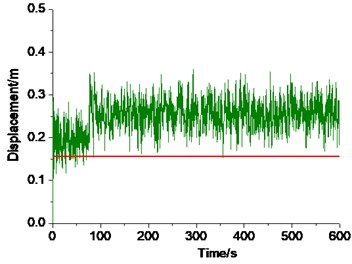
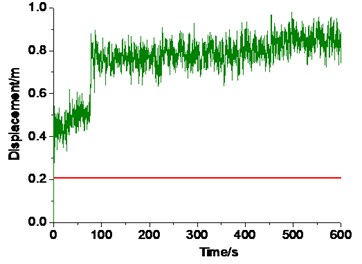
Take the wind direction of 150° for example (Fig. 19). The node producing maximum displacement response wmax (the characteristic node) oscillates stably around the static equilibrium position during the entire wind duration under f=1.0. However, when f reaches 1.5 and 2.0, the characteristic node moves past the static equilibrium position immediately after wind forces are loaded, and jumps at about t=40, 70, and 450 s. Under f=2.0, its dynamic equilibrium position shifts from 0.5 to 0.77 m away from the original configuration of the shell at t=70 s.
Fig. 19Displacement time histories of the characteristic nodes at 150°
a)f=1.0
b)f=1.5
c)f=2.0
6. Conclusion
Based on the wind tunnel tests and the programmed code, characteristics of wind-induced vibration and ESWL of the DCLS are studied to achieve the following conclusions.
(1) The wind pressure energy at the top of the shell is higher than that at the windward or leeward side within the scope of f*<0.1. Wind pressures at the top have strong correlation with those at windward side, but weak correlation with those at the leeward side.
(2) The feature responses are basically located at the top or the windward end. The average and peak responses are sensitive to wind directions. The most unfavorable wind direction and the dangerous area is 90° and the middle top, not 120° and the end area stated in the previous documents.
(3) According to the response spectra, the response at the top is mainly contributed by lower order modes of vertical motion, while many modes of transverse or vertical motion are excited in the response of the windward end. High order modes are excited in the stress response. The proportion of resonant component is generally larger than the background component, so it should not be ignored.
(4) At flow separation area, higher turbulence leads to stronger structural amplification on wind effects and different ESWL distributions for different targets. The type of target of should be properly chosen according the concerned structural performance during structural design. First 20 order modes play a major role in the wind-induced response of the studied DCLS.
(5) When structural material and geometrical nonlinearities are considered, the maximum response of the shell increases with wind velocity, the characteristic nodes don’t oscillate around the static equilibrium position and their dynamic equilibrium positions jump with time.
References
-
Chen F. B., Li Q. S., Wu J. R., Fu J. Y. Wind effects on a long-span beam string roof structure: wind tunnel test, field measurement and numerical analysis. Journal of Constructional Steel Research, Vol. 67, Issue 10, 2011, p. 1591-1604.
-
Rizzo F. Wind tunnel tests on hyperbolic paraboloid roofs with elliptical plane shapes. Engineering Structures, Vol. 45, 2012, p. 536-558.
-
Ding Z., Tamura Y. Contributions of wind-induced overall and local behaviors for internal forces in cladding support components of large-span roof structure. Journal of Wind Engineering and Industrial Aerodynamics, Vol. 115, 2013, p. 162-172.
-
Li C., Li Q. S., Huang S. H., Fu J. Y., Xiao Y. Q. Large Eddy simulation of wind loads on a long-span spatial lattice roof. Wind and Structure, Vol. 13, Issue 1, 2010, p. 57-82.
-
Kim J. Y., Yu E., Kim D. Y., Tamura Y. Long-term monitoring of wind-induced responses of a large-span roof structure. Journal of Wind Engineering and Industrial Aerodynamics, Vol. 99, Issue 9, 2011, p. 955-963.
-
Li Y. Q., Tamura Y., Yoshida A., Katsumura A., Cho K. Wind loading and its effects on single-layer reticulated cylindrical shells. Journal of Wind Engineering and Industrial Aerodynamics, Vol. 94, Issue 12, 2006, p. 949-973.
-
Zhou Z., Li Z. M., Meng S. P., Wu J. Wind-induced vibration responses of prestressed double-layer spherical latticed shells. International Journal of Steel Structures, Vol. 11, Issue 2, 2011, p. 191-202.
-
Mi F. S., Zhou X. Y., Gu M. Analysis of wind-induced buffeting responses of latticed cylindrical shells. Journal of Vibration and Shock, Vol. 26, Issue 7, 2007, p. 32-39, (in Chinese).
-
Zhou X. Y., Huang P., Gu M., Mi F. S. Wind loads and responses of two neighboring dry coal sheds. Advances in structural engineering, Vol. 14, Issue 2, 2011, p. 207-221.
-
Zhou X. Y., Gu M., Mi F. S., Huang P. Analysis of wind-induced responses of dry coal sheds under interference condition. Journal of Tongji University, Vol. 38, Issue 6, 2010, p. 819-826, (in Chinese).
-
Huang P., Zhou X. Y., Gu M. Experimental study of wind loads on cylindrical latticed shells. Applied Mathematics and Mechanics-English Edition, Vol. 34, Issue 3, 2013, p. 281-296.
-
Davenport A. G. Gust loading factor. Journal of Structural Division, Vol. 93, Issue ST3, 1967, p. 11-34.
-
Kasperski M. Extreme wind load distributions for linear and nonlinear design. Engineering Structures, Vol. 14, Issue 1, 1992, p. 27-34.
-
Kasperski M., Niemann H. J. The L.R.C. (load-response-correlation) – method: a general method of estimating unfavorable wind load distributions for linear and non-linear structural behavior. Journal of Wind Engineering and Industrial Aerodynamics, Vol. 43, Issue 1-3, 1992, p. 1753-1763.
-
Zhou Y., Gu M., Xiang H. F. Along wind static wind loads and responses of tall buildings-part I: unfavorable distributions of static equivalent wind loads. Journal of Wind Engineering and Industrial Aerodynamics, Vol. 79, Issue 1-2, 1999, p. 135-150.
-
Holmes J. D. Effective static load distributions in wind engineering. Journal of Wind Engineering and Industrial Aerodynamics, Vol. 90, Issue 2, p. 91-109.
-
Fu J. Y., Xie Z. N., Li Q. S. Equivalent static wind loads on long-span roof structures. Journal of Structural Engineering, ASCE, Vol. 134, Issue 7, 2008, p. 1115-1128.
-
GB50009-2001. Load code for the design of building structures. Ministry of Construction of P. R. China, 2006, (in Chinese).
-
Pan F., Cai C. S., Zhang W. Wind-induced internal pressures of buildings with multiple openings. Journal of Engineering Mechanics, Vol. 139, Issue 3, 2013, p. 376-385.
-
Simiu E., Scanlan R. H. Wind effects on structures: fundamentals and applications to design. Third Edition, John Wiley & Sons Inc., New York, 1996.
-
Xie Z. N. New rapid algorithm for wind-induced random vibration of complex structures. Chinese Journal of Applied Mechanics, Vol. 24, Issue 6, 2007, p. 263-266, (in Chinese).
-
Clough R. W. Dynamics of structures. Second Edition, Computers and Structures Inc, Berkeley, 2003.
-
Amandolese X., Hémon P., Manzoor S. The transient temporal response of a flexible bridge deck subjected to a single gust. Journal of Computational and Applied Mathematics, Vol. 246, 2013, p. 153-160.
-
Gavanski E., Kordi B., Kopp G., Vickery P. Wind loads on roof sheathing of houses. Journal of Wind Engineering and Industrial Aerodynamics, Vol. 114, 2013, p. 106-121.
About this article
The research was jointly supported by the grants from the National Natural Science Foundation of China (Nos. 51208126 and 51222801) and the Foundation for Distinguished Young Talents in Higher Education of Guangdong, China (No. 2012LYM_0107).
