Abstract
The aim of the study was to analyze the effect of different muscle temperature on human kinematic characteristics. Kinematic analysis was used to explain how the experimental equipment “Biodex Medical System PRO 3” computes kinematic parameters. Subjects were tested using “Biodex Medical System PRO 3”, human muscle testing and rehabilitation equipment. Calf extensor and flexor muscle performance was tested. Muscle heating was performed by water temperature of 44±1 °C; muscle cooling – water temperature of 15±1 °C. Ten adult males were involved in the experiment.The kinematic analysis was performed by solving a set of equations that result from the kinematic and driver constraints. Gravity correction is admittedly less of a problem in extremity testing since the contra lateral (uninvolved) segment serves as the basis for comparison deriving the percentage deficiency. Unless indicated otherwise, the weight of symmetrical segments is considered equal. On the other hand, where no collateral segment exists, such as the case with the trunk, the poor accuracy of the commonly employed procedures for correcting this effect or abstaining from using it has significant ramifications in terms of the correct clinical interpretation.
1. Introduction
Direct limb heating can greatly affect muscle force and power during isokinetic exercises [1, 2]. With the rise in temperature of the muscle, tendons, ligaments and connective tissue can stretch more leading to an increase in the range of motion of the joint [3, 4]. It has been established that when the internal muscle temperature rises by one degree, metabolic processes in cells are accelerated by approximately 13 percent [5]. Heating muscle, unlike cooling, accelerates ATP hydrolysis [6] and anaerobic glycolysis. Research literature suggests that high environmental [1] and increased internal body temperature [7] accelerate the occurrence of fatigue during concentric exercise mode. The originality of the research is that the effect of passive heating and cooling on muscle contraction properties and muscle fatigue depending on muscle contraction rate has been studied and to explain how the experimental equipment "Biodex Medical System PRO 3” computes kinematic parameters.
2. Methods and samples
The research sample consisted of 21±2.2 year-old men ( 10) (height – 177.8±5.8 cm, weight – 78.2±6.1 kg, body fat mass – 7.5 % (5.6 fat mass/kg)). The study was conducted in accordance with the principles of human experimentation ethics adopted in the Declaration of Helsinki. The Research Protocol was approved by the Bioethics Committee of KUM (Protocol No. P1-80/2004).
Calf extensor and flexor muscle performance testing. Subjects were tested using “Biodex Medical System PRO3” (certified ISO 9001EN 46001), human muscle testing and rehabilitation equipment. Additional calf device was attached to the dynamometer. Knee joint anatomical axis was identified. The subject was surrounded by the shoulder, torso and thigh belts [8]. The calf was reinforced by the belt and fastened with the buckle over the lower third of the calcaneus tuberosity, the leg was fixed at the knee joint angle of 90° and weighed when it was fixed at 72±5° angle (at the moment of the gravitational force). Isokinetic mode and concentric contraction type were selected on the control panel. The maximum force moment, the average power, the force moment exercising at maximum speed and the maximum speed were registered.
Muscle heating methods. While sitting, the subjects held their out-stretched legs for 45 minutes in a hot bath with the water temperature of 44±1°C, and room temperature of 20-22°C. The water in the bath was filled to the amount that both thighs were completely submerged. At the end of heating, muscle temperature at the depth of 3 cm increased by ~2.7°C [1, 8]. Water temperature was measured using water thermometers, and room temperature – air thermometers.
Muscle cooling methods. The subjects immersed their feet in a cold bath two-times for 15 min (making a 10 min break); the water temperature was 15±1°C. Quadriceps muscle temperature at the depth of 3 cm decreased to 32.5±0.3°C (before cooling it was 36.8±0.2°C) [1, 8].
Research procedures. A total of three experiments were carried out – when muscle temperature was normal (N), when the muscle was heated (H) and cooled (C). No less than a two-three-month break was made between the studies. The experiments differed only in that, that during the second experiment, muscle temperature of the subjects performing concentric exercise test was increased – it was 39.5±0.3°C, and during the third one it was reduced – it was 32.5±0.3°C. The stages of all experiments (when the muscle temperature was normal, the muscle was heated and cooled) were the same. Prior to each experiment, the subjects were introduced to the process of the research and trained to do the exercise. The room temperature was constant throughout the study (20-22°C). While registering knee extensor and flexor muscle performance, control measurements were carried out (before the load, immediately after it, 10, 30, 60 min and 24 h after it): one set of 3 movements (calf stretching and extending) at the speed of 180 º/s. Rest between measurements was 60 seconds, then concentric load was carried out – 50 calf muscle extensions and flexions at the speed of 180 º/s.
The results obtained were processed using the methods of mathematical statistics, i. e. by calculating the arithmetical mean and the mean square deviation. The significance of differences was between arithmetical mean () and the mean square deviation (SD). The significance of differences between arithmetical means was established according to the paired-samples t test. The degree of significance of differences between arithmetical means was considered important when the value of was smaller than 0.05 ( 0.05). Calculations were made applying the statistic Microsoft Excel 2003 and SPSS 11.5 programs.
3. Physiological and biomechanical aspects
The techniques, be they isometric, isokinetic or other, employed to measure muscle “force” in live subjects, are based on a different method. Instead of force, which is basically a linear entity, the appropriate term is strength. This is defined as the rotational effect of the force, generated by a single muscle or a muscle group, about the joint under consideration, and is also called the moment. Although strength is defined with respect to any point along the joint range of motion (ROM) in which the muscle(s) exert this effect, the common meaning of strength is the point in the ROM where strength reaches its maximum. Hence the term peak moment or peak torque (see below). Strength also involves the concept of synergy, reference being made, where applicable, to the combined action of a number of muscles rather than of a single muscle [9].
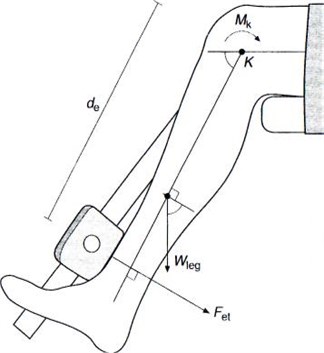
Disregarding for a moment the effect of gravity (see below), strength is measured by recording the force exerted on the sensor of the dynamometer by the body segment distal to the joint, and multiplying the value obtained by the length of the force sensor’s lever-arm (Fig. 1) to give a moment . In other words, the mechanical potential of the muscle is only inferred rather than measured directly. Moreover, simple mechanical considerations indicate that the amount of force exerted on the force sensor is inversely proportional to the distance between the joint axis and the point of force application. Since the length of body segments is generally small, a deviation of even 1 cm from the original placement of the sensor may, upon retesting, introduce errors of approximately 2.5-5 % with a corresponding effect on the reproducibility of the test findings.

Fig. 1. In an isometric or isokinetic gravity-free situation the moment , generated by the muscle (the quadriceps femoris in this case) would be equal to the distance between the force resistance pad and the instantaneous center of rotation of the knee, times the force recorded by the sensor, Fet. , weight of leg (shank + foot) [10]
In dynamic contractions, the external moment, namely the moment which has to be overcome by the muscle, is normally generated by three distinct elements:
1. the individual weight of the segment(s) distal to the joint;
2. the load against which one acts, for instance lifting an object;
3. the inertial resistance of the segment.
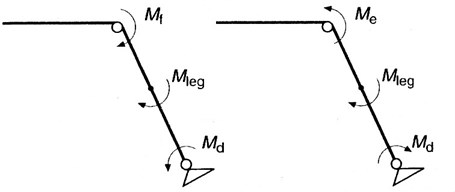
As soon as the isokinetic condition is reached, namely the lever-arm proceeds at a constant angular velocity, the acceleration components are negligible. Therefore, in order to determine the net muscle force it is necessary to account for the effect of weight. Consider Figure 2 which refers to the isometric measurement of the strength of the knee extensors and flexors in the seated position.

Fig. 2. Moment configuration simulated during isokinetic testing of flexors () and extensors (). , moment generated by the dynamometer's lever-arm; , gravitational moment of the leg
The extensors act in the opposite direction to the weight of the leg and the resistance of the dynamometer. The moment exerted by the extensors, (counterclockwise, Fig. 2), must be equal to the moment of weight of the leg (shank and foot), plus the moment exerted by the resistance of the dynamometer, (both clockwise and counterclockwise, Fig. 2). This relationship is given by the equation:
In isokinetic testing the above mentioned argument is valid for the analogous case of extensor and flexor concentric (see below) contractions, i.e. where the muscle is overcoming the weight of the limb and the resistance of the dynamometer. In order to obtain the true value of the muscle strength it is therefore necessary to perform the so-called 'gravity correction' procedure which is incorporated in commercially available isokinetic systems. The procedure is based on 'weighing' the segment at a given recorded position (normally as close to the horizontal as possible) which is performed by the system's load cell and a simple trigonometric calculation which is incorporated in the force or moment data processing by the computer. However, as it has been indicated by a number of recent papers [11], gravity correction procedures are error prone. This error is primarily due to two factors:
1. Biological joints cannot be simulated by a perfect hinge-type joint which serves as the basic assumption of the software procedure.
2. There is a measure of active and passive resistance in addition to the gravitational one that must be accounted for (and is not).
The active element is contributed by surrounding muscles that may fire even though when the measurement is done while subjects are required to relax completely. The passive element results from the stretch of ligaments, tendons and capsule. Therefore, instead of a sinusoidal component, the resistance assumes a different pattern. An effective example is depicted in Wessel et al. [12] where testing of trunk flexor strength and the 'gravitational' components of the trunk were measured. Although the alternative solution - moving the tested segment passively through the ROM and subtracting the obtained resistance from the active strength in order to derive the net strength – partially solves the first difficulty (non-axial movement), it certainly suffers from the same problems regarding the passive/active components. As a result, isokinetic tests should have been done in the non-gravitational position. However this is not only non-functional in many instances but requires awkward subject positioning and special attachments. Gravity correction is admittedly less of a problem in extremity testing since the contralateral (uninvolved) segment serves as the basis for comparison for deriving the percentage deficiency. Unless indicated otherwise, the weight of symmetrical segments is considered equal. On the other hand, where no collateral segment exists, such as the case with the trunk, the poor accuracy of the commonly employed procedures for correcting this effect or abstaining from using it has significant ramifications in terms of the correct clinical interpretation.
4. Results
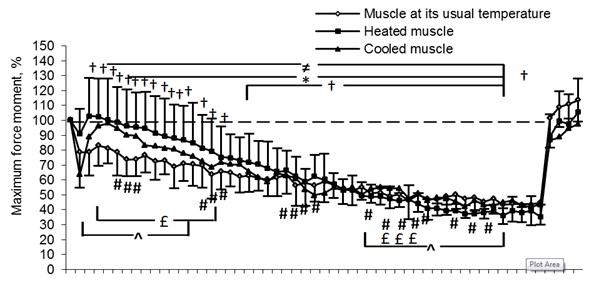
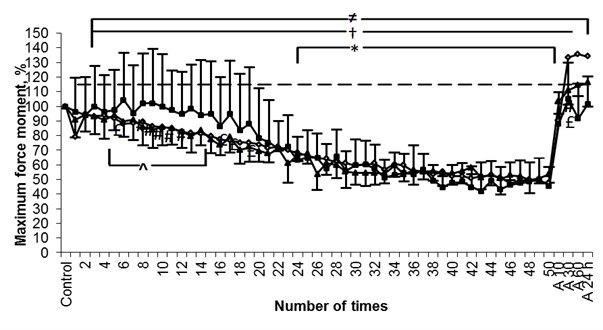
The results obtained in the course of the research have shown that men’s maximum voluntary contraction during testing with the leg being extended decreased by: muscle at its usual temperature ~ 56 %, heated muscle ~ 64 %, cooled muscle ~ 54 % and with the leg being flexed - by: muscle at its usual temperature and cooled muscle ~ 50 %, heated muscle ~ 60 % accordingly (Fig. 3). We have established maximum force moment (MFM) of the force of heated muscle (contractions 1-9) during leg extension in the knee joint at the fixed 180 º/s speed to be significantly higher ( 0.05) compared to the indices of cooled muscle, but starting with the 31st leg extension and flexion MFM 10 min after load was significantly lower ( 0.05) compared to the indices of cooled muscle. A comparison of the indices of MFM of the muscle at its usual temperature and those of cooled muscle has revealed that MFM of the muscle at its usual temperature (starting with contractions 6-8 and 27-45) was significantly lower ( 0.05) compared to the indices of cooled muscle. After comparing the indices of MFM of cooled muscle with those of muscle at its usual temperature we have established that MFM of the force of warmed muscle (contractions 3-13) was significantly higher ( 0.05) compared to the indices of the muscle at its usual temperature (Fig. 3(a)). We have established that during leg flexion in the knee joint with the fixed 180 º/s speed, MFM of the force of heated muscle (contractions 4-13) was significantly higher ( 0.05) compared to the indices of cooled muscle (Fig. 3(b)).
Fig. 3Changes in men’s maximum force moment (%) before performing isokinetic load (extending (a) and flexing (b) the leg in the knee joint at the fixed 180 o/s speed), as well as 10 min (A 10), 30 min (A 30), 60 min (A 60) and 24 h (A 24) after the load. Note. Muscle force changes of leg extensors and flexors (p< 0.05) compared to their control values: ≠ – muscle at its usual temperature, * – heated muscle, † – cooled muscle; # – difference in muscle force changes between muscle at its usual temperature and cooled muscle (p< 0.05), ^ – difference in muscle force changes between cooled and heated muscle (p< 0.05) and £ – difference in muscle force changes between muscle at its usual temperature and heated muscle (p< 0.05)

a)

b)
During maximum voluntary contraction of the muscle men’s MFM of the force of dynamic contraction with the leg being extended and flexed in the knee joint at the fixed 180 º/s speed is dependent on time ( 0.000) and on temperature ( 0.000). During leg extension and leg flexion in the knee joint significant interactions between time and muscle temperature ( 0.000), between time and the work performed by the muscle (extension-flexion) ( 0.000), as well as between time, temperature and the work (extension-flexion) performed by the muscle ( 0.000), have been established (Table 1).
Table 1Analysis of variance of three factors of the maximum force moment
Dependence on: | Knee extension | Knee flexion |
Time | 0.000 | 0.000 |
Temperature | 0.000 | 0.001 |
Interaction (time–temperature) | 0.000 | 0.000 |
Work performed by the muscle (extension–flexion) | 0.149 | |
Interaction (time–work performed by the muscle) | 0.000 | |
Interaction (temperature–work performed by the muscle) | 0.000 | |
Interaction (temperature–time–work performed by the muscle) | 0.000 | |
5. Conclusions
The kinematic analysis is performed by solving a set of equations that result from the kinematic and driver constraints. Gravity correction is admittedly less of a problem in extremity testing since for deriving the percentage deficiency, the contralateral (uninvolved) segment serves as the basis for comparison. Unless indicated otherwise, the weight of symmetrical segments is considered equal. On the other hand, where no collateral segment exists, such as the case with the trunk, the poor accuracy of the commonly employed procedures for correcting this effect or abstaining from using it has significant ramifications in terms of the correct clinical interpretation.
References
-
Sargeant A. J. Effect of muscle on leg extension force and short-term power output in humans. European Journal of Applied Physiology, Vol. 56, 1987, p. 693-698.
-
Ball D., Burrows C., Sargeant A. J. Human power output during repeated sprint cycle exercise: the influence of thermal stress. European Journal of Applied Physiology, Vol. 79, 1999, p. 360-366.
-
Strickler T., Malone T., Garret W. E. The effects of passive warming on muscle injury. The American Journal of Sports Medicine, Vol. 18, Issue 2, 1990, p. 141-145.
-
Kirkendall D. T., Garret W. E. Clinical perspectives regarding eccentric muscle injury. Clinical Orthopaedics and Related Research, Vol. 1403, 2002, p. 81-89.
-
Febbraio M. A. Does muscle function and metabolism affect exercise performance in the heat? Exercise and Sport Sciences Reviews, Vol. 28, 2000, p. 171-176.
-
Galloway S. D. R., Moughan R. J. Effects of ambient temperature on the capacity to perform prolonged exercise in humans. Medicine Science and Sports Exercise, Vol. 29, 1997, p. 1240-1249.
-
Gonzalez-Alonso J., Teller C., Anderson S. L., et al. Influence of body temperature on the development of fatigue during prolonged exercise in the heat. Journal of Applied Physiology, Vol. 86, 1999, p. 1032-1039.
-
Ramanauskienė I., Skurvydas A., Sipavičienė S., et al. Influence of heating and cooling on muscle fatigue and recovery. Medicina, Vol. 44, Issue 9, 2008, p. 687-693.
-
Herzog W., Hasler E., Abrahames S. A comparison of knee extensor strength curves obtained theoretically and experimentally. Medicine and Science in Sport and Exercise, Vol. 23, 1991, p. 108-114.
-
Nisell R., Ericson M. T ibiofemoral joint forces during isokinetic knee extension. American Journal of Sport Medicine, Vol. 17, 1989, p. 49-54.
-
Bygott I. L., McMeeken J., Carroll S. A preliminary analysis of the gravity correction procedures applied in trunk dynamometry. Isokinetics and Exercise Science, Vol. 9, 2001, p. 53-64.
-
Wessel J., Ford D., Van Drietsum D. Measurement of torque of trunk flexors at different velocities. Scandinavian Journal of Rehabilitation Medicine, Vol. 24, 1992, p. 175-180.
