Abstract
This paper focuses on the strategic decarbonization of Carbon Capture, Utilization, and Storage (CCUS) technologies within the ACTiON project, emphasizing the Romanian cluster in Oltenia. By leveraging the Getica CCS framework, the study analyzes specific technologies and measures for multimodal CO2 capture and offshore storage, including transport via pipelines, the Danube River, and rail. Proxy models address data restrictions for evaluating storage and CO2-EOR potential. Results analyze technical, logistical, and environmental challenges, offering scalable strategies for CO2 management. Insights aim to advance Romania’s decarbonization efforts while contributing to European best practices, benefiting policymakers, industries, and global sustainability initiatives.
1. Introduction
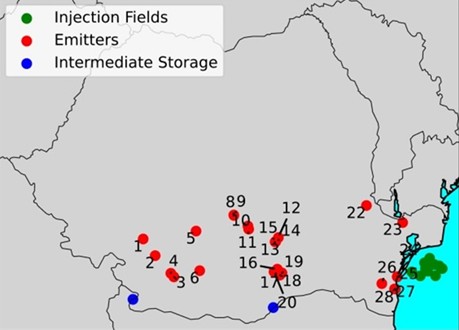
The ACTiON project represents a pivotal initiative aimed at advancing the decarbonization of industrial activities through the deployment of Carbon Capture, Utilization, and Storage (CCUS) technologies. As a strategic effort encompassing six industrial regions, the project emphasizes the development of tailored solutions for each area, with a focused study on the Romanian cluster in Oltenia. This study builds upon the national Getica CCS project, extending its framework to design and evaluate full-chain CCUS scenarios. These scenarios address the capture of CO2 from multiple sources, its transportation via diverse modalities pipelines, barges along the Danube River to the Port of Constanța, and alternative rail or road methods and its storage in offshore and onshore sites (Fig. 1).
Fig. 1Romanian cluster-injection fields, emitters, intermediate storage
The Oltenia region, located in the southern part of Romania, is characterized by unique geographic and infrastructural conditions that present both opportunities and challenges for CCUS implementation [3]. To overcome current data access restrictions, the project employs proxy models to assess the storage capacity and potential for CO2-EOR (Enhanced Oil Recovery). These models enable the evaluation of storage solutions' feasibility and their contribution to greenhouse gas (GHG) emission reductions in the region.
In addition to technical considerations, the project evaluates the logistics and environmental impacts associated with CO2 transportation [1], identifying scalable and replicable strategies for managing CO2 emissions. By integrating these systems into broader energy infrastructures, the study not only enhances the understanding of CCUS potential in Romania but also contributes to the development of best practices for decarbonization efforts across Europe. This research is expected to offer valuable insights for policymakers, industry stakeholders, and researchers dedicated to global decarbonization initiatives.
2. Romanian cluster
The Romanian cluster within the ACTiON project encompasses 28 stationary CO2 emitters across 9 industrial sectors, with a combined emissions output of approximately 15 million tonnes per annum (Mtpa).
To address these emissions, 10 potential storage sites have been identified, including 6 saline aquifers with an estimated capacity of 278-350 million tonnes (Mt) and 4 hydrocarbon reservoirs with a storage capacity [5] ranging from 368-460 Mt. This section focuses on the multimodal technologies implemented for CO2 capture from these emitters and the integration of transport solutions for delivering CO2 to these identified storage sites.
Additionally, two ports are being considered for intermediate CO2 storage, facilitating the integration of multi-modal transport solutions. These sites and infrastructures play a key role in designing a comprehensive CCUS system for Romania.
Fig. 2Emissions profile of the Romanian cluster: distribution of CO2 emissions by sector over 30 years
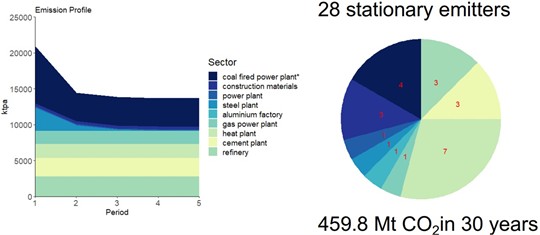
The Fig. 2 presents the CO2 emissions profile for the Romanian cluster, showing the distribution of emissions across industrial sectors over a 30-year period. It is evident that the largest emissions come from the coal-fired power plant sector (marked in dark blue), which contributes approximately 7 million tonnes of CO2 over the 30 years.
This is followed by other significant sectors, such as gas power plants, cement factories, steel plants, and construction materials factories, each contributing a substantial amount of CO2. It is also noteworthy that less emitting sectors, such as refineries and aluminum factories, have a relatively minor contribution compared to other sectors.
Analyzing these data helps in identifying priorities for the implementation of CCUS technologies and in allocating resources for emission reductions in these key sectors (Fig. 2).
3. Methodology
To assess the efficiency of various CO2 transportation modes from industrial emitters to storage sites, this study evaluates the technologies and measures for multimodal CO2 capture, followed by the development of a complex set of routing model has been developed, considering the existing infrastructure in Romania. These models are structured to identify the most optimal routes for four main types of transport: pipelines, trucks, rail, and ships.
Firstly, for pipeline transportation, Haversine distances were used to calculate the shortest paths between CO2 emitters and storage sites. This method helps identify optimal routes by minimizing distances and transportation costs.
For rail and road transport, the shortest paths were identified based on existing infrastructure networks in Romania (Fig. 3), taking into account geographic configurations and connections between industrial sectors and destination ports. Regarding waterborne transport, an assessment of the shortest paths for vessels navigating the Danube River and its connected channels was carried out, considering strategic ports in the southern part of the country.
Another important aspect of the methodology is the development of a multi-period incidence matrix, which accounts for the long-term evolution of infrastructure and transportation capacities. In the initial periods of the project, given the limited availability of large-capacity ships, smaller transport capacities will be used.
This will be reflected in the incidence matrix, which helps adapt the CO2 flow based on the project's infrastructural conditions and development forecasts. Thus, the proposed approach allows for the evaluation of CO2 transportation dynamics over time, while reflecting current infrastructural realities and future development projections.
Fig. 3Routing models for CO2 transport via pipelines, trucks, rail, and ships
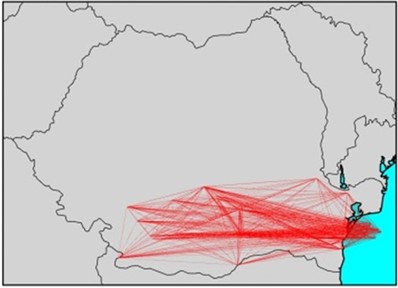
a) Shortest haversine distances for pipeline routing
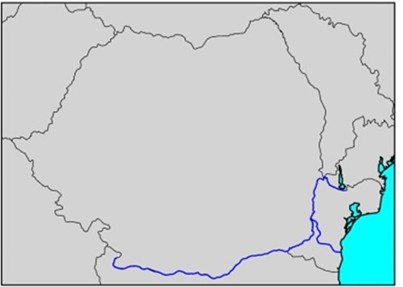
b) Vessel shortest paths on Danube river and channels
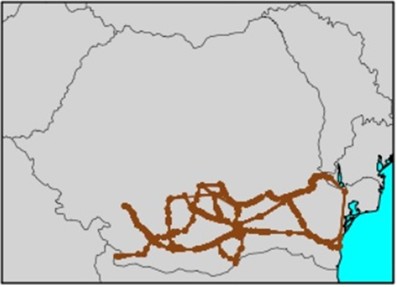
c) Rail shortest paths
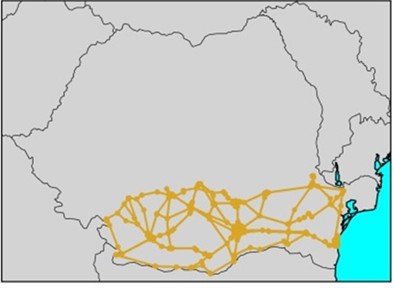
d) Road shortest paths
Considering the existing national infrastructure (Fig. 4), the CCS cluster in Romania can benefit from well-established transport routes for CO2 capture, transport, and storage. The routing models developed for pipelines, trucks, rail, and ships allow the evaluation of the most efficient logistical solutions, taking into account the current transport network and the characteristics of each method.
In this context, utilizing the existing infrastructure can facilitate the implementation of large-scale decarbonization solutions [6], significantly contributing to the reduction of CO2 emissions across various industrial sectors in Romania.
Fig. 4Routing models for CO2 transport via pipelines, trucks, rail, and ships based on existing infrastructure
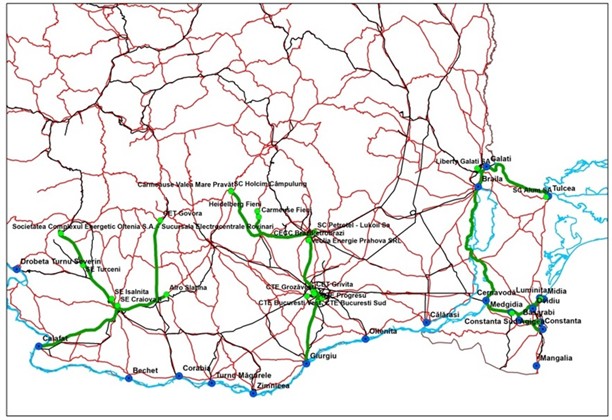
Table 1Batch-wise design and cost analysis for the CCS cluster in period 5
Batch-wise design in period 5 | |
Ships 7.5 kt capacity | 15 |
Trips per year | 1.723 |
Total cost (M €) | 11.231 |
Unit cost (€ t-1 CO2) | 26.7 |
Levelised cost (€ t-1 CO2) | 35.2 |
Well design in period 5 | |
Total wells | 6 |
Template | 5 |
Satellite | 1 |
Pipeline segments in period 5 | 37 |
Onshore | 31 |
Offshore | 6 |
In Period 5 of the CCS cluster project in Romania, several critical aspects of CO2 capture and storage infrastructure and costs are highlighted. The ships’ transport capacity is 7.5 kt per ship, with 1723 trips per year, indicating a significant volume of CO2 to be transported via maritime routes. Regarding well design, 6 wells are planned, 5 of which will be installed on template platforms, and 1 on a satellite platform.
As for the costs, a total of €11.231 million is estimated, with a unit cost of €26.7 per ton of CO2 captured and stored. The levelized cost is estimated at €35.2 per ton of CO2 (Table 1), reflecting a more comprehensive evaluation of long-term costs.
Concerning pipeline infrastructure, 37 segments are planned, with 31 onshore and 6 offshore, suggesting a balanced mix of solutions for CO2 transportation. These figures indicate a complex project, with a significant impact on decarbonization infrastructure, considering the large volume of CO2 managed and the costs associated with its implementation in the specified period.
For example, in a CCS (Carbon Capture and Storage) project, a “batch-wise design” would involve processing a specific amount of CO2 emissions within a set timeframe, with each batch having its own requirements and resources (e.g., number of ships, transport capacity [4], number of wells for storage, etc.). This approach allows for detailed planning and more efficient management of resources and costs over specific periods, optimizing the overall carbon capture and storage process.
4. Preliminary results
The two maps illustrate the locations of major CO2 emitters in Romania, potential offshore storage sites, and the Danube ports involved in CO2 transport via barges. In the first map, representing Period 1 (Fig. 5), the CO2 flows (ktpa) are optimized to minimize initial costs, focusing on the use of existing infrastructure. Emitters are connected to storage sites through routes involving both onshore and limited water transport, highlighting a conservative approach to logistics at this stage.
The second map, corresponding to Period 5, reflects an expanded transport network, including more offshore segments and greater integration of barge transport from the Danube ports. This evolution suggests an increase in capacity and logistical complexity, aligning with a progressive reduction in per-unit costs while managing larger CO2 volumes.
This graph (Fig. 6) is necessary to visualize and understand the distribution of CO2 emissions by sector and over time, providing essential information for planning and implementing decarbonization strategies. The graph also considers coal-fired power plants, which are analyzed after retrofitting works, enabling them to contribute to overall emission reductions in the scenario.
Fig. 5Preliminary maps of minimum cost flow of CO2 in Romania: period 1 and period 5
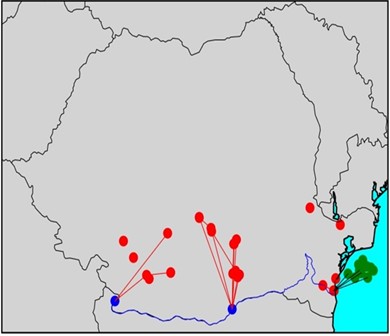
a) Period 1 minimum cost flow (ktpa)
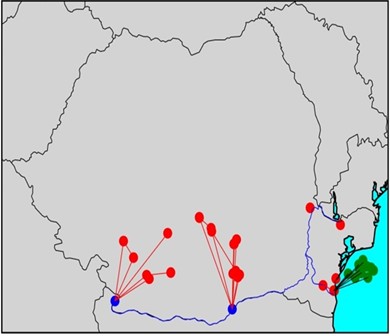
b) Period 5 minimum cost flow (ktpa)
Identifying high-emission sectors: The color intensity and distribution on the x-axis clearly identify industrial sectors that contribute the most to total emissions, such as refineries and power plants.
Assessing temporal trends: The representation on the time axis shows how emissions evolve in each sector, highlighting critical periods for implementing reduction measures.
Total emission volume: The total CO2 volume analyzed in the graph amounts to 420.4 million tonnes over a 30-year period, emphasizing the scale of the challenge and the need for coordinated reduction measures.
Fig. 6Emission profile by sector and period for the decarbonization scenario
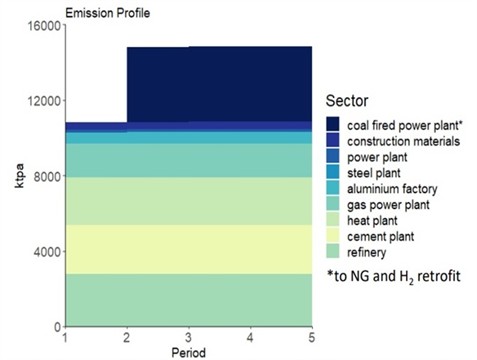
Clear communication: The graph provides an effective visual method to convey complex information to decision-makers, industry, and the public, supporting the development of informed policies.
Thus, this graph is a key tool for analyzing emissions, setting priorities, and monitoring progress in decarbonization scenarios.
The Histria Depression (Black Sea-Fig. 7) plays a vital role in the CCS cluster due to its unique combination of geological features, existing infrastructure, and CO2 storage potential. The map highlights the region's main tectonic structures, oil and gas fields, and potential CO2 storage sites, offering a detailed perspective on its resources and capabilities.
Fig. 7Opportunities in the histria depression (Black Sea): hydrocarbon exploration and CO2 storage
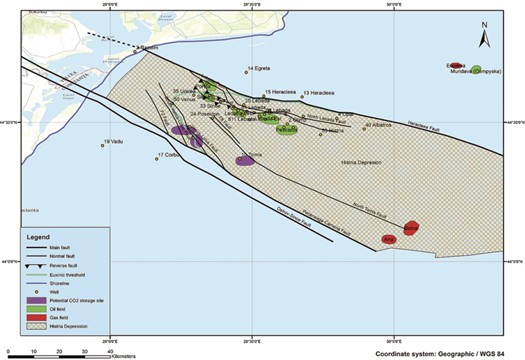
The deep saline aquifers Iris, Lotus, and Tomis, located on the southern flank of the depression, present favorable geological conditions for long-term CO2 storage, with reservoir formations in the Albian, Lower and Upper Cretaceous, and Middle Eocene, safeguarded by impermeable shale sequences.
Furthermore, the map reveals an overlap between the tectonic structures productive for hydrocarbons and those deemed suitable for CO2 storage, creating a significant opportunity to integrate these activities. The exploitation of oil and gas resources can be coordinated with CCS infrastructure development, reducing implementation costs and leveraging existing knowledge about subsurface formations. The strategic location of the depression facilitates the collection of emissions from industrial emitters in southeastern Romania, either through pipeline networks or river transport, utilizing Danube ports for transfer.
Integrating this region into the CCS cluster supports the development of scalable CO2 storage solutions, aiding in achieving emission reduction targets. Additionally, the analysis of tectonic relief and storage capacities provides a tangible example of how natural resources and infrastructure can be harnessed to address climate change challenges effectively.
5. Conclusions
The paper highlighted the importance of integrating CCS (Carbon Capture, Utilization, and Storage) technologies into Romania’s industrial regions, with a particular focus on the Oltenia cluster and the potential of the Histria Depression in the Black Sea for CO₂ storage (Fig. 7). Implementing a full CCS system that includes specific technologies and measures for multimodal CO2 capture, transport, and offshore storage solutions is crucial to achieving Romania's decarbonization targets [2]. The analysis of existing infrastructure, including transport networks on the Danube and storage options in deep saline aquifers, provides viable and scalable solutions for reducing industrial emissions. Additionally, integrating natural resources such as oil and gas fields with CO2 storage infrastructure deepens synergies between hydrocarbon exploration and decarbonization. In conclusion, this project contributes significantly to the development of effective decarbonization strategies that can be replicated in other regions, having a positive impact on reducing greenhouse gas emissions and supporting the transition to a climate-neutral economy.
This paper also emphasizes the need for an integrated approach in developing CO2 capture and storage infrastructure, which should include both public-private partnerships and technological innovation. In this context, international collaborations and investments in research will play a crucial role in accelerating the implementation of CCS solutions and reducing the associated costs.
References
-
J. Smith, “Advances in carbon capture technology,” Environmental Science and Technology, Vol. 55, No. 7, pp. 3421–3429, 2020.
-
R. Brown and P. Clark, “Impact of renewable energy integration on carbon emissions,” Renewable Energy Research Journal, Vol. 30, No. 2, pp. 215–223, 2019.
-
L. Jackson and M. Williams, “A review of CO2 storage in geological formations,” International Journal of Greenhouse Gas Control, Vol. 24, pp. 57–65, 2018.
-
F. Roberts and D. Wilson, “CO2 transport infrastructure and the challenges of large-scale storage,” Energy Procedia, Vol. 12, pp. 268–274, 2017.
-
M. Harris and S. Patel, Carbon Capture and Utilization: Technologies and Future Prospects. London: Academic Press, 2016.
-
A. Turner, “Decarbonization strategies for industrial clusters: case studies and models,” Journal of Cleaner Production, Vol. 65, pp. 123–135, 2021.
About this article
This project is funded through the ACT – Accelerating CCS Technologies programme. Financial contributions by the Executive Agency for Higher Education, Research, Development and Innovation Funding (UEFISCDI) are gratefully acknowledged. We also thank all our industrial partners for their contributions and the funding they provide towards ACTiON. We thank Denis Martins Fraga from Imperial College London for providing the graphs and maps used in this study, based on the information supplied by the lead author.
The datasets generated during and/or analyzed during the current study are available from the corresponding author on reasonable request.
Sorin Anghel: Writing – Original Draft Preparation, Conceptualization, Alexandra-Constanta Dudu: Writing – Review and Editing, Conceptualization; Constantin-Stefan Sava: Conceptualization
The authors declare that they have no conflict of interest.

