Abstract
With regard to fault diagnosis of rolling bearing, the envelope demodulation method is usually used to analyze the original vibration signal of faulty bearing, then the fault location of the bearing is determined by examining the distributions of fault characteristic frequencies, harmonics and sideband on the envelope demodulation spectral. The fault characteristic frequency with its harmonics could not be extracted by this traditional method when the original vibration signal is contaminated heavily by background noise. Besides, this method needs high professional knowledge and will expose drawbacks such as complex work, low diagnostic efficiency and so on while dealing with a large number of faulty bearings in engineering application. To solve the above problems, this paper proposes an automatic harmonic feature extraction method. Firstly, a series of bandpass filters are obtained based on fast Kurtogram, and then the original signal is filtered by the series of bandpass filters. The series of filtered signals are subjected to envelope analysis and noise reduction processing. Finally, the denoised series of envelope results are processed by the proposed algorithm for extracting the number of harmonics, harmonic intensity, and harmonic intensity index, and the target feature frequency and its harmonic components hidden in the original signal is extracted automatically. A simulation case and an engineering case verify that the proposed method can not only automatically calculate the number of harmonics of the characteristic frequencies, but also calculate the corresponding harmonic intensity, providing more effective and efficient feature support for fault diagnosis of bearing.
1. Introduction
At present, there are various methods for fault diagnosis of rolling bearings [1], among which the envelope demodulation analysis is one of the most widely used methods [2]. The basic idea of envelope demodulation analysis is to demodulate the characteristic frequency of the bearing from the optimal resonance frequency band of the vibration signal, and selection of the optimal frequency band is the key step of envelope demodulation analysis. Spectral kurtosis [3] is a classical method for selection of the optimal frequency band for subsequent envelope spectral demodulation analysis. However, it is verified that the spectral kurtosis has the defect of being sensitive to the transient impact noise [4]. Kinds of methods have been proposed to overcome the defects of spectral kurtosis, which can be roughly divided into two improvement directions. One direction is attempting to combine spectral kurtosis algorithm with other algorithms for fault diagnosis. Wang et al. utilized the characteristics of compressive sensing and adopted orthogonal matching tracking algorithm to further process the signal for fault feature extraction after spectral kurtosis analysis [5]. Wang et al. proposed a fault diagnosis method using MED and autocorrelation spectrum kurtosis map, in which the MED denoising is used to calculate the unbiased autocorrelation kurtosis of the square envelope of the original signal, and the demodulation frequency band is obtained [6]. Su et al. proposed a fault diagnosis technique based on the combination of EMD and spectral kurtosis [7]. Aiming at the problem of modal mixing and end effects existed in empirical mode decomposition (EMD), the ensemble EMD (EEMD) is combined with spectral kurtosis for fault diagnosis of rolling bearing [8]. Aiming at the problems of large fluctuation of prediction accuracy and low data utilization rate of time domain features, a rolling bearing performance prediction method was proposed based on the fusion feature of time domain, spectral kurtosis and exponential degradation model [9]. Though the above-mentioned methods combining spectral kurtosis with other signal processing method solved the shortcomings of spectral kurtosis to some extent, they are time-consuming and difficult to be used in practical engineering applications.
The other direction is to improve the shortcoming of spectral kurtosis directly. The kurtosis of the envelope spectrum of the narrowband filtered signal is adopted as an indicator for resonant frequency band identification by Protrugram to increase the spectral kurtosis’ robustness to non-Gaussian noise [10]. The largest ratio of the L2 norm to the L1 norm is used to screen the narrowband signal for envelope spectrum analysis [11]. Similarly, Infogram [12] and Autogram [13] have successively been proposed and implemented in identifying of the optimal DFB. Based on the second-order cyclostationary characteristics of the vibration signal when fail arises in rolling bearing, a second-order cyclostationary indicator is employed by log-cycligram [14] for identifying the signal components with second-order cyclostationarity. An adaptive correlated kurtogram [15] is proposed for identifying the resonance frequency band of rolling bearing, in which the empirical wavelet transform is used for the generation of paving plane. An energy-normalized fourth-order harmonic spectral cumulant is defined and used as the periodic impulse detection indicator by Harmogram [16]. The CFFsgram is proposed for the demodulation frequency band identification of the axle-box bearing under complex working condition [17]. An optimized spectral kurtosis for bearing diagnostics under electromagnetic interference is proposed, which is applied to measured and simulated signals with electromagnetic interference to show improved results [18]. Compared to the first direction combining with other methods to overcome the shortcoming of spectral kurtosis, these direct-improved methods have higher computational efficiency. However, it is still necessary to manually construct the optimal bandpass filter based on the relevant analysis results to filter the original signal, and ultimately perform manual fault diagnosis based on the distribution of characteristic frequencies, harmonics, and sidebands on the envelope spectrum of the filtered signal.
In recent years, time-frequency analysis methods with high-frequency clustering have also made some progress in harmonic feature extraction. Guan et al. proposed the velocity synchronous line frequency modulation wavelet transform, which improves the time-frequency energy concentration of any order harmonic components effectively by designing line frequency modulation wavelets with increasing inclination along the frequency axis [19]. Li et al. further extends the linear frequency modulation wavelet to polynomial wavelet, enhancing the analytical ability for strong time-varying components [20]. Zhang et al. proposed a proportional extraction line frequency modulation wavelet transform, which divides the time-frequency plane into different regions, constructs their own demodulation kernel functions, and obtains time-frequency distribution results with high time-frequency resolution for all components [21]. Considering the time regularity, that is, the effect of resampling on the instantaneous frequency of arbitrary order harmonic components, Li et al. modified the parameterized time-frequency analysis based on demodulation methods and proposed a parameterized resampling time-frequency analysis method that can improve the time-frequency energy concentration of multiple arbitrary order harmonic components [22]. Although these advanced time-frequency analysis methods have the advantage of reflecting the distribution characteristics of harmonics in both time and frequency domains when extracting harmonics features, they often fail to achieve good results when there is severe noise. Besides, the calculation processes of them are complicated.
According to the above-mentioned relevant researches, this paper proposes a simple and efficient method for automatically extracting harmonic features based on the classical spectral kurtosis algorithm. The main contributions of the paper are as follows:
1) In the case of strong background noise interference, traditional envelope demodulation spectrum analysis cannot effectively extract the harmonic characteristics of the modulation components of rolling bearing signals. To solve the above problem, a simple and effective envelope demodulation spectrum sequences denoising method is proposed.
2) An effective harmonic intensity index is defined and its concise and efficient algorithm is provided, which could reflect the intensity of harmonics effectively.
3) The proposed method can automatically output the harmonic frequency, number, intensity, and intensity index of the modulation feature components, providing effective feature vector support for the rapid intelligent diagnosis of rolling bearings. Effectiveness of the proposed method is verified through simulation and an engineering case.
The remaining parts of the paper are organized as follows: Section 2 is dedicated to the related theory and the concrete process of the proposed method. Section 3 and Section 4 are the simulation and engineering case verifications respectively, and conclusion is obtained at last in Section 5.
2. Related theories and the proposed method
2.1. Spectral kurtosis (SK)
As a dimensionless parameter index in time-frequency domain analysis index, SK is highly sensitive to the instantaneous signal components and is used widely in fault diagnosis of rotating machinery as presented in Section 1. The basic principle of SK is to calculated the kurtosis value of each spectral line in the frequency domain, which could detect the transient signals and accurately locate the position of transient signals in the frequency domain. The calculation equation of SK is presented as following:
in which and represents the modulo and mathematical expectation respectively. is the time-frequency complex envelope of the analyzed signal , which is usually calculated based on short time Fourier transform (STFT) as following:
where is the time window with small size. There are the following common characteristics for Eqs. (1) and (2):
The SK value of stationary signal is 0.
The calculation equation of SK is as following under the influence of stationary noise :
where is the noise-to-signal ratio as a function of frequency.
2.2. The fast Kurtogram algorithm for SK based on finite impulse response (FIR)
A fast spectral kurtosis algorithm named as fast Kurtogram is proposed based on FIR bandpass filter by Antoni, its basic principle is to decompose the original signal firstly through alternating binary and ternary decomposition, and calculate the spectral kurtosis value of the decomposed signals using frequency bandpass filters. The specific approach is to choose a suitable high pass filter and low-pass filter as follows:
Filter the original signal using and , and the filtered results are twice down-sampled. The last corresponding filter results containing the optimal center frequency and bandwidth are obtained through repeated iterations. Subsequently, construct several bandpass filters using the obtained optimal center frequencies and bandwidths. Then, the Eq. (5) is used to calculate the SK value of each bandpass filtered signals by using the constructed bandpass filters:
At last, the fast Kurtogram map of the analyzed signal is formed by integrating all the calculated spectral kurtosis, and details of the concrete processes are not presented here, which could be referred to reference [23].
2.3. The proposed method
Flow chart of the proposed method is shown in Fig. 1, which could be mainly divided into the following steps:
Step 1: Apply fast Kurtogram analysis on the collected original vibration signal , and the Kurtogram map is obtained, based on which the optimal filters (including center frequency and bandwidth) are selected automatically based on the set threshold.
Step 2: Filter the original signal using the selected optimal filters separately, then apply envelope analysis on the filtered results respectively and envelope sequences are obtained.
In this step, construct series of bandpass filters using the obtained optimal frequencies and bandwidths in step 1, then filter the original signal and series filtered signals are obtained. Apply envelope analysis on the filtered signals and envelope sequences are obtained.
The Hilbert of the original signal could be calculated as following:
The new complex signal could be expressed by the combination of and , whose express is as following:
The envelope analysis of the could be obtained by using the following equation:
Step 3: Apply Fast Fourier Transform (FFT) on and the envelope demodulation spectrum sequences are obtained.
Step 4: Denoise the envelope sequences and new envelope demodulation spectrum sequences are obtained.
In detail, calculate the maximum amplitude and median of each . Assuming that the amplitude of each frequency in the envelope sequence is , if , let . The denoised new envelope sequences are obtained according to the process.
Step 5: Take the first quarter of the sampling frequency of the new envelope sequences as the search interval, and divide it into sub intervals, then search for the effective fundamental frequency and corresponding harmonic frequency within each sub interval. In this process, the effective harmonic number , harmonic intensity , and harmonic intensity index of each sub interval are calculated.
For the denoised new envelope sequence , taking the th sequence as an example, the search interval of the fundamental frequency is , and sub intervals are equally divided with a length of . Take the frequency with the highest frequency amplitude within each subinterval in the th sequence as the fundamental frequency , and its corresponding harmonic frequencies are 2, 3,…, 20. Define the search interval of harmonic 2 as [2-1.5, 2+1.5], and search for the maximum frequency amplitude within the 2 search interval. If , there are harmonics presents. Otherwise, there will be no harmonics. The method for determining the existence of other harmonic frequencies such as 3 is the same, and the effective number of harmonics , harmonic intensity , and harmonic intensity index for each subinterval in the th sequence are finally calculated.
The calculation equation of harmonic intensity index is as following:
in which , is the biggest frequency amplitude of the th new envelope sequence.
If the number of effective harmonics , output the top frequencies with the highest harmonic intensity index in the th new envelope sequence. Otherwise, output the top frequencies with the highest frequency amplitude in the th sequence.
3. Simulation verification
In this section, simulation is carried out to verify the effectiveness of the proposed method. The rolling bearing fault model as following is used:
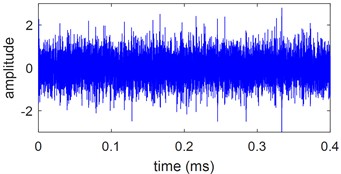
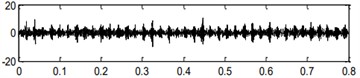
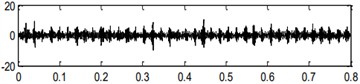
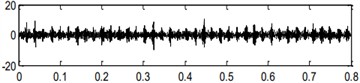
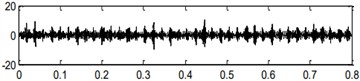
in which is the tiny fluctuation around mean period . Set the sampling frequency as = 25600 Hz, and the shaft rotation frequency is = 24 Hz. Set the inner race fault frequency as = 102 Hz, and = 4000 Hz is the nature frequency of the system. Assume that the random slide between rolling element and the race is normally distributed, whose standard deviation is 0.5 % of the shaft rotation ratio. Add Gaussian noise to the one single point defecting signal and the signal-to-noise ratio is –8 dB. The time waves of the one single point defecting signal and noise added signal are shown in Fig. 2 and Fig. 3 respectively. From Fig. 3, the fault feature of the transient impulse is almost buried by the strong background noise.
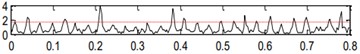
Analyze the noised signal in Fig. 3 using the proposed method described in Fig. 1. Firstly, the fast Kurtogram is applied on the noised signal and the spectral kurtosis map is obtained as shown in Fig. 4, based on which the center frequency and bandwidth corresponding to the first six spectral kurtosis values are selected to construct six bandpass filters, and filter the original signal separately. Then, after a series of Hilbert and spectral analysis, the last denoised envelope demodulation spectral is obtained to extract harmonic features.
Fig. 1Flow chart of the proposed method
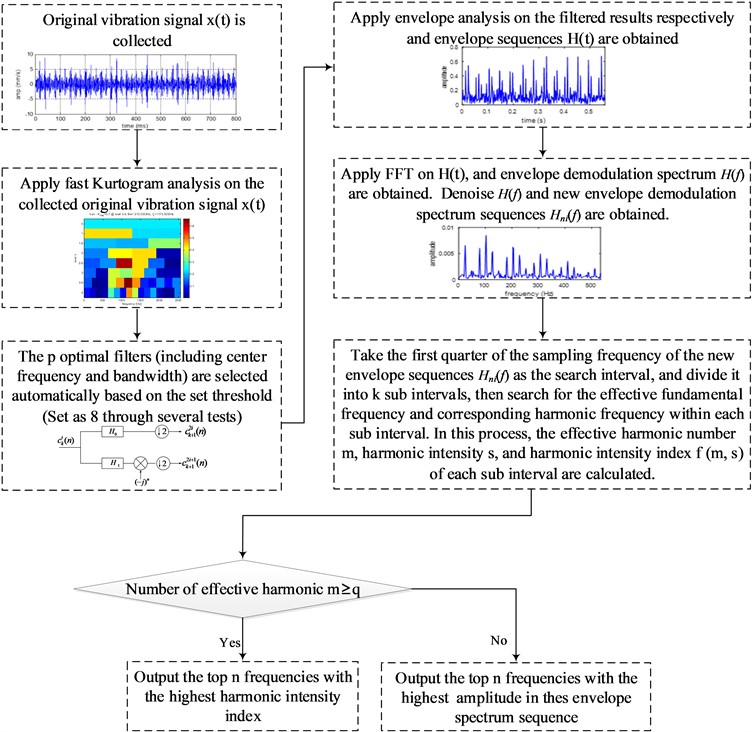
Fig. 2Simulated bearing signal
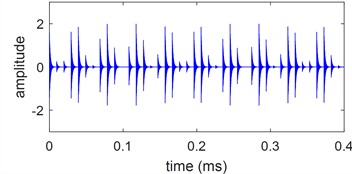
Fig. 3Noised simulation bearing signal
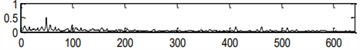
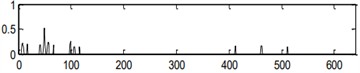
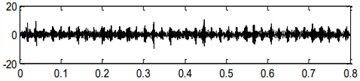
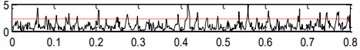
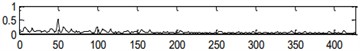
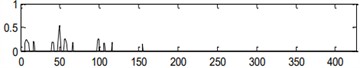
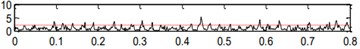
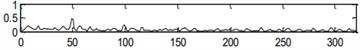
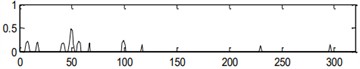
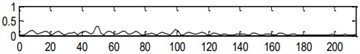
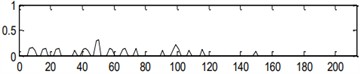
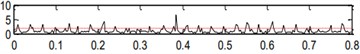
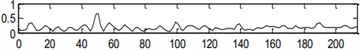
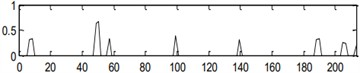
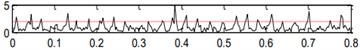
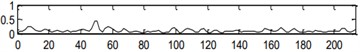
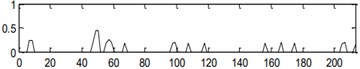
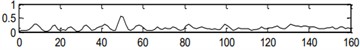
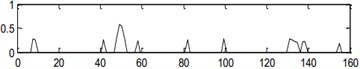
Due to space limitations, the filtering result of the first filter is taken for analysis (kurtosis value of 3.7, center frequency of 4000, bandwidth of 533). The envelope of the corresponding filtered signal is shown in Fig. 5. The obtained envelope spectrum sequence is further denoised to obtain the final envelope spectrum as shown in Fig. 6, based on which it can be seen that the interference of the noised signal is effectively suppressed, and its fault characteristics are more obvious. Take the first quarter of the sampling frequency corresponding to the denoised envelope demodulation spectral as the search interval, and divide it into sub intervals (18) to search for the effective fundamental frequency and the corresponding harmonic features (the effective harmonic number , the harmonic intensity s and the harmonic intensity index ) in each sub interval. If the number of sub intervals with harmonics greater than or equal to is greater than or equal to , and is set to 2 and is set to 9, then the top n frequencies with the highest harmonic intensity index will be output automatically. Otherwise, automatically output the top frequencies with the highest amplitude in the denoised envelope spectrum, with being set as 5 by default. Table 1 shows the automatically extracted harmonic features in the denoised envelope spectrum. Compared to manually searching for the frequency components of modulated signals, it significantly simplifies complexity and improves diagnostic efficiency.
Fig. 4Fast Kurtogram map of the noised simulation bearing signal
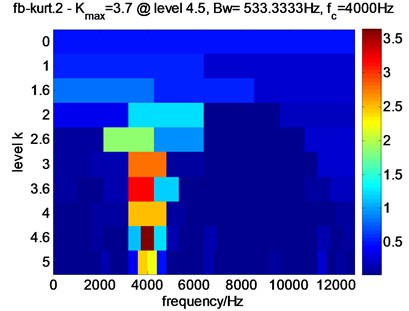
Fig. 5Envelope of the noised simulation bearing signal
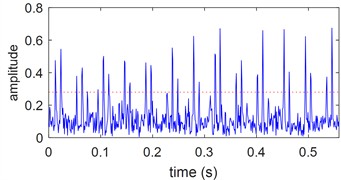
Fig. 6Denoised envelope demodulation spectral of the noised simulation bearing signal
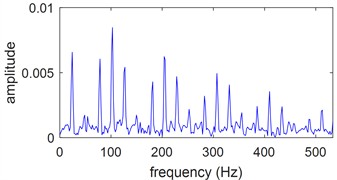
Table 1The extracted harmonic features of the noised simulation signal
Fundamental harmonic | Harmonic intensity index | Harmonic intensity | Harmonic number |
102 | 1.3174 | 0.0087 | 5 |
24 | 0.0423 | 0.0063 | 1 |
78 | 0.0542 | 0.0060 | 1 |
126 52.1 | 0.0936 0.0018 | 0.0052 0.008 | 1 1 |
4. Engineering verification
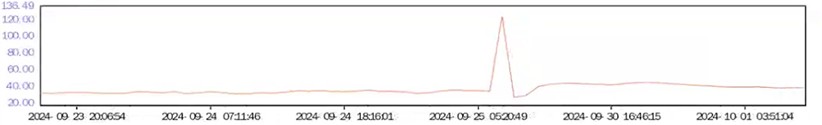
The No. 3 pump of a certain pumping station is a RDL800-740A double support centrifugal pump manufactured by shanghai KSB company, with a rated speed of 600 RPM and a rated power of 1600 kW. Schematic diagram of the analyzed pump is shown in Fig. 7. On September 25. 2024, it was discovered through on-site monitoring system that there was an increasing trend of vibration at the pump drive end, and the system generated vibration amplitude and temperature alarms. The trend charts of the three monitoring indicators are shown in Fig. 8(a) and (b) respectively: on September 25, there were a total of 8 alarms (7 vibration alarms and 1 temperature alarm), with the earliest alarm type being a dimensionless kurtosis value alarm. At 6:58 am on September 25, the vibration starts to rise from 0.5 mm/s and continue to rise until 7:11 am, with a vibration value of 4 mm/s. Afterwards, the vibration value began to decrease. At 7:20, the vibration value dropped and remained stable. At 7:40, the machine stopped on site. After the on-site shutdown, it was discovered that the inner ring of the drive end bearing had malfunctioned. The bearing model is GB6203, and the fault characteristic frequencies are shown in Table 2.
Table 2Parameter list of the monitored bearing
Type | (Hz) | ||||
GB6203 | 10 | 4.6 | 32.1 | 51.9 | 47.8 |
Fig. 7Schematic diagram of the analyzed pump
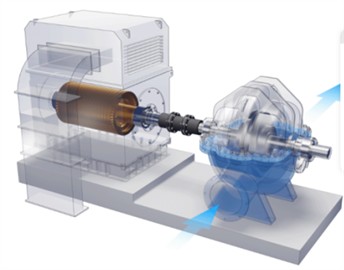
Fig. 8Vibration and temperature trend of the measured point
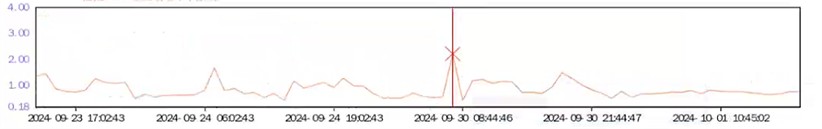
a) Vibration trend of the measured point
b) Temperature trend of the measured point
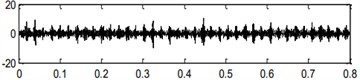
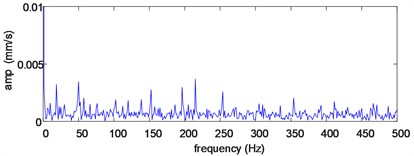
Analyze the data corresponding to the highest alarm amplitude among the 7 vibration alarms, and the corresponding time-domain and frequency-domain graphs are shown in Fig. 9(a) and (b), respectively. The time-domain waveform shown in Fig. 9(a) exhibits impact characteristics, which could preliminarily determine the bearing fault problem at the pump drive end. Although there is inner race fault characteristic frequency of 51.9 Hz and its harmonics in the frequency-domain graph, the amplitude intensity corresponding to the fundamental frequency of 51.9 Hz is not significant. In addition, when an inner race fault occurs in a rolling bearing, a side lobe of 10 Hz (rotational frequency) should also appear near the fault characteristic frequency of 51.9 Hz and its harmonics in the spectrum, which is the modulation component. However, this feature does not appear in the spectrum shown in Fig. 9. The reason for this problem is due to strong background noise caused by vibration of adjacent units on site. Based on this, it is not possible to determine the specific fault location of the bearing.
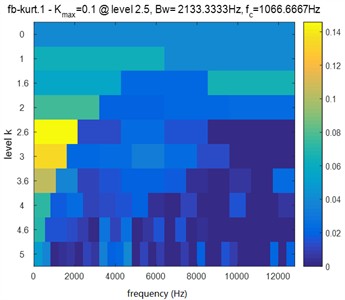
Analyze the original fault signal using the proposed method shown in Fig. 1. Firstly, the fast Kurtogram analysis is conduct on it, and the result is presented in Fig. 10, in which the different colors represent different kurtosis values, with darker colors indicating higher kurtosis values. Based on Fig. 10, it can be seen that the maximum spectral kurtosis occurs at a level of 3.5, with a center frequency of 1173 Hz and a bandwidth of 213. The frequency 1173 Hz corresponds exactly to the position of the maximum spectral peak on the frequency-domain spectrum in Fig. 9.
According to the values of the spectral kurtosis in Fig. 10, the top 8 optimal filters are selected automatically with their center frequency, bandwidth, and corresponding number of layers, as shown in Table 3.
Fig. 9Original signal with its frequency spectrum
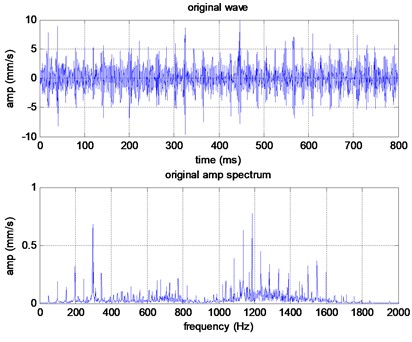
Fig. 10Fast Kurtogram map
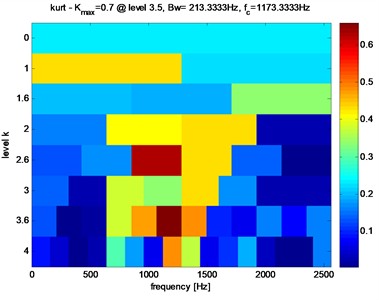
Table 3The center frequency and bandwidth corresponding to each level
NO. | Level | Center frequency / Hz | Bandwidth |
1 | 1 | 640 | 1280 |
2 | 2 | 1600 | 640 |
3 | 2.5 | 1493 | 426 |
4 | 3 | 1440 | 320 |
5 | 3.5 | 960 | 213 |
6 | 3.5 | 1173 | 213 |
7 | 3.5 | 1386 | 213 |
8 | 4 | 1200 | 160 |
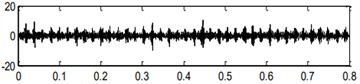
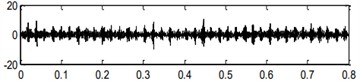
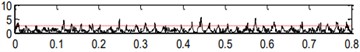
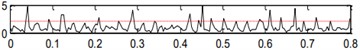
Using the 8 optimal filters to analyze the original signal, the results are shown in Fig. 11-18: a) represents the original signal, b) shows the envelope analysis result of the filtered signal, c) shows the envelope demodulation spectrum of the filtered signal, and d) shows the envelope demodulation spectrum of the denoised envelope sequence in b). According to the steps described in Fig. 1, automatically identify the presence or absence of harmonics in the final denoised envelope spectrum. If the number of effective harmonics is ≥ 2, automatically output the top 5 frequencies with the highest harmonic intensity index. Otherwise, automatically output the top 5 frequencies with the highest frequency amplitudes. From the final envelope demodulation spectra in Fig. 11-18, the amplitude is highest at 50.8 Hz and there are harmonics present, which corresponds to the characteristic frequency of the inner ring fault of the rolling bearing (51.9 Hz). It should be noted that installation errors and random sliding between rolling elements and raceways can cause errors between the actual extracted fault characteristic frequency of 50.8 Hz and the theoretical fault characteristic frequency of 51.9 Hz. Table 4 shows the harmonic characteristics automatically identified based on the proposed method. From the Table 4, it can be seen that the harmonic intensity index with a frequency of 50.8 Hz ranks among the top three in all eight filtering results. In addition, 10 Hz modulation frequency and its harmonic components are also effectively extracted from each filtering result. Effectiveness of the proposed method is verified.
Fig. 11Handled results by the center frequency and bandwidth obtained in level 1
a) Original signal

b) Time domain envelope analysis
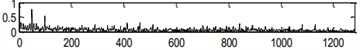
c) Envelope demodulation spectrum
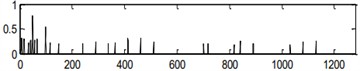
d) Denoised Envelope demodulation spectrum
Fig. 12Handled results by the center frequency and bandwidth obtained in level 2
a) Original signal
b) Time domain envelope analysis
c) Envelope demodulation spectrum
d) Denoised Envelope demodulation spectrum
Fig. 13Handled results by the center frequency and bandwidth obtained in level 2.5
a) Original signal
b) Time domain envelope analysis
c) Envelope demodulation spectrum
d) Denoised Envelope demodulation spectrum
Fig. 14Handled results by the center frequency and bandwidth obtained in level 3
a) Original signal
b) Time domain envelope analysis
c) Envelope demodulation spectrum
d) Denoised Envelope demodulation spectrum
Fig. 15Handled results by the center frequency (960) and bandwidth (213) obtained in level 3.5
a) Original signal
b) Time domain envelope analysis
c) Envelope demodulation spectrum
d) Denoised Envelope demodulation spectrum
Fig. 16Handled results by the center frequency (1173) and bandwidth (213) obtained in level 3.5
a) Original signal
b) Time domain envelope analysis
c) Envelope demodulation spectrum
d) Denoised Envelope demodulation spectrum
Fig. 17Handled results by the center frequency (1386) and bandwidth (213) obtained in level 3.5
a) Original signal
b) Time domain envelope analysis
c) Envelope demodulation spectrum
d) Denoised Envelope demodulation spectrum
Fig. 18Handled results by the center frequency (1200) and bandwidth (160) obtained in level 4
a) Original signal
b) Time domain envelope analysis
c) Envelope demodulation spectrum
d) Denoised Envelope demodulation spectrum
Table 4The extracted harmonic features
Fundamental harmonic | Harmonic intensity index | Harmonic intensity | Harmonic number | The center frequency (Fc) and bandwidth (Bw) of the bandpass filter |
10 | 2.02 | 1.08 | 6 | Fc = 640 Hz, Bw = 1280 |
8.75 | 1.64 | 0.86 | 5 | |
50.8 | 1.56 | 0.95 | 3 | |
33.75 | 1.29 | 0.68 | 4 | |
57.5 | 1.08 | 0.51 | 4 | |
10 | 1.93 | 0.67 | 6 | Fc = 1600 Hz, Bw = 640 |
8.75 | 1.53 | 0.57 | 4 | |
50.8 | 1.31 | 0.56 | 2 | |
57.5 | 0.93 | 0.32 | 3 | |
18.75 | 0.79 | 0.30 | 2 | |
8.33 | 1.93 | 0.70 | 6 | Fc = 1493 Hz, Bw = 426 |
10 | 1.75 | 0.66 | 5 | |
50.8 | 1.31 | 0.59 | 2 | |
6.66 | 1.26 | 0.40 | 5 | |
17.5 | 0.98 | 0.36 | 3 | |
10 | 1.94 | 0.64 | 6 | Fc = 1440 Hz, Bw = 320 |
8.75 | 1.58 | 0.56 | 4 | |
50.8 | 1.31 | 0.53 | 2 | |
57.5 | 0.91 | 0.29 | 3 | |
18.75 | 0.80 | 0.28 | 2 | |
10 | 2.44 | 0.49 | 8 | Fc = 960 Hz, Bw = 213 |
18.33 | 1.73 | 0.31 | 7 | |
26.66 | 1.44 | 0.34 | 3 | |
51.66 | 1.28 | 0.32 | 2 | |
36.66 | 1.13 | 0.22 | 4 | |
10 | 1.75 | 0.89 | 4 | Fc = 1173 Hz, Bw = 213 |
51.66 | 1.26 | 0.70 | 2 | |
10 | 1.91 | 0.62 | 5 | Fc = 1386 Hz, Bw = 213 |
50.9 | 1.30 | 0.49 | 2 | |
58.33 | 1.10 | 0.35 | 3 | |
60 | 0.80 | 0.27 | 2 | |
68.33 | 0.78 | 0.26 | 2 | |
10 | 2.02 | 0.81 | 6 | Fc = 1200 Hz, Bw = 160 |
8.75 | 1.45 | 0.65 | 3 | |
50.8 | 1.30 | 0.62 | 2 |
5. Comparison
Frequency band entropy [24] and autogram [13] are two effective methods to select optimal frequency bands for subsequent envelope demodulation spectrum analysis. To highlight the advantage of the proposed method, the analysis results of the engineering signal shown in Fig. 9 based on frequency band entropy and autogram are presented in Fig. 19 and Fig. 20 respectively.
Fig. 19The analysis results of the signal shown in Fig. 9 based on frequency band entropy analysis
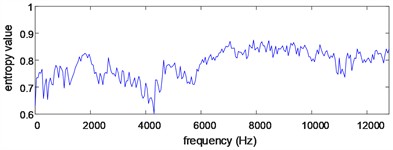
a) The frequency band entropy analysis result of the signal shown in Fig. 9
b) The envelope demodulation spectral of the filtered signal shown in Fig. 9 using the optimal band-pass filter based on frequency band entropy analysis
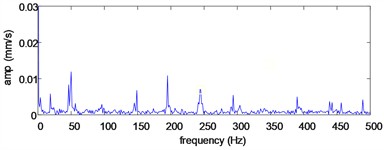
Fig. 20The analysis results of the signal shown in Fig. 9 based on autogram analysis
a) The autogram analysis result of the signal shown in Fig. 9
b) The envelope demodulation spectral of the filtered signal shown in Fig. 9 using the optimal band-pass filter based on autogram analysis
From Fig. 19, it can be seen that although the frequency component of 50.8 Hz and its integer multiples harmonic components could be extracted effectively, the 2X of 50.8 Hz has not been extracted effectively. Based on Fig. 20, the extraction effect of 50.8 Hz and its integer multiples harmonic frequency components is not ideal. Furthermore, in Figs. 19 and 20, it is still necessary to manually judge the harmonics and harmonic intensity based on the final envelope spectrum results, rather than automatically calculating the intensity of harmonic components as the proposed method.
6. Conclusions
The fast Kurtogram is used to determine the optimal filter parameters for filtering the signal to obtain the envelope spectrum first. In order to accurately extract fault feature information, further denoising is performed on the sequences of envelope spectral. Then divide the new envelope spectrum sequence into k sub intervals, calculate the effective harmonic number of the sequence, the harmonic intensity of each sub interval, and the harmonic intensity index. Finally, determine the effective harmonic number of sub intervals, and automatically output the harmonic components of the modulation signal.
The feasibility of this method was demonstrated through one simulation and one engineering case analysis. The research results indicate that:
1) The use of fast Kurtogram can adaptively determine the optimal filter parameters, avoiding the drawback of relying on manual experience to set.
2) This method can accurately and automatically identify the frequency components of modulation signals, providing important fault symptom parameters for intelligent diagnosis of equipment such as bearings. Compared with manual searching for the frequency components of modulated signals, it significantly simplifies complexity and improves diagnostic efficiency.
In future research, we will attempt to apply the relevant research results of the paper to online intelligent diagnosis of rolling bearings or gears.
References
-
Q. Li, Y. Tang, and L. Chu, “Generative adversarial networks for prognostic and health management of industrial systems: A review,” Expert Systems with Applications, Vol. 253, p. 124341, Nov. 2024, https://doi.org/10.1016/j.eswa.2024.124341
-
X. C. Luan and Y. D. Sha, “Technology to extract weak fault characteristic signal of intermediate bearing of some turbofan engine,” Science Technology and Engineering, Vol. 18, No. 13, pp. 167–174, May 2018.
-
R. B. Randall and J. Antoni, “Rolling element bearing diagnostics-A tutorial,” Mechanical Systems and Signal Processing, Vol. 25, No. 2, pp. 485–520, Feb. 2011, https://doi.org/10.1016/j.ymssp.2010.07.017
-
F. K. Wang and B. P. Gao, “Composite fault diagnosis of rolling bearing based on optimized VMD-MCKD and spectral kurtosis,” Machine Tool and Hydraulics, Vol. 52, No. 19, pp. 196–202, Oct. 2024, https://doi.org/10.3969/j.jssn.1001-3881.2024.19.030
-
H. M. Wang, Y. Q. Liu, and Y. Y. Liao, “Fault diagnosis method for rolling bearings based on fast spectral kurtosis and orthogonal matching pursuit algorithm,” Journal of Vibration and Shock, Vol. 39, No. 19, pp. 78–83, Nov. 2020, https://doi.org/10.13645/j.cnki.jvs.2020.19.012
-
X. L. Wang, J. D. Zheng, and H. Y. Pan, “Fault diagnosis method for rolling bearings based on minimum entropy deconvolution and autograms,” Journal of Vibration and Shock, Vol. 39, No. 18, pp. 118–131, Nov. 2020, https://doi.org/10.13645/j.cnki.jvs.2020.18.015
-
W. S. Su et al., “Application of EMD denoising and spectral kurtosis in early fault diagnosis of rolling element bearings,” Journal of Vibration and Shock, Vol. 29, No. 3, pp. 18–22, Jun. 2010, https://doi.org/10.13645/j.cnki.jvs.2010.03.046
-
L. L. Cao et al., “Fault diagnosis of rolling bearing based on EEMD and fast spectral kurtosis,” Journal of Mechanical and Electrical Engineering, Vol. 38, No. 10, pp. 1311–1316, Oct. 2021, https://doi.org/10.3969/j.issn.1001-4551.2021.10.013
-
L. Sun et al., “RUL prediction of rolling bearing based on fusion feature of time domain and spectral kurtosis and exponential model,” Machine Tool and Hydraulics, Vol. 51, No. 10, pp. 203–209, May 2023, https://doi.org/10.3969/j.jssn.1001-3881.2023.10.035
-
T. Barszcz and A. Jabłoński, “A novel method for the optimal band selection for vibration signal demodulation and comparison with the Kurtogram,” Mechanical Systems and Signal Processing, Vol. 25, No. 1, pp. 431–451, Jan. 2011, https://doi.org/10.1016/j.ymssp.2010.05.018
-
P. W. Tse and D. Wang, “The design of a new sparsogram for fast bearing fault diagnosis: Part 1 of the two related manuscripts that have a joint title as “Two automatic vibration-based fault diagnostic methods using the novel sparsity measurement – Parts 1 and 2”,” Mechanical Systems and Signal Processing, Vol. 40, No. 2, pp. 499–519, Nov. 2013, https://doi.org/10.1016/j.ymssp.2013.05.024
-
J. Antoni, “The infogram: Entropic evidence of the signature of repetitive transients,” Mechanical Systems and Signal Processing, Vol. 74, pp. 73–94, Jun. 2016, https://doi.org/10.1016/j.ymssp.2015.04.034
-
A. Moshrefzadeh and A. Fasana, “The Autogram: An effective approach for selecting the optimal demodulation band in rolling element bearings diagnosis,” Mechanical Systems and Signal Processing, Vol. 105, pp. 294–318, May 2018, https://doi.org/10.1016/j.ymssp.2017.12.009
-
W. A. Smith, P. Borghesani, Q. Ni, K. Wang, and Z. Peng, “Optimal demodulation-band selection for envelope-based diagnostics: A comparative study of traditional and novel tools,” Mechanical Systems and Signal Processing, Vol. 134, p. 106303, Dec. 2019, https://doi.org/10.1016/j.ymssp.2019.106303
-
Z. Liu, S. Yang, Y. Liu, J. Lin, and X. Gu, “Adaptive correlated Kurtogram and its applications in wheelset-bearing system fault diagnosis,” Mechanical Systems and Signal Processing, Vol. 154, p. 107511, Jun. 2021, https://doi.org/10.1016/j.ymssp.2020.107511
-
K. Zhang, P. Chen, M. Yang, L. Song, and Y. Xu, “The Harmogram: A periodic impulses detection method and its application in bearing fault diagnosis,” Mechanical Systems and Signal Processing, Vol. 165, p. 108374, Feb. 2022, https://doi.org/10.1016/j.ymssp.2021.108374
-
N. Zhou, Y. Cheng, Z. Wang, B. Chen, and W. Zhang, “CFFsgram: A candidate fault frequencies-based optimal demodulation band selection method for axle-box bearing fault diagnosis,” Measurement, Vol. 207, p. 112368, Feb. 2023, https://doi.org/10.1016/j.measurement.2022.112368
-
W. A. Smith, Z. Fan, Z. Peng, H. Li, and R. B. Randall, “Optimised Spectral Kurtosis for bearing diagnostics under electromagnetic interference,” Mechanical Systems and Signal Processing, Vol. 75, pp. 371–394, Jun. 2016, https://doi.org/10.1016/j.ymssp.2015.12.034
-
Y. Guan, M. Liang, and D.-S. Necsulescu, “Velocity synchronous linear Chirplet transform,” IEEE Transactions on Industrial Electronics, Vol. 66, No. 8, pp. 6270–6280, Aug. 2019, https://doi.org/10.1109/tie.2018.2873520
-
M. Li, T. Wang, F. Chu, Q. Han, Z. Qin, and M. J. Zuo, “Scaling-basis Chirplet transform,” IEEE Transactions on Industrial Electronics, Vol. 68, No. 9, pp. 8777–8788, Sep. 2021, https://doi.org/10.1109/tie.2020.3013537
-
D. Zhang and Z. Feng, “Proportion-extracting Chirplet transform for nonstationary signal analysis of rotating machinery,” IEEE Transactions on Industrial Informatics, Vol. 19, No. 3, pp. 2674–2683, Mar. 2023, https://doi.org/10.1109/tii.2022.3185771
-
T. Li, Q. He, and Z. Peng, “Parameterized resampling time-frequency transform,” IEEE Transactions on Signal Processing, Vol. 70, pp. 5791–5805, Jan. 2022, https://doi.org/10.1109/tsp.2022.3220027
-
J. Antoni, “Fast computation of the kurtogram for the detection of transient faults,” Mechanical Systems and Signal Processing, Vol. 21, No. 1, pp. 108–124, Jan. 2007, https://doi.org/10.1016/j.ymssp.2005.12.002
-
T. Liu, J. Chen, and G. M. Dong, “Rolling element bearing fault diagnosis based on frequency band entropy,” Journal of Vibration and Shock, Vol. 33, No. 1, Jun. 2014, https://doi.org/10.13465/j.cnki.jvs.2014.01.015
About this article

The research is supported by the Program of Henan Province’s New Key Discipline Machinery (No. 0203240011), Zhengzhou Key Laboratory of Fiber Reinforced Polymer Matrix Composites (No. 02032146), and Intelligent Manufacturing Industry College (yysfzd2301).
The datasets generated during and/or analyzed during the current study are available from the corresponding author on reasonable request.
Zhiguo Ma: concept and writing of the entire paper. Chaozhong Liu: algorithm implementation. Huijuan Guo: simulation and engineering data analysis.
The authors declare that they have no conflict of interest.
