Abstract
Double-head machine tool has the advantages of high efficiency and high degree of automation. In order to reduce the weight of double-head machine tool and improve the stiffness of the entire machine. An optimization design method combining topology optimization, sensitivity analysis and adaptive multi-objective method is used. Firstly, simplify the model in SolidWorks and import it into ANSYS Workbench software to carry out finite element analysis on the entire double-head machine tool to find out the weak component as the beam. Afterwards, carry out topological optimization on the beam and redesign the beam structure, and complete the first optimization. Then, through sensitivity analysis of the input parameters, key parameters that significantly impact the objective function are identified. Subsequently, a multi-objective optimization function is constructed for these key parameters and the objective function. Finally, an adaptive multi-objective method is used to solve the problem and obtain a Pareto optimal solution set, completing the second optimization. The results show that the weight of the beam is reduced by 8.88 %, the deformation of the beam is reduced by 11.29 %, and the equivalent stress of the entire machine is reduced by 28.33 %. This design not only yields significant economic benefits but also serves as a valuable reference for the lightweight design of large machine tool crossbeams.
Highlights
- An optimization design method combining topology optimization, sensitivity analysis and adaptive multi-objective method is used.
- Compared to the original beam design, the optimized beam not only reduces costs but also generates significant economic benefits.
- The enhancements, which are based on an I-beam structure, offer valuable design insights and effective optimization solutions for achieving lightweight designs in large-span machine tool beams.
1. Introduction
The manufacturing industry is the backbone of the national economy, the foundation of a country, the tool for its prosperity, and the basis for its strength. As “The Mother of the Machine”, The CNC machine tools are applied in critical fields such as aerospace and engineering machinery. The optimized dual-head machine tool in this article is one of the main products of a stone-cutting enterprise. Compared to ordinary machine tools, dual-head machine tools have higher efficiency and occupy less floor space than two ordinary machine tools. However, the load-bearing capacity of the beam is a key research focus for optimization design scholars, especially regarding the load-bearing capacity and stability issues of different machine heads. Therefore, achieving the highest performance of the beam at the lowest cost has become one of the important aspects of research in intelligent manufacturing. To this end, many scholars have studied the structure optimization of machine tools. Zhang Guohui et al. [1] proposed a method based on sensitivity analysis and center combination design to optimize the beam structure. The optimization results show that the mass is reduced by 3.11 %, the total deformation is reduced by 6.87 %, and the first order natural frequency is increased by 2.56 %. Hu Shijun et al. [2] carried out the lightweight design of the beam of the gantry machining center based on topology optimization and X-type slab, and the results showed that the first six natural frequencies were improved to different degrees while the mass was reduced by 2.1 %. Feng Haibing et al. [3] constructed a mathematical model of topology optimization under multiple working conditions to obtain the optimal distribution of beam plate reinforcement and then used NSGA-II genetic algorithm for multi-objective dimension optimization. While the weight of the beam was reduced, the stiffness and strength were increased by 10.15 % and 20.25 % respectively. Zhao L. et al. [4] extracted the best structural features of giant water lily leaf ribs and cactus stems and applied them to the simulation design of the beam of the giman machining center. The results showed that the weight of the bionic model was reduced by 3.31% and the deformation was reduced by 16.22 %. Qiu Xuehe et al. [5] designed an orthogonal test with three factors and four levels, used the grey correlation method and the combined weighting method to process the finite element analysis data, and obtained the optimal parameter combination. The results showed that the mass was reduced by 466 kg, and the total deformation was reduced by 7.36 %. Li X. et al. [6] changed the X-type structure of the element in the beam into an O-type structure and used the neural network algorithm and the non-dominated sorting genetic algorithm to optimize, and the optimized structure weight and deformation were reduced by 7.45 % and 3.08 % respectively. Zhang Ning [7] optimized the topology of the key components of the precision horizontal machining center based on TOSCA software and realized the lightweight design under the premise of maintaining the performance as far as possible. The structural weight of the main component slide was reduced by 6.5 % and the column weight was reduced by 9.1 % before and after optimization. Besharati S. et al. [8] adopted analytic hierarchy process (AHP) combined with multi-objective genetic algorithm (MOGA) to design gantry machine tool and adopted multi-criteria decision-making method to realize the design of lightweight configuration of machine tool. Li Congbo et al. [9] comprehensively considered the energy consumption, static and dynamic performance of machine tools, and combined simulated annealing and particle swarm optimization algorithm to reduce the energy consumption of the optimized structure while ensuring the static and dynamic performance, and also realized the lightweight design of the structure.
The research objects of the above scholars are mostly the optimization of the key structure of the machine tool with a single head, and few scholars have studied the optimization of the key components of the double head machine tool. With the proposal of lightweight design, CNC machine tools with lightweight design not only reduce the dead weight, but also improve the performance of machine tools, which is more in line with green manufacturing.[10] Therefore, this paper first uses ANSYS Workbench to analyze the static and dynamic characteristics of the model, and obtains the optimization design space of the beam according to the simulation results. Then the topology optimization of the beam is carried out and the beam structure is redesigned according to the simulation results. Then the adaptive multi-objective method is used to optimize the design of the beam. The results of the two optimization results reduce the weight and improve the performance of the entire machine.
The rest of this paper is organized as follows. Section 2 uses the analysis of Workbech static and dynamic characteristics to conclude that the key component of the two-head machine tool is the beam. In Section 3, the topology optimization of the beam and the redesign of the beam structure are carried out. Section 4 uses sensitivity analysis combined with adaptive multi-objective method to optimize the beam, and finally draws the conclusion of Section 5.
2. Analysis of static and dynamic characteristics
2.1. Software and devices
Experimental environment configuration for this article: Using SolidWorks 2020 software and ANSYS Workbench 2020 R2 software, running on a Windows 11 64 bit operating system, with a 13th Gen Intel (R) Core (TM) i9-13900 2GHz processor, the GPU is NVIDIA GeForce PTX3060, and a computer running memory of 32GB.
2.2. Establishment of 3D models
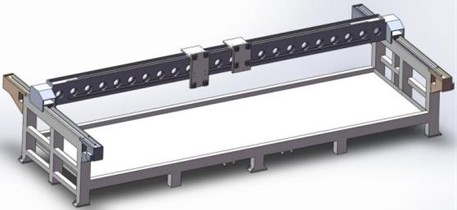
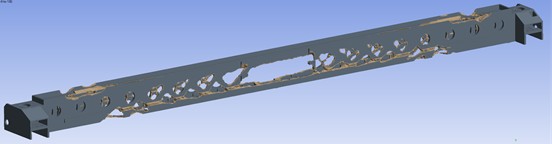
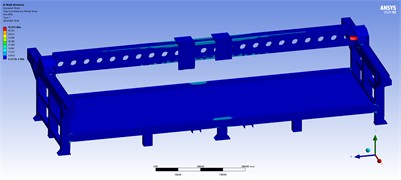
One head of the original double-head machine tool is a saw blade sucker assembly, and the other head is a machining center. It is properly simplified in SolidWorks software to delete unimportant parts, round holes, threads and chamfers [11]. In order to reduce the calculation time, two heads and the traveling frame for assembling the head are deleted. The simplified model is shown in Fig. 1.
Fig. 1Simplified model of the entire Double-head machine tool
2.3. Establishment of finite element model
The simplified 3D model of the two-head machine tool is connected to the ANSYS Workbench software. First, set the material of each part as shown in Table 1, and set the contact relationships between the parts. For the guide rail and slider, use No Separation (the contact surface between the parts can move but not separate), and for other parts, use Bonded (the contact surface between the parts is fixed). For the part of the machine bed that contacts the ground, use a fixed geometric shape to connect it to the ground [12].
Table 1Material parameters and applications
Material | Density (kg/m-3) | Young’s modulus (Pa) | Poisson’s ratio | Application |
HT200 | 7000 | 1.2E11 | 0.28 | Beam |
Q235 | 7850 | 2.1E11 | 0.3 | Base, travel frame, Crossbeam fixing plate |
Stainless steel | 7850 | 2E11 | 0.3 | Track and Slider |
Next, the grid division mode and size of each part are set. The simplified guide rail slider has a regular shape, and 10 mm hexahedral mesh is used for the slider and guide rail, and 10 mm tetrahedral mesh is used for the two marching frames. The shape of the base and the beam of the machine tool is complex, and the tetrahedral mesh of 50 mm is used for the base and 30 mm for the beam, and the rest is automatically meshed, and the mesh of the load attachment is encrypted. Finally, 1041697 nodes and 544,422 cells were generated. The standard earth gravity is set for the entire machine tool, and the 16 positioning holes and bolt holes on the base of the machine tool are fixed support constraints. The head weight of 1552.3 N is applied to the slider on the moving frame of the machining center, and the head weight of 2559.2 N is applied to the slider on the moving frame of the saw blade.
2.4. Static simulation and modal simulation
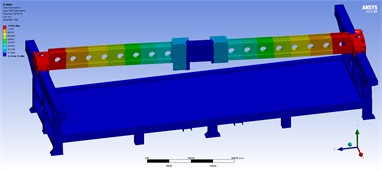
The close distance between the two spindle heads is to simulate the working condition when the load of the two spindle head is in the middle of the beam in the limit working condition. The vertical deformation cloud diagram and stress cloud diagram of the entire machine are shown in Fig. 2. According to the simulation results, due to the large span of the beam and the load of the two machine heads, the maximum stress is at the beam, and the maximum deformation is located in the middle of the beam. The maximum vertical deformation of the entire machine is 1.7956 mm, and the maximum vertical deformation of the beam is 1.7864 mm.
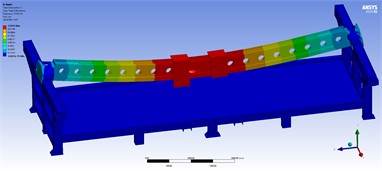
The entire machine undergoes fully constrained modal analysis, as illustrated in Fig. 3. The first natural frequency reveals that the crossbeam rotates around the Y-axis, the second indicates that the crossbeam experiences a vertical downward force on the Y-axis, and the third demonstrates that the crossbeam swings around the X-axis. Consequently, it is evident that the greatest deformation in the modal analysis occurs at the crossbeam. By combining the simulation results from both the static analysis and modal analysis of the entire machine, it is clear that the crossbeam is a crucial component, offering potential for design optimization.
Fig. 2Static characteristic diagram of two-head machine tool
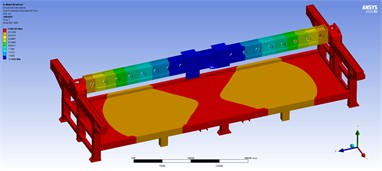
a) Vertical deformation cloud diagram
b) Equivalent stress cloud diagram
Fig. 3Dynamic characteristic diagram of two-head machine tool
a) First-order frequency diagram
b) Second-order frequency diagram
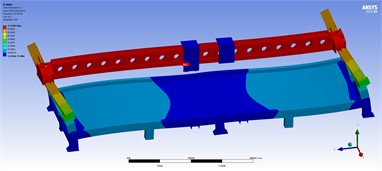
c) Third-order frequency diagram
3. Beam topology optimization based on SIMP model variable density method
3.1. SIMP variable density method
The variable density method is to assume that the density of the material is variable, and then the element density is used as the design variable, so that the topology optimization problem is transformed into the material optimization problem, and some algorithms are used to solve the problem to achieve the optimal distribution of materials [13]. In the field of topology optimization based on variable density method, SIMP interpolation model and RAMP interpolation model are widely used. Among them, SIMP interpolation model has a slightly better penalty effect on intermediate density than RAMP interpolation model [14]. The SIMP interpolation method introduces continuous variable x, coefficient α and intermediate density unit into the discrete model in 0-1, so as to transform the discrete optimization problem into a continuous optimization problem [15]:
where, Ei is the elastic modulus of element i, xi is the pseudo-density of the structural element, α is the correction factor, E0 is the elastic modulus of the structure, and Emin is the elastic modulus of the deleted material element. Therefore, the mathematical model of variable density method based on SIMP can be expressed as [16]:
where, k0 is the stiffness matrix of the element with material density 1, ui is the displacement column vector of the material element, xi is the relative density of the material element, vi is the relative volume of the material element, and xmin is the minimum material element density, which is usually taken as 0.001.
3.2. Topology optimization design of the beam
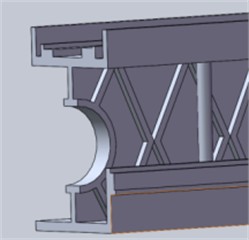
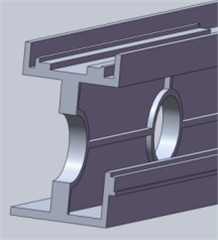
The original cross section of the beam is shown in Fig. 4. As the previous analysis shows, the deformation of the beam is the largest in the static characteristic analysis of the entire machine, so the beam is simulated separately, the fixed constraint is set at both ends of the beam, the simulated beam is fixed on the slider of the base, and the tetrahedral mesh of 20 mm is used to divide the beam, and the weight of the machining center marching frame head and the saw blade marching frame head are applied to the beam. Import the beam into the topology optimization module of Workbench for material redistribution, select density-based topology optimization as the optimization type, and retain 70 % of the original weight. The topology optimization results are shown in Fig. 5.
Fig. 4Cross section of the original beam
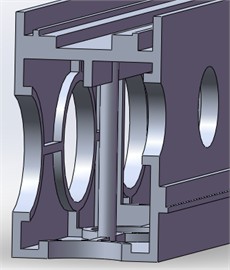
Fig. 5Optimization of the beam topology
The beam shown in the simulation result of topology optimization is difficult to be used directly, and this is in the limit working condition. The topology optimization result will change in the ordinary working condition, so the result is only used for reference. Because the beam is mainly subjected to vertical load, the beam is redesigned. Under the vertical load generated by the two spindle heads, the I-beam experiences compressive force along the upper flange and tensile force along the lower flange, while the central web plate remains largely unaffected. Leveraging their superior vertical compressive performance, six different beam structures were developed based on the I-beam concept, as depicted in Fig. 6.
Fig. 6Different sections of the beams
a) “Multiple X stiffener + single cylinder” beams
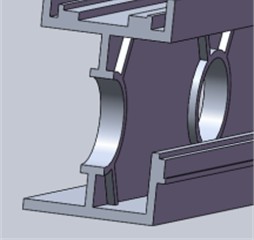
b) “X stiffener” beams
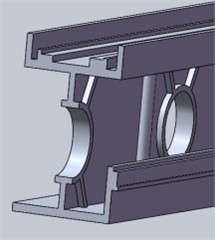
c) “X stiffener + single cylinder” beams
d) “Cross stiffener” beams
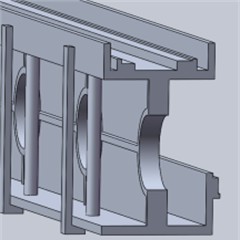
e) “Cross stiffener + single cylinder” beams
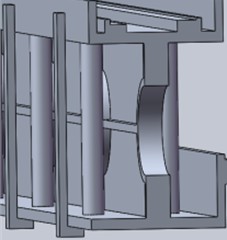
f) “Cross stiffener + double cylinder” beams
3.3. Static and mechanical analysis of six types of I-beam
Six different sections of I-beam were connected to the Workbench, and the static analysis module was used to conduct static simulation analysis with the same Settings as the original beam. The weight and maximum deformation of the seven types of beam were shown in Table 2. The static simulation results show that the weight and maximum deformation of “Cross stiffener”, “X stiffener” and “Cross stiffener + single cylinder” beams are required for this optimization design.
The above three kinds of beams were simulated for the static characteristics of the entire machine respectively, and the simulation results of the entire machine were not satisfactory. According to the comparison between the three simulation results and the original version, the beam surface that should be equipped with the guide rail on the front side was found to be complete, so as to realize the uniform force of the guide rail in front of the beam. Therefore, the section diagram of the new version of the I-beam was designed by combining the first six kinds of beams, as shown in Fig. 7. The static characteristics of the original beam and the redesigned beam after topology optimization are analyzed, and the comparison results are shown in Table 3. The weight and deformation of the new version of the beam are reduced to a certain extent.
Table 2Comparison table of seven kinds of beam weight and deformation
Cross beam section | Weight (kg) | Maximum deformation (mm) |
Original edition | 1345.2 | 0.99686 |
Cross stiffener | 1156.81 | 0.94034 |
X stiffener | 1143.45 | 0.94306 |
X stiffener + single cylinder | 1181.28 | 0.9506 |
Multiple X stiffener + single cylinder | 1226.43 | 0.96045 |
Cross stiffener + single cylinder | 1200.16 | 0.9263 |
Cross stiffener + double cylinder | 1248.8 | 0.93704 |
Table 3Performance comparison between the original beam and the new version
Name | Original edition | First optimization | Change percentage (%) |
Beam weight (kg) | 1346.2 | 1243.6 | –7.62 |
Maximum vertical deformation of the crossbeam (mm) | 1.7864 | 1.5858 | –11.23 |
Maximum vertical deformation of the entire machine (mm) | 1.7956 | 1.5993 | –10.93 |
Maximum stress of the entire machine (MPa) | 71.099 | 68.139 | –4.16 |
4. Beam optimization design based on the adaptive multi-objective method
4.1. Design variables
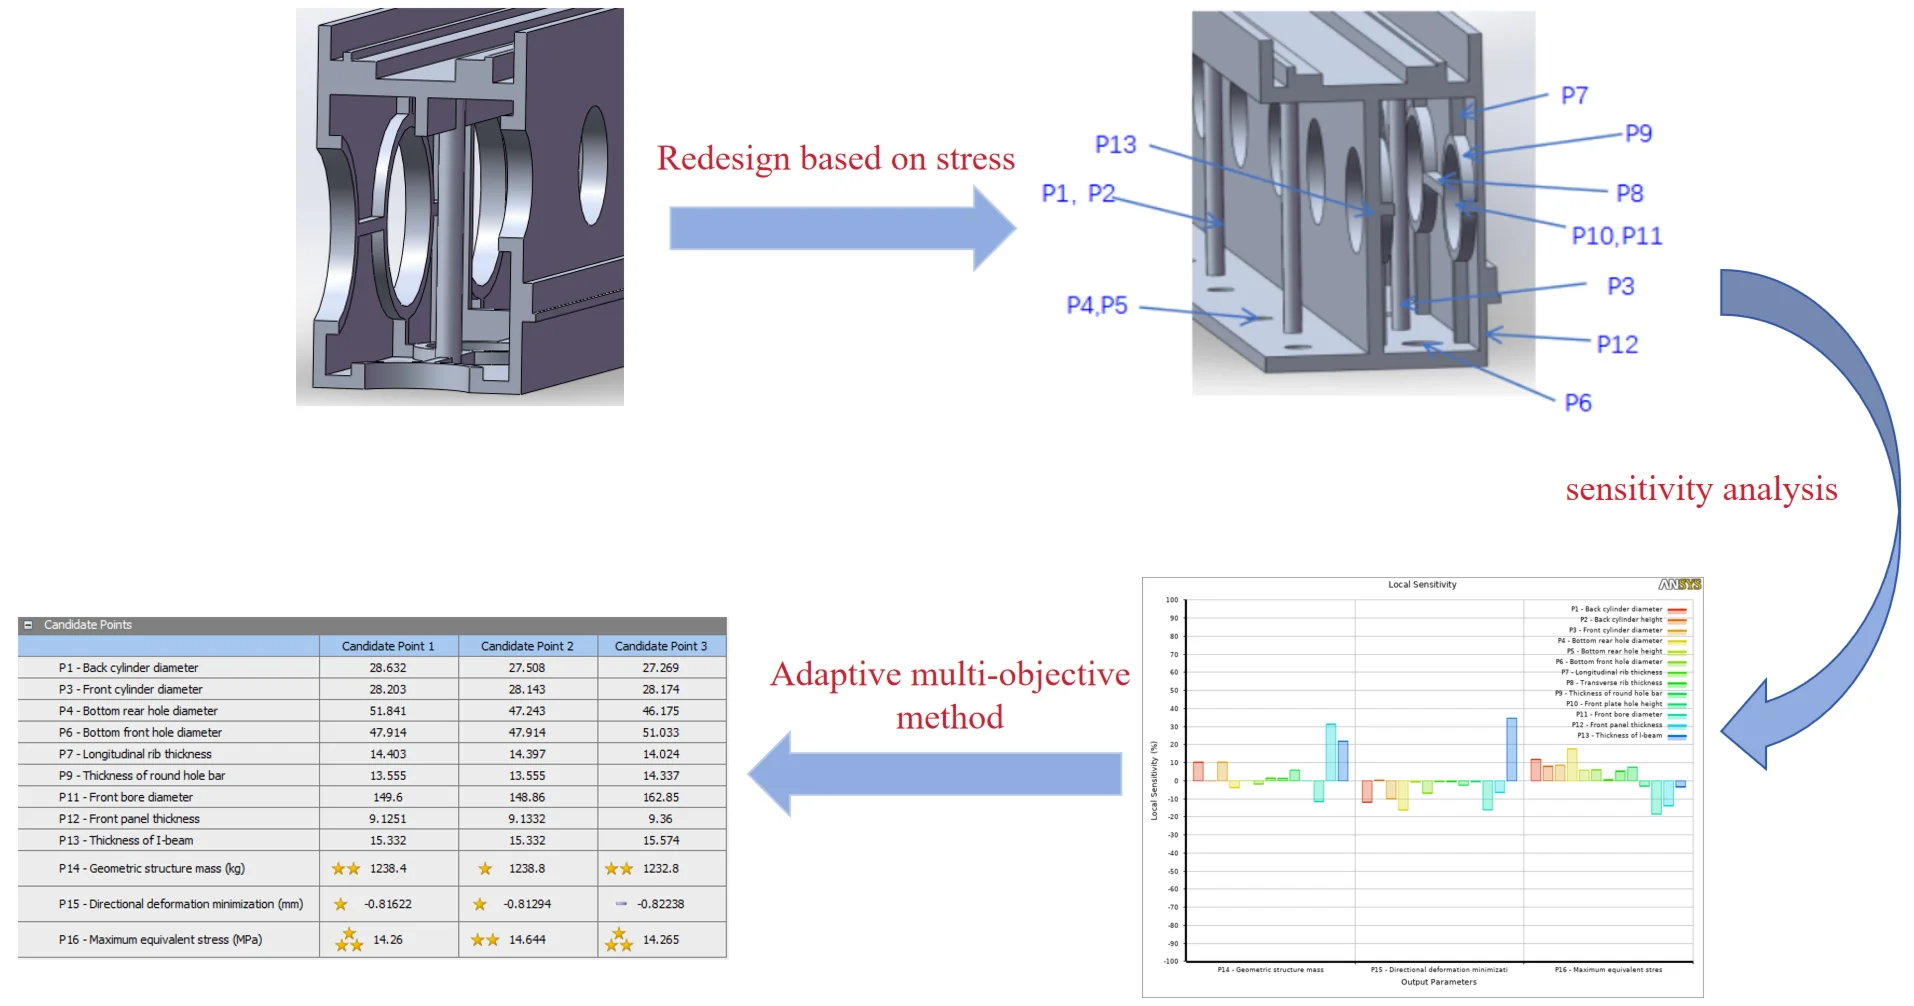
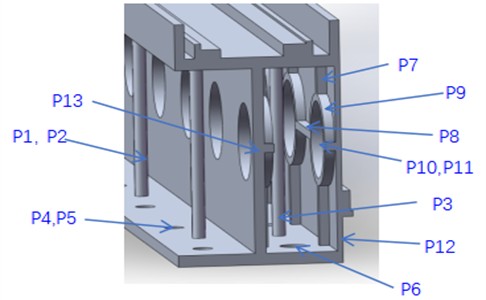
Keep the position of the original beam installation motor, slide rail, rack and bolt hole matched with the base. Select 13 parameters that have a great impact on the performance of the beam in Fig. 7. The specific selected position, size, upper and lower limits are shown in Table 4.
Fig. 7New version of the beam section and design variables
4.2. Sensitivity analysis
Sensitivity analysis reflects the sensitivity of design variables or parameter changes to the objective function. In mathematics, sensitivity analysis is interpreted as: if the objective function is derivable, the first-order sensitivity of the function is expressed as in a continuous system [17]:
The above formula is called the first-order differential sensitivity formula, where F(x) is the performance function in the finite element simulation such as static deformation, weight, equivalent stress, etc., and xi is the design variable parameter such as each key size.
Table 4Range of design variables (unit: mm)
Variables | Position | Initial value | Range of value |
P1, P2 | Diameter of the rear cylinder and the distance from the cylinder to the middle | 30 and 50 | [20, 40] [45, 55] |
P3 | Diameter of front cylinder | 30 | [20, 40] |
P4, P5 | Diameter of bottom back hole and hole to middle distance | 50 and 60 | [30, 70] [50, 70] |
P6 | Diameter of front hole of bottom plate | 50 | [40, 60] |
P7 | Longitudinal slab thickness | 15 | [12, 18] |
P8 | Transverse slab thickness | 15 | [12, 18] |
P9 | Thickness of hole plate | 15 | [12, 18] |
P10, P11 | Front hole to middle distance and diameter of front hole | 20 and 150 | [20, 25] [135, 165] |
P12 | Front plate thickness | 10 | [7, 13] |
P13 | I beam thickness | 15 | [13, 17] |
The solving efficiency of multi-objective optimization mathematical model is related to the number of parameters. It is usually necessary to evaluate the influence degree of different parameters on the optimization objective and eliminate the parameters with small impact, so as to improve the computational efficiency of the optimization process [18]. In this paper, the optimal space-filling design was used to generate 274 groups of experimental groups, and the influence degree of 13 design variables on the three objective functions was obtained after calculation. Fig. 8 is the bar chart of sensitivity analysis.
Fig. 8Bar chart of sensitivity analysis
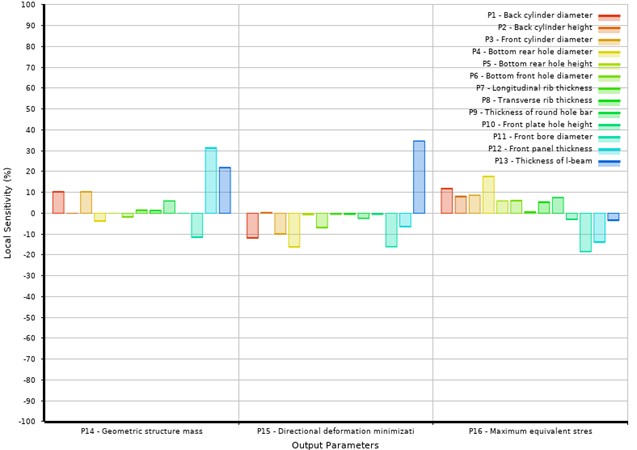
It can be seen from the Fig. 8 that the parameters P1, P3, P9, P11, P12 and P13 have a great influence on the weight, and P11 is negatively correlated, while the rest are positively correlated. The parameters P1, P3, P4, P11, P12, P13 have a great influence on the deformation, and P13 is positive correlation, and the rest are negative correlation. The parameters P1, P3, P4, P11 and P12 have a great influence on the equivalent effect, and P1, P3 and P4 are positively correlated, while the rest are negatively correlated. P2, P5, P8 and P10 will be eliminated in the subsequent design process, and the remaining 9 design variables will be retained to participate in the subsequent multi-objective optimization of the beam, so as to improve the calculation efficiency.
4.3. Adaptive multi-objective optimization
Multi-objective optimization problem refers to the optimization process of the optimization objective is not single, and in general, there are contradictions between each objective function, so the solution is to find a “satisfactory solution”, rather than the “optimal solution”, the solution of multi-objective optimization problem is more than one, but a set of solutions, this set of solutions is called Pareto solution set [19].
Taking the minimum weight, minimum deformation and minimum equivalent stress of the beam as the optimization objective, taking the weight, maximum deformation and maximum equivalent stress of the beam as the constraint conditions, and taking the 9 dimensional parameters of the beam as the design variables, the multi-objective optimization mathematical model is established, which can be expressed as follows:
where x1,x2,···,xn is the combination of design variables, F1, F2 and F3 represent the three objective functions of minimum beam weight, minimum beam deformation and minimum beam equivalent stress respectively, f1, f2 and f3 represent the three constraints of beam weight, beam deformation and beam equivalent stress respectively, S1, S2 and S3 are the constraint values, and a1,a2,···,an represents the lower limit of the design variable value. b1,b2,···,bn represents the upper limit of the value of the design variables, and the range of the upper and lower limits is shown in Table 2. The value of n is 9, which represents nine design variables.
Compared with the traditional GA, NSGA-II introduces a fast non-dominated sorting method, an elitist maintenance strategy, and an efficient crowding distance estimation process. These steps significantly improve the convergence rate of the iterative process, reduce the computational complexity of the algorithm, and effectively ensure the diversity of the population [20]. The adaptive multi-objective approach is a variant of the popular NSGA-II, Non-dominated Sorting Genetic Algorithm II, based on the controlled elite concept. It supports multiple objectives and constraints to find the global optimal solution in an adaptive loop iteration. In this paper, 78 samples are initially generated, 78 samples are generated in each iteration, and three candidate samples are found in a maximum of seven iterations.
4.4. Optimization calculation results and analysis
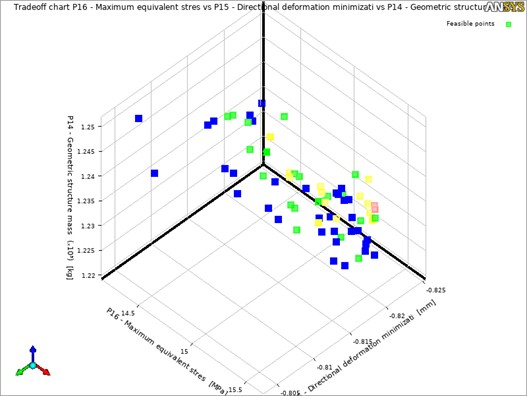
The 3D diagram illustrating the trade-off among geometric mass, equivalent stress, and maximum deformation of the crossbeam is presented in Fig. 9. It displays the Pareto front across all four stages. The optimization points shift from blue to green, then from green to yellow, and ultimately to red, indicating the convergence of the optimal solutions for the three objective functions.
Fig. 9Trade-off diagram for multi-objective optimization of beams
After the adaptive multi-objective method is used to calculate, three groups of better solutions are obtained as shown in Fig. 10. According to the comparison of the three groups, the weight is in the state of optimal solution under the premise of satisfying the appropriate deformation amount and equivalent stress. Therefore, the third group is selected as the “satisfactory solution”, that is, the Pareto solution.
Fig. 10Optimization design candidate solution set diagram
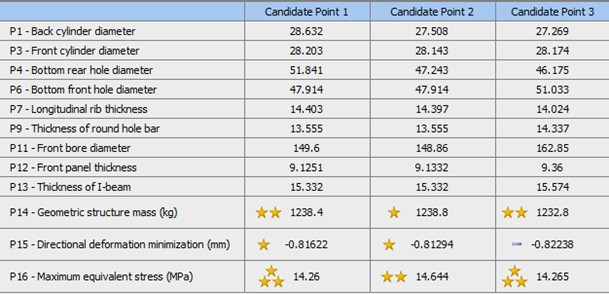
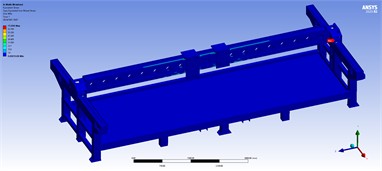
Because the data of the optimized Pareto solution set have decimal points, the optimized data are corrected, the corrected values are shown in Table 5, and changed into the parameters of the beam. The static simulation of the entire machine is carried out according to the same boundary conditions and grid division, and the results are shown in Fig. 11. The stiffness and strength of the beam are improved. Table 6 shows the comparison of performance parameters before and after optimization and the original beam.
By comparing the static characteristics of the beam before and after optimization, it can be seen that the weight of the beam is reduced by 8.88 %, the vertical deformation of the beam in the entire machine simulation is reduced by 11.29 %, and the equivalent stress of the entire machine is reduced by 28.33 % under the condition that the assembly parts are unchanged.
Table 5Optimization parameter table (unit: mm)
Variables | Original parameter | Optimization parameters | Correcting parameters |
P1 | 30 | 27.269 | 27 |
P3 | 30 | 28.174 | 28 |
P4 | 50 | 46.175 | 46 |
P6 | 50 | 51.033 | 51 |
P7 | 15 | 14.024 | 14 |
P9 | 15 | 14.337 | 14.5 |
P11 | 150 | 162.85 | 163 |
P12 | 10 | 9.36 | 9.5 |
P13 | 15 | 15.574 | 15.5 |
Table 6Performance comparison before and after optimization
Name | Original version | First optimization | Second optimization | Percent change (%) |
Beam weight (kg) | 1346.2 | 1243.6 | 1226.6 | –8.88 |
Maximum vertical deformation of beam (mm) | 1.7864 | 1.5858 | 1.5847 | –11.29 |
Maximum vertical deformation of the entire machine (mm) | 1.7956 | 1.5993 | 1.6018 | –10.79 |
Maximum stress of the entire machine | 71.099 | 68.139 | 50.954 | –28.33 |
Fig. 11Static characteristic diagram of optimized two-head machine tool
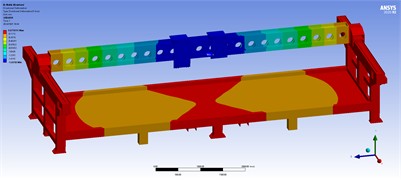
a) Vertical deformation cloud diagram
b) Equivalent stress cloud diagram
5. Conclusions
In this paper, a design method combining topology optimization, sensitivity analysis and adaptive multi-objective approach is used. The topology optimization of the beam of the double-head machine tool is carried out and the beam structure is redesigned to complete the first optimization. The second optimization is completed by using the adaptive multi-objective method after the sensitivity analysis of the new version of the beam. Following two rounds of optimization, the weight of the crossbeam was significantly reduced while its strength and stiffness were enhanced. Compared to the original beam design, the optimized beam not only reduces costs but also generates significant economic benefits. The enhancements, which are based on an I-beam structure, offer valuable design insights and effective optimization solutions for achieving lightweight designs in large-span machine tool beams.
Aiming at the structural optimization problem of double-head machine tool beam, the modal analysis and other aspects are not considered, and the dynamic characteristics need to be improved in the future.
References
-
G. Zhang et al., “Analysis and optimization of static and dynamic characteristics of horizontal beam of CNC gantry milling machine,” Modern Manufacturing Engineering, Vol. 2021, No. 3, pp. 146–151, 2021, https://doi.org/10.16731/j.cnki.1671-3133.2021.03.023
-
S. Hu and H. Gu, “Lightweight design of beam based on finite element analysis of machine tool,” Modular Machine Tool and Automatic Manufacturing Technology, Vol. 2020, No. 11, pp. 139–143, 2020, https://doi.org/10.13462/j.cnki.mmtamt.2020.11.033
-
H.-B. Feng, D.-Z. Song, F.-H. Wu, and Z.-L. Jin, “Design of beam with high stiffness and light weight for long-span gantry woodworking machine tool,” Manufacturing Technology and Machine Tool, Vol. 2021, No. 8, pp. 127–131, 2021, https://doi.org/10.19287/j.cnki.1005-2402.2021.08.010
-
L. Zhao, J. Ma, W. Chen, and H. Guo, “Lightweight design and verification of gantry machining center crossbeam based on structural bionics,” Journal of Bionic Engineering, Vol. 8, No. 2, pp. 201–206, Jun. 2011, https://doi.org/10.1016/s1672-6529(11)60021-8
-
Z. Qiu et al., “Optimization design of machine tool beam based on orthogonal test, combined weighting and grey correlation,” Journal of Vibration and Shock, Vol. 36, No. 12, pp. 105–111, 2017, https://doi.org/10.13465/j.cnki.jvs.2017.12.018
-
X. Li, C. Li, P. Li, H. Hu, and X. Sui, “Structural design and optimization of the crossbeam of a computer numerical controlled milling-machine tool using sensitivity theory and NSGA-II algorithm,” International Journal of Precision Engineering and Manufacturing, Vol. 22, No. 2, pp. 287–300, Jan. 2021, https://doi.org/10.1007/s12541-020-00435-4
-
N. Zhang, “Topology optimization method of key large parts in precision horizontal machining center based on TOSCA,” Tianjin University, Tianjin, 2015.
-
S. Besharati et al., “Multi-objective selection and structural optimization of the gantry in a gantry machine tool for improving static, dynamic, and weight and cost performance,” Concurrent Engineering, Vol. 24, No. 1, pp. 83–93, 2016.
-
Q. Ji, C. Li, D. Zhu, Y. Jin, Y. Lv, and J. He, “Structural design optimization of moving component in CNC machine tool for energy saving,” Journal of Cleaner Production, Vol. 246, p. 118976, Feb. 2020, https://doi.org/10.1016/j.jclepro.2019.118976
-
S. Zhang, B. Liu, and Y. Fang, “Research progress on lightweight technology of CNC machine tools,” Aeronautical Manufacturing Technology, Vol. 63, No. 14, pp. 14–22, 2020, https://doi.org/10.16080/j.issn1671-833x.2020.14.014
-
Y. Li, P. Sun, and J. Pang, “Finite element modal analysis and test of combine chassis,” Transactions of the Chinese Society of Agricultural Engineering, Vol. 29, No. 3, pp. 38–46, 2013.
-
W. Guo, “Static and dynamic characteristics analysis and structural optimization design of machine tool based on finite element,” Shenyang University of Technology, Shenyang, 2018.
-
G. G. Wang and Z. Dong, “Design optimization of a complex mechanical system using adaptive response surface method,” Transactions of the Canadian Society for Mechanical Engineering, Vol. 24, pp. 295–306, 2000.
-
Z. Luo et al., “Topology optimization design of continuum structures,” Advances in Mechanics, Vol. 2004, No. 4, pp. 463–476, 2004.
-
H. Jiao et al., “Periodic topology optimization based on variable density method,” Journal of Mechanical Engineering, Vol. 49, No. 13, pp. 132–138, 2013.
-
Y. Yin, “Topology optimization of continuum structure based on variable density method,” Northeastern University, Shenyang, 2014.
-
C. Zhe et al., “Pitting damage levels estimation for planetary gear sets based on model simulation and grey relational analysis,” Transactions of the Canadian Society for Mechanical Engineering, Vol. 35, No. 3, pp. 403–417, 2011.
-
Z. Li et al., “Optimization design of crossbeam for machining center of overpass type heavy gantry,” Journal of Beijing University of Technology, Vol. 46, No. 5, pp. 440–447, 2020.
-
Y. Li et al., “Multi-objective optimization design of preloading combined frame hydraulic press driven by stiffness and mass,” Journal of Mechanical Engineering, Vol. 46, No. 1, pp. 140–146, 2010.
-
R. Jiang, Z. Jin, D. Liu, and D. Wang, “Multi-objective lightweight optimization of parameterized suspension components based on NSGA-II algorithm coupling with surrogate model,” Machines, Vol. 9, No. 6, p. 107, May 2021, https://doi.org/10.3390/machines9060107
About this article

This study was supported by the Natural Science Foundation of Fujian Province (2022J05257) and the Fujian Science and Technology Guidance Project (2024H0022).
The datasets generated during and/or analyzed during the current study are available from the corresponding author on reasonable request.
Bingjie Zhong: writing-original draft preparation, writing-review and editing. Chang Lin: conceptualization and project administration. Zhijie Huang: investigation. Tianhua Lin: resources.
The authors declare that they have no conflict of interest.
